Click to watch the video: Master Chen's 11.28 Video: Will the market return to 32000? Analysis of historical cases in the medium and long term

So today's video, let's talk about whether the current market will return to 32000, including some knowledge about buying points. Let's first take a look at this Bitcoin weekly chart, which is the method I used last year to tell everyone to buy the dip below 20,000. It's actually about looking at the space.
If it is at a relatively low point in space, if there are two consecutive weeks of decline of more than 40% in the weekly chart, it is possible that it is a very panic low point, because the main force only uses such a large decline in a short period of two weeks. If the decline exceeds 40%, then the main force is deceiving people. They use this kind of decline to clean up retail investors.
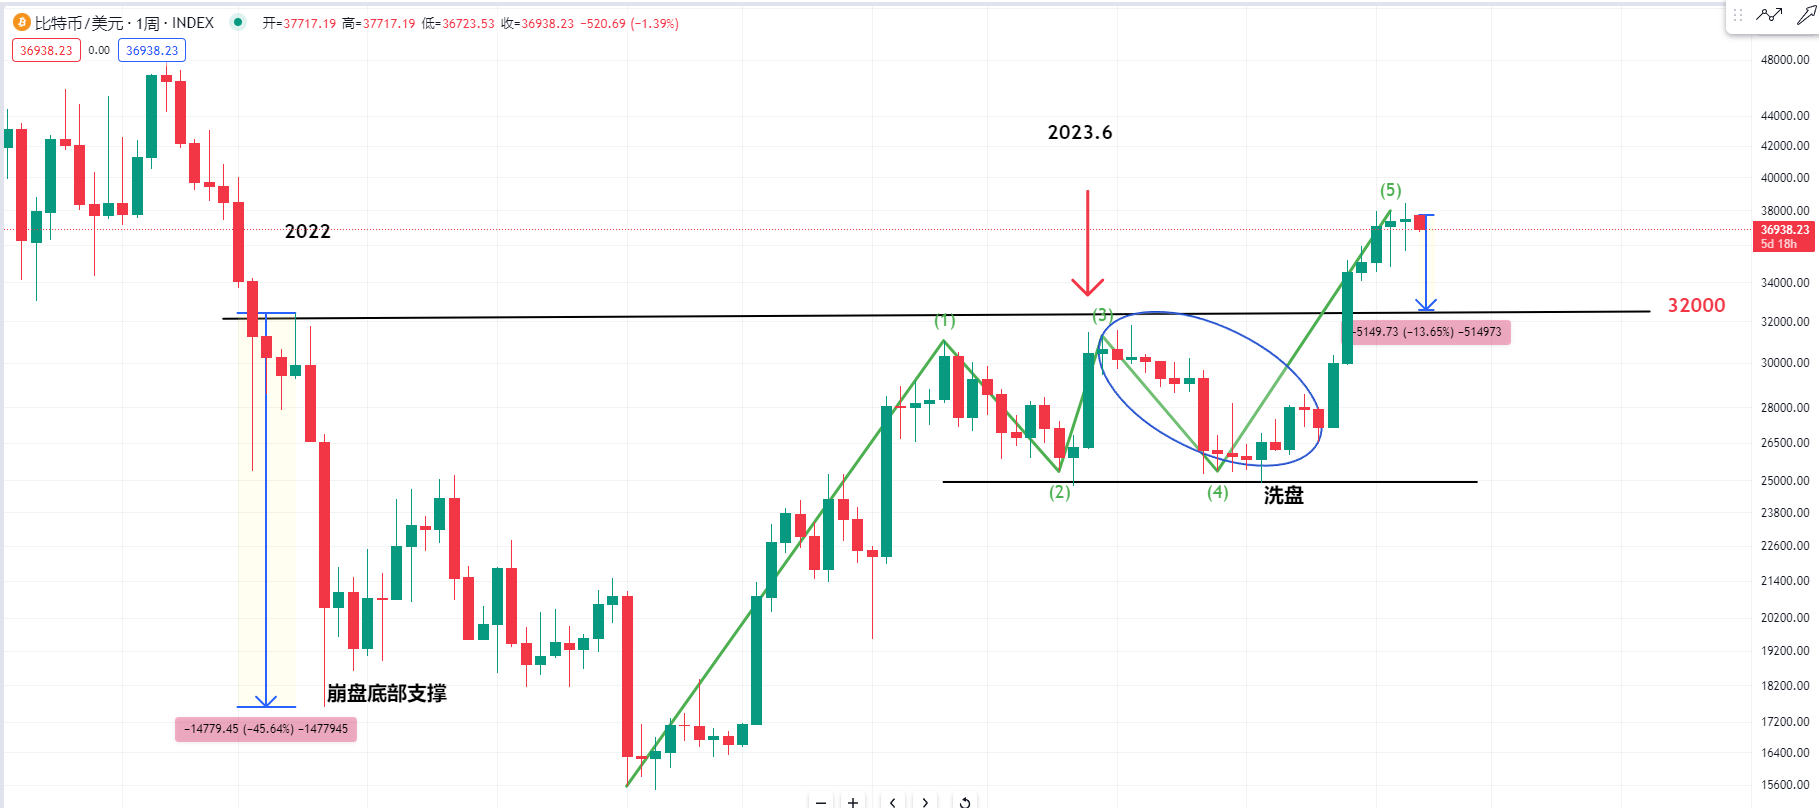
So we can take a look at the current structure of Bitcoin. Its price has already returned to the starting point of the collapse in June 2022, which was at 32000. Some friends are also asking whether Bitcoin will have a chance to return or whether it will fall back to 32000. In history, at the bottom of such a collapse, like this kind of support level, there have been cases of retracement.
But my view is that this time there will be no retracement, because historically there have been few cases of such a flat two-turn structure behind the first wave, creating an illusion, whether it is a false impression of a head and shoulders or a false impression of a head and shoulders. But in the end, it is a consolidation area breaking upwards.
So there are three types of trends in morphology, whether it is a triangular consolidation or a box consolidation, there is a kind of breakthrough directly, and there is also a kind of breakthrough that will retrace, and there is also a kind that is a false breakthrough, and then a real breakthrough. So we must remember these three types of trends.
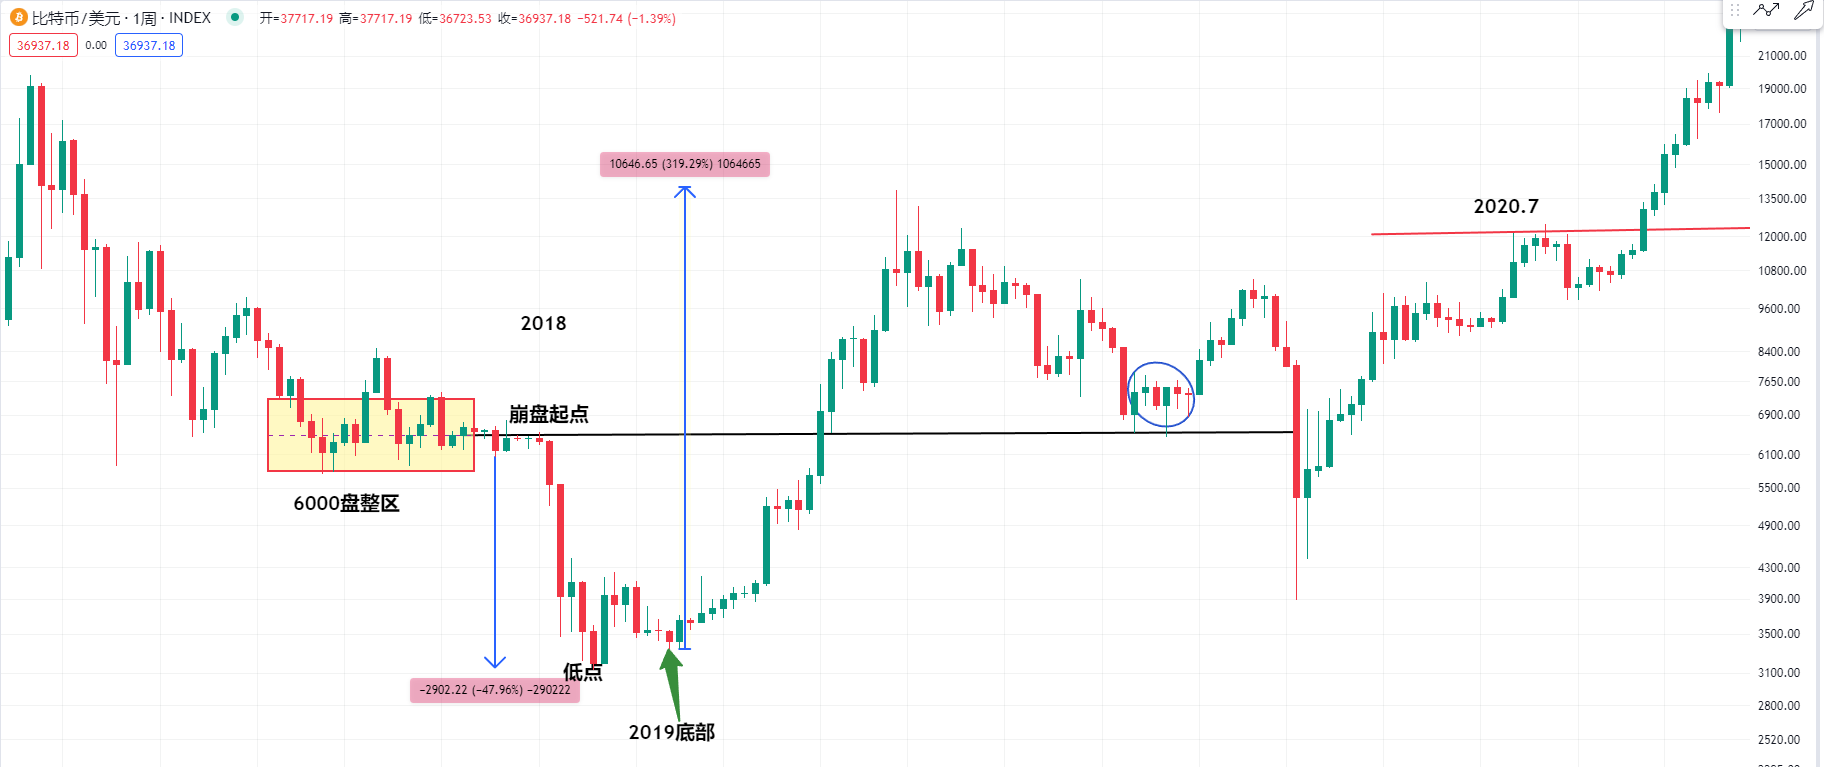
Then let's take a look at the position of Bitcoin's collapse in 2018, which was from the consolidation area of $6000. It started to collapse to this low point because its two-week candlestick dropped by more than 40%. Then we can look at historical experience. At such a collapse point, it was the bottom of Bitcoin in 2019.
Then let's take a look at Bitcoin in the bull market of 2019. The first wave rose three times, and then it repressed back to the starting point of the collapse at that time.

Then we can take a look at the position of Bitcoin's collapse in 2014, which was at this position where it collapsed by more than 40% in just three weeks. The bottom is the bottom. Then we can take a look at the starting position of the collapse at that time. After the price broke through, there was a retracement, which was a direct retracement in the second week. But after going up later,
Let's observe. It won't go back to touch this support again. So we observed several cases, especially the consolidation range in 2015. After that, it did not repress back to this support, or in historical positions, we observed cases like this ascending triangle, and after the breakthrough, there was a case of repressing back to this support.
But let's observe some historical positions. For example, in July 2020, Bitcoin's high point, let's observe whether it broke through and repressed back to this support. It is obvious that it did not.
So I am also observing whether Bitcoin will repress back. Let's take a look at the space. If it is going to repress, the space is at most about 13%. But I personally think it may not repress, because the twists and turns at this position may not exclude the possibility of being similar to this position, and the thorough washing may have ended early here. It is possible that this time it will break through directly.
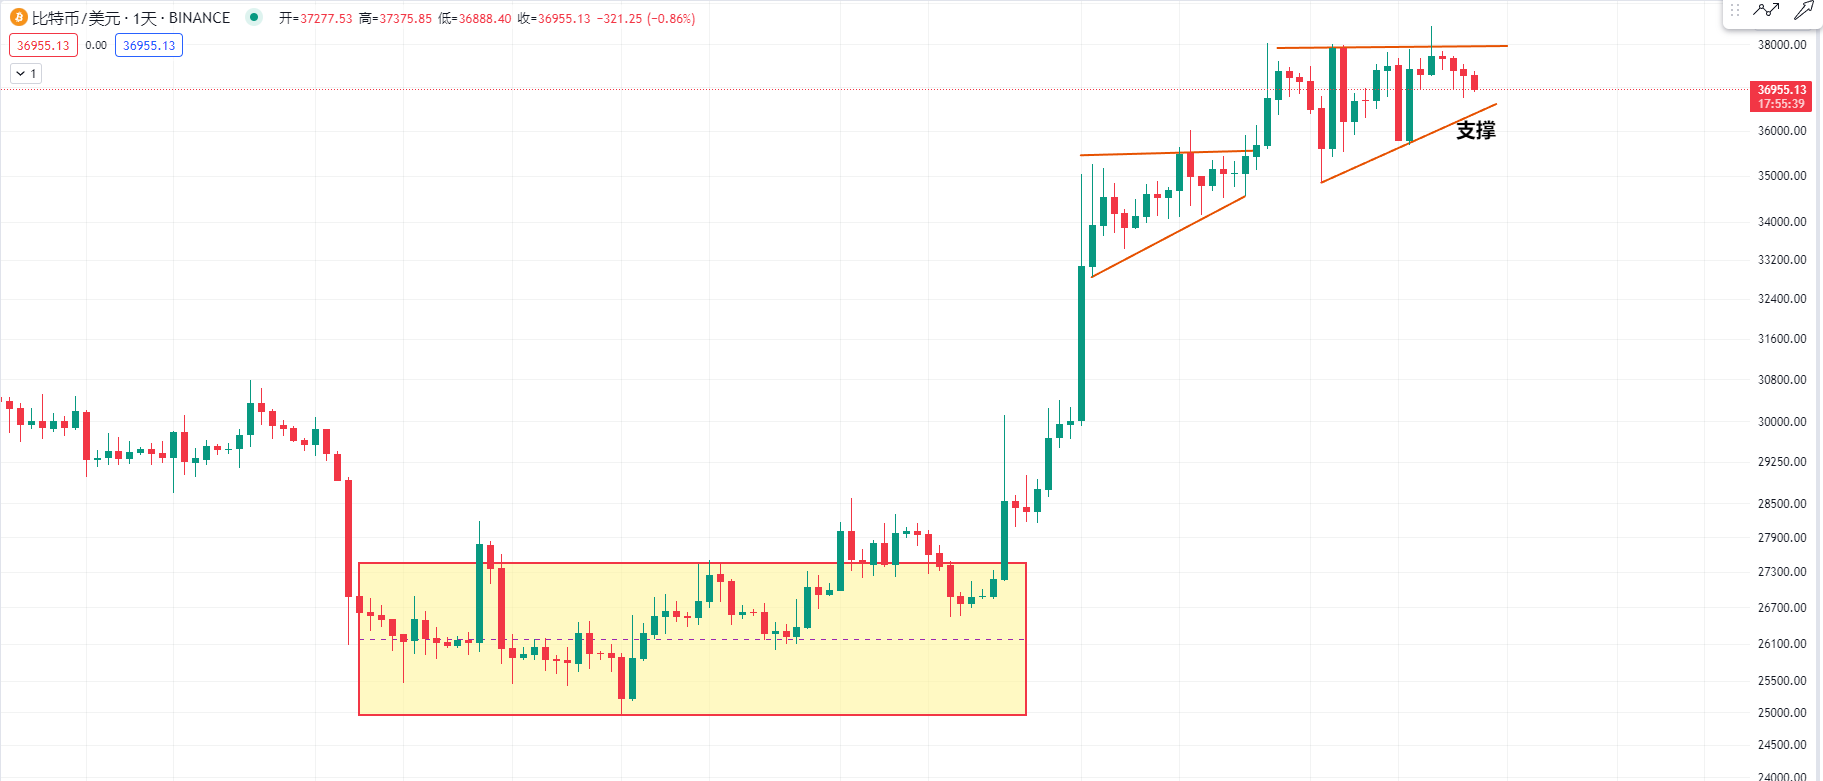
Then let's take a look at the technical form of Bitcoin's daily chart. We can see that the current consolidation feels like there are two ascending triangles. So the position where it fell to yesterday can also be observed for a very strong support below. It has been continuously tilting upwards to wash out.

It is possible that the current form is very similar to the position at that time in 2020, where it broke through this high point and did not repress. It can be clearly observed that there are several low points here that have been continuously tilting upwards, or there are opportunities to buy even when there is a decline, and then it continues to rise. Or later we can also see that Bitcoin has been rising all the time.
So I think it may not fall back, because recently the US dollar index, including the time before, I also told everyone that the US dollar index is expected to fall below 100.

Then let's take a look at Bitcoin's weekly chart. Why do I think it may not return to 32000? Mainly because the channel here is already very strong. After breaking through the upper edge of this channel, if we refer to Bitcoin in January, when it started from the low point, the weakest situation had a retracement at this position.
We can observe that the golden ratio retraced to the position of 0.382, which is near 21000. If it rises from the current position to the high point, it has also risen by about 44%. If the golden ratio is going to have a weak retracement, that is, the channel will not be broken, the weakest situation is approximately near 33000, which is a very strong support area of the golden ratio 0.382.
For more strategies, you can add live trading
Candlestick is king, trend is emperor. I am Master Chen, focusing on BTC, ETH spot and futures contracts for many years. There is no 100% method, only 100% following the trend; daily updates on macro analysis articles and technical analysis review videos on the entire network Friendly reminder: Only the public account of the column (as shown in the picture above) is written by Master Chen. The end of the article and other advertisements in the comment area have nothing to do with the author himself! Please be cautious in distinguishing between true and false. Thank you for reading.
免责声明:本文章仅代表作者个人观点,不代表本平台的立场和观点。本文章仅供信息分享,不构成对任何人的任何投资建议。用户与作者之间的任何争议,与本平台无关。如网页中刊载的文章或图片涉及侵权,请提供相关的权利证明和身份证明发送邮件到support@aicoin.com,本平台相关工作人员将会进行核查。


