
Will the bears continue after another decline?

① 20:50 Federal Reserve Director Cook speech
② 01:00 the next day Federal Reserve Daley speech
③ 01:00 the next day Federal Reserve Kashkari speech

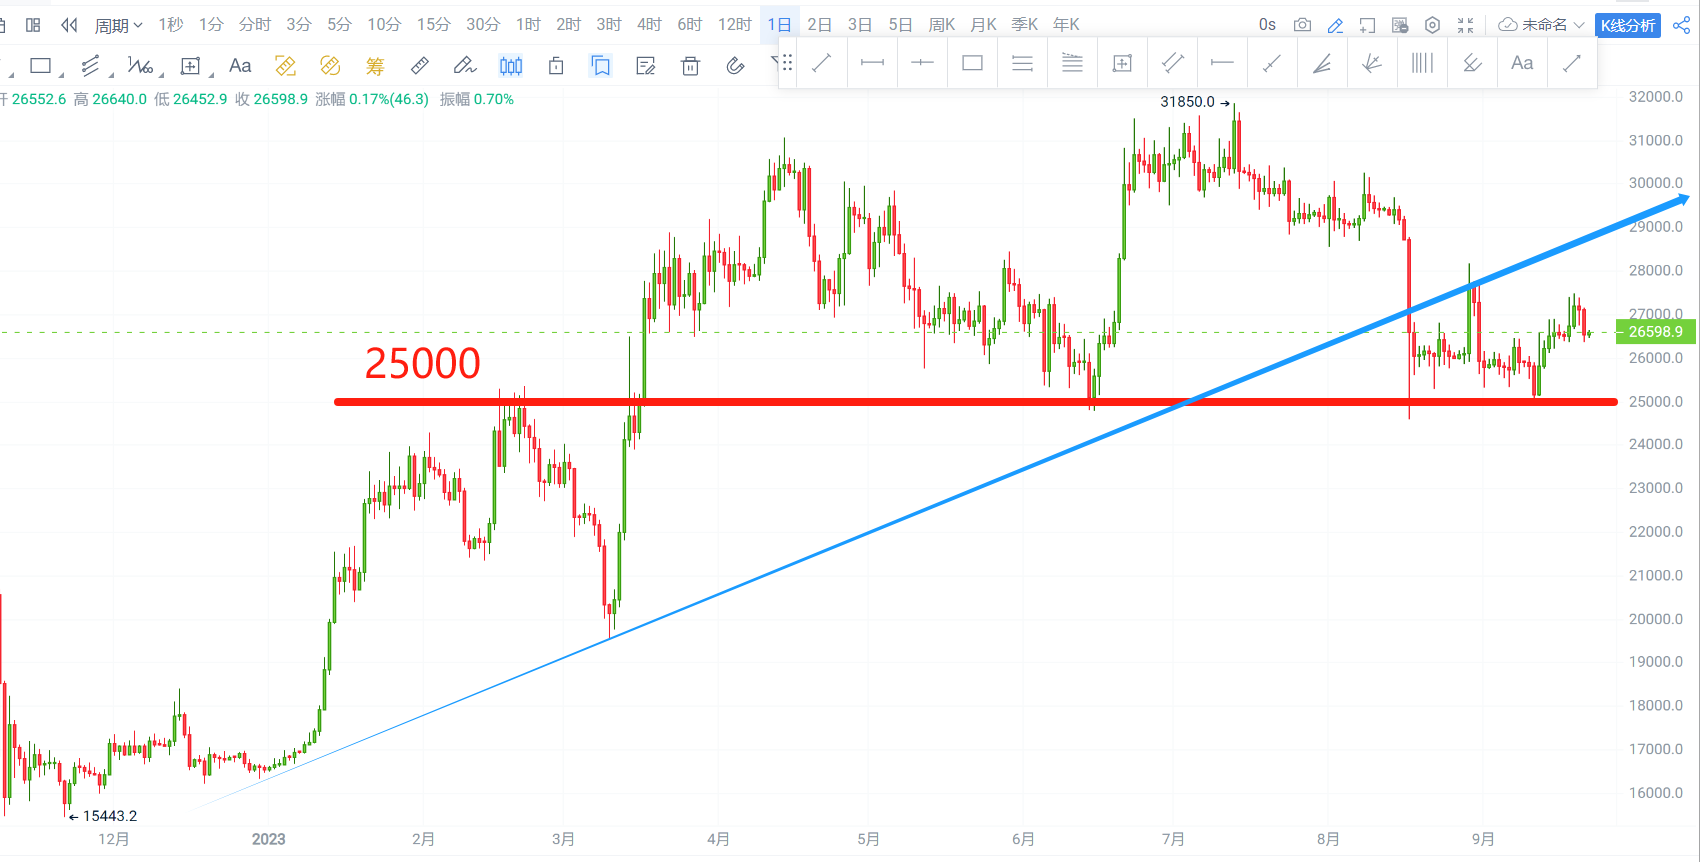
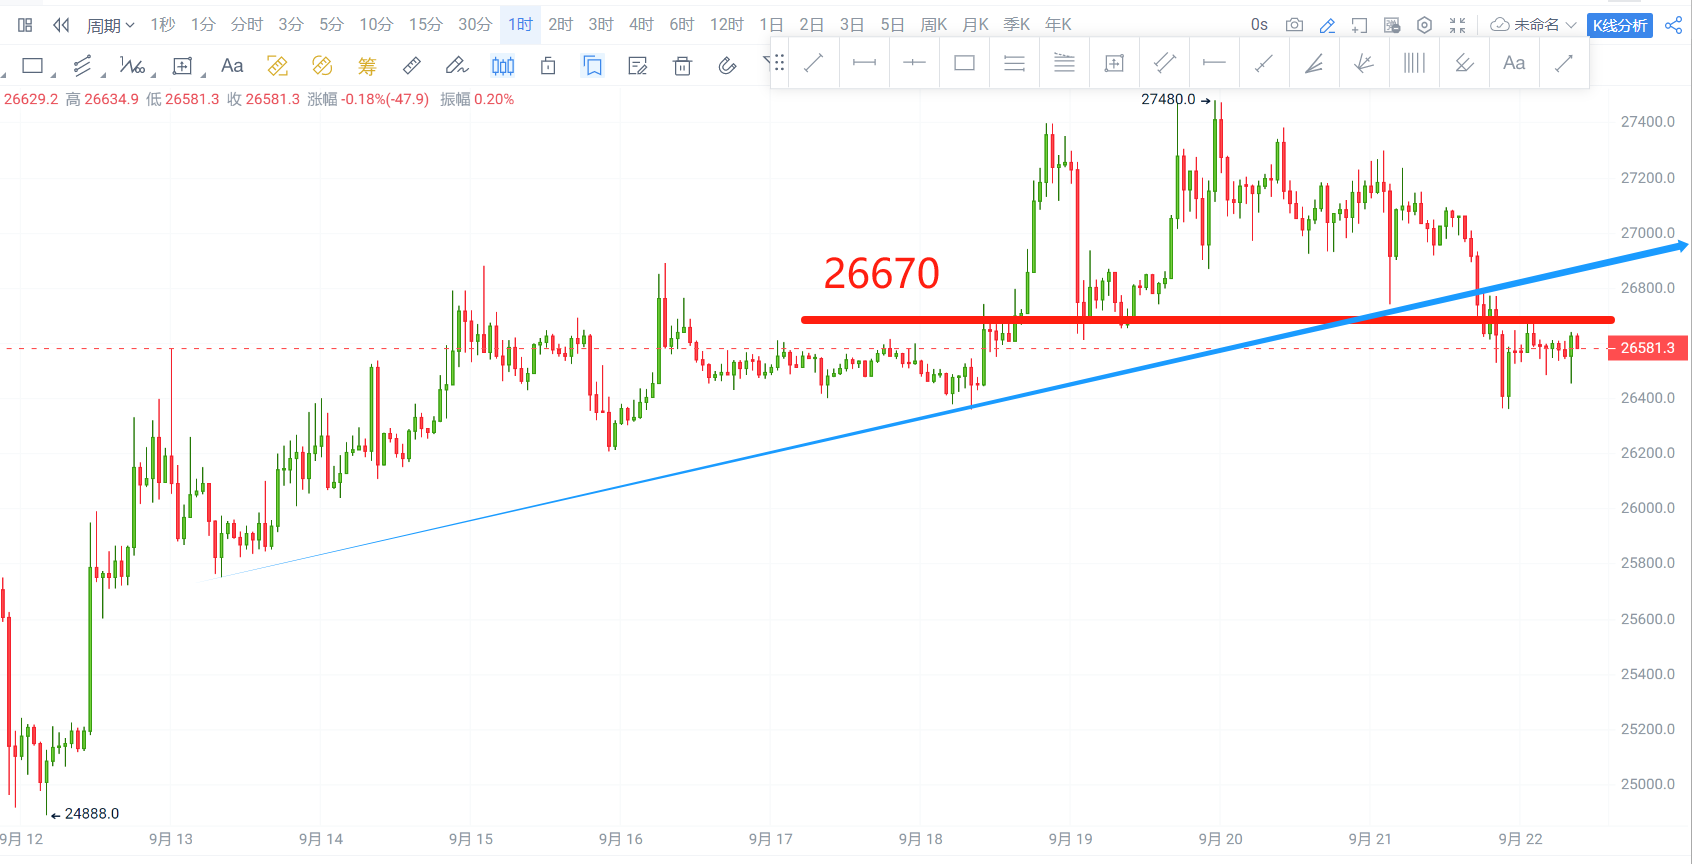
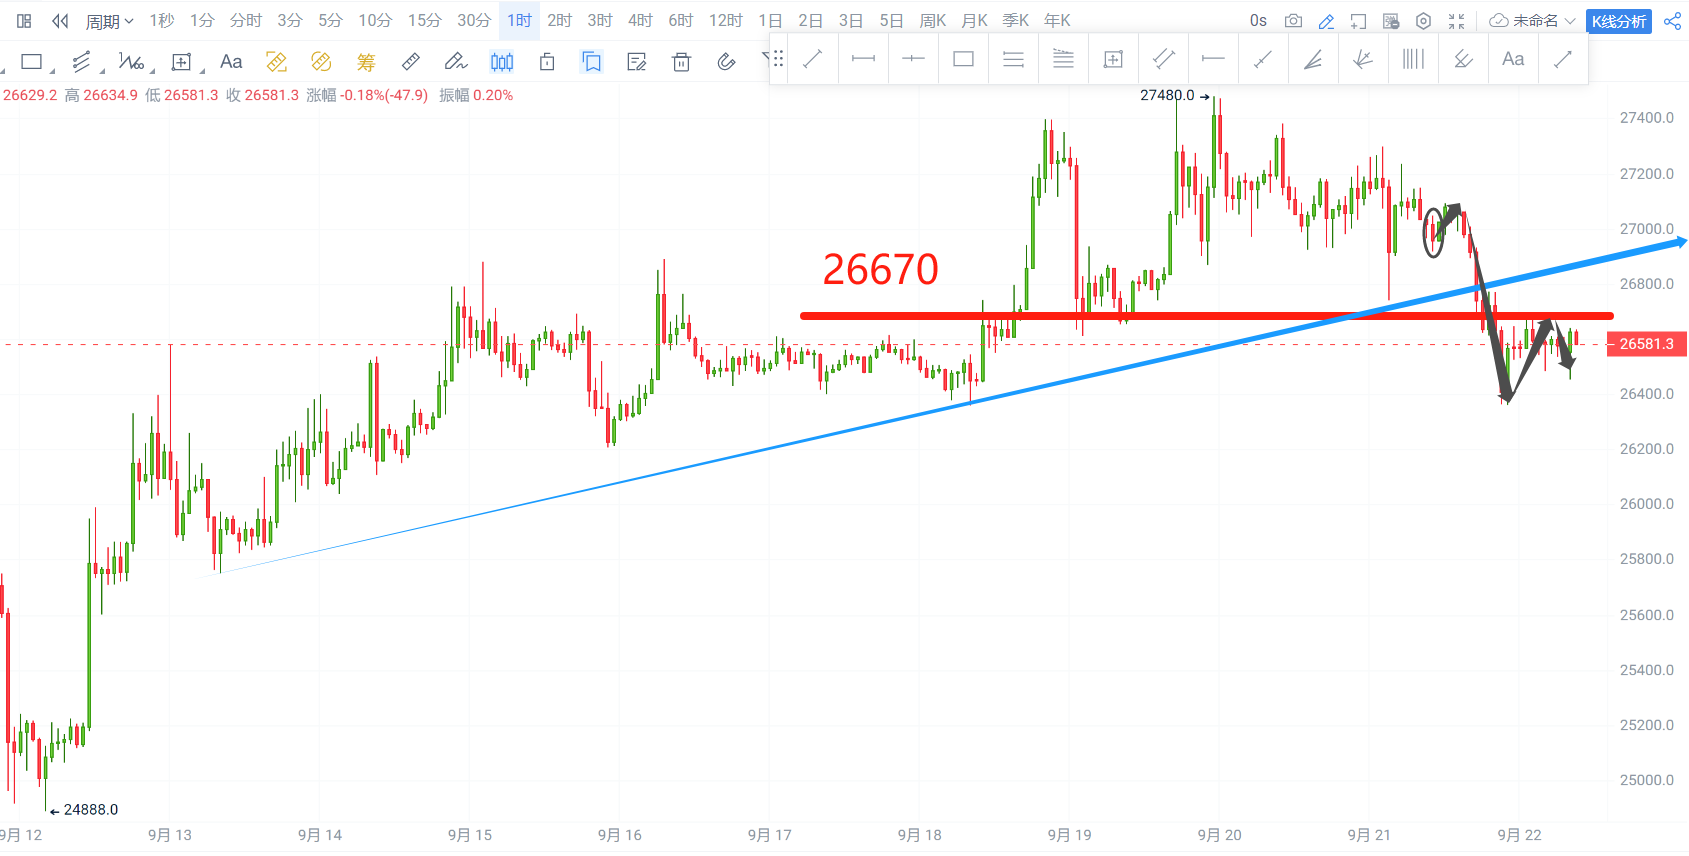
I. Bitcoin
- Daily chart: The price has broken below the trend line and is testing the support at 25000. Pay attention to the test results in the future.
- 1-hour chart: After breaking below the upward trend line and the position at 26670, there was a rebound. If the rebound does not break this resistance, there may still be a continued downward trend.
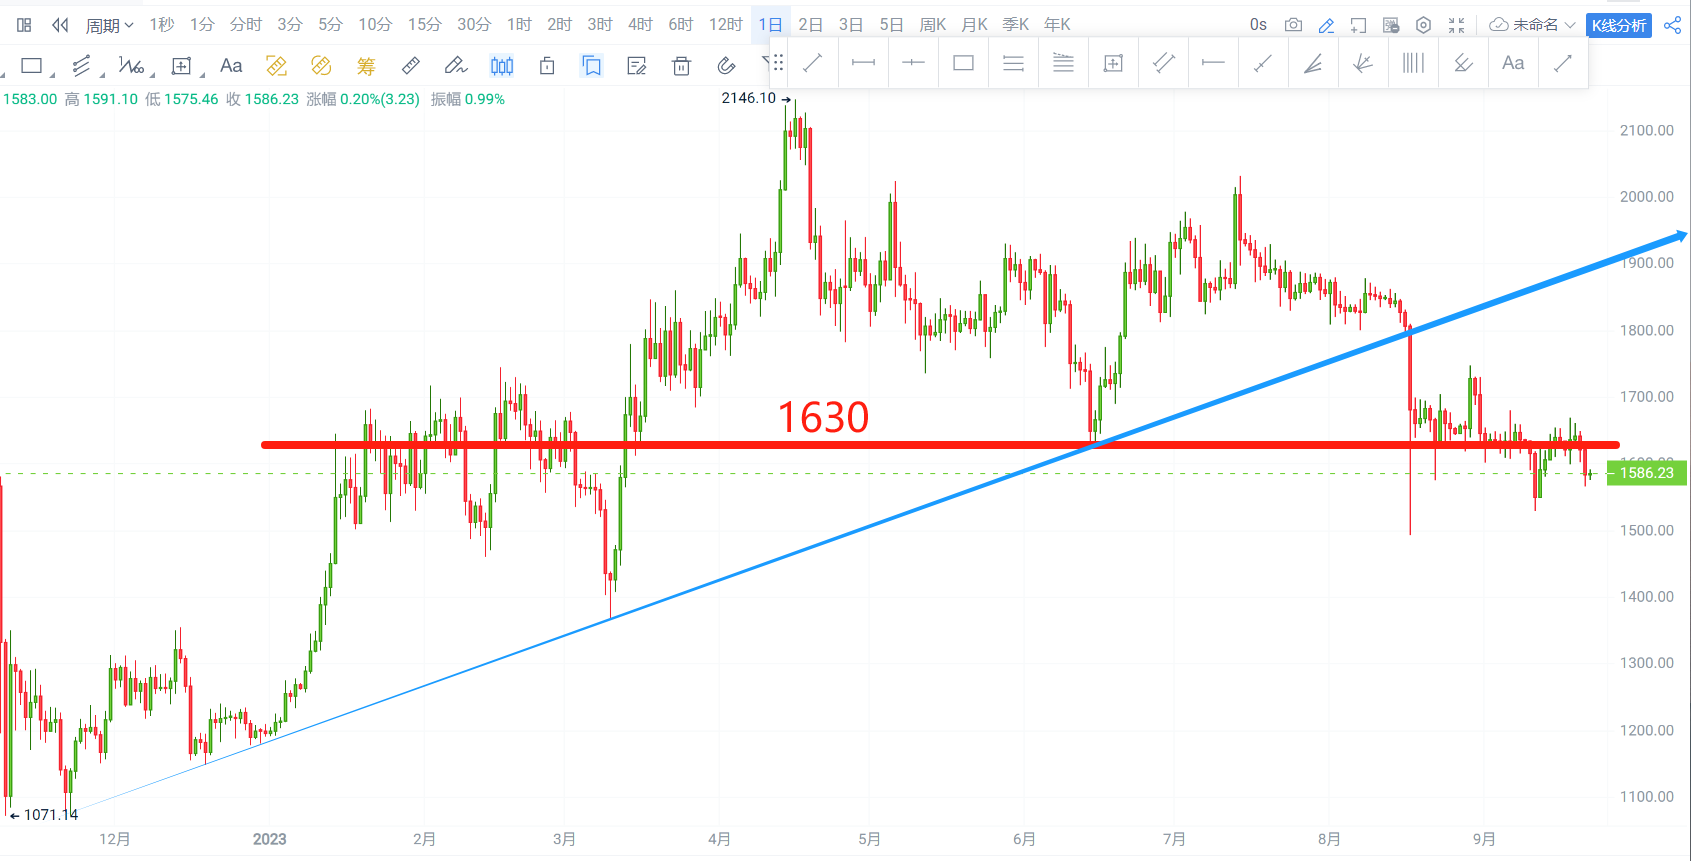
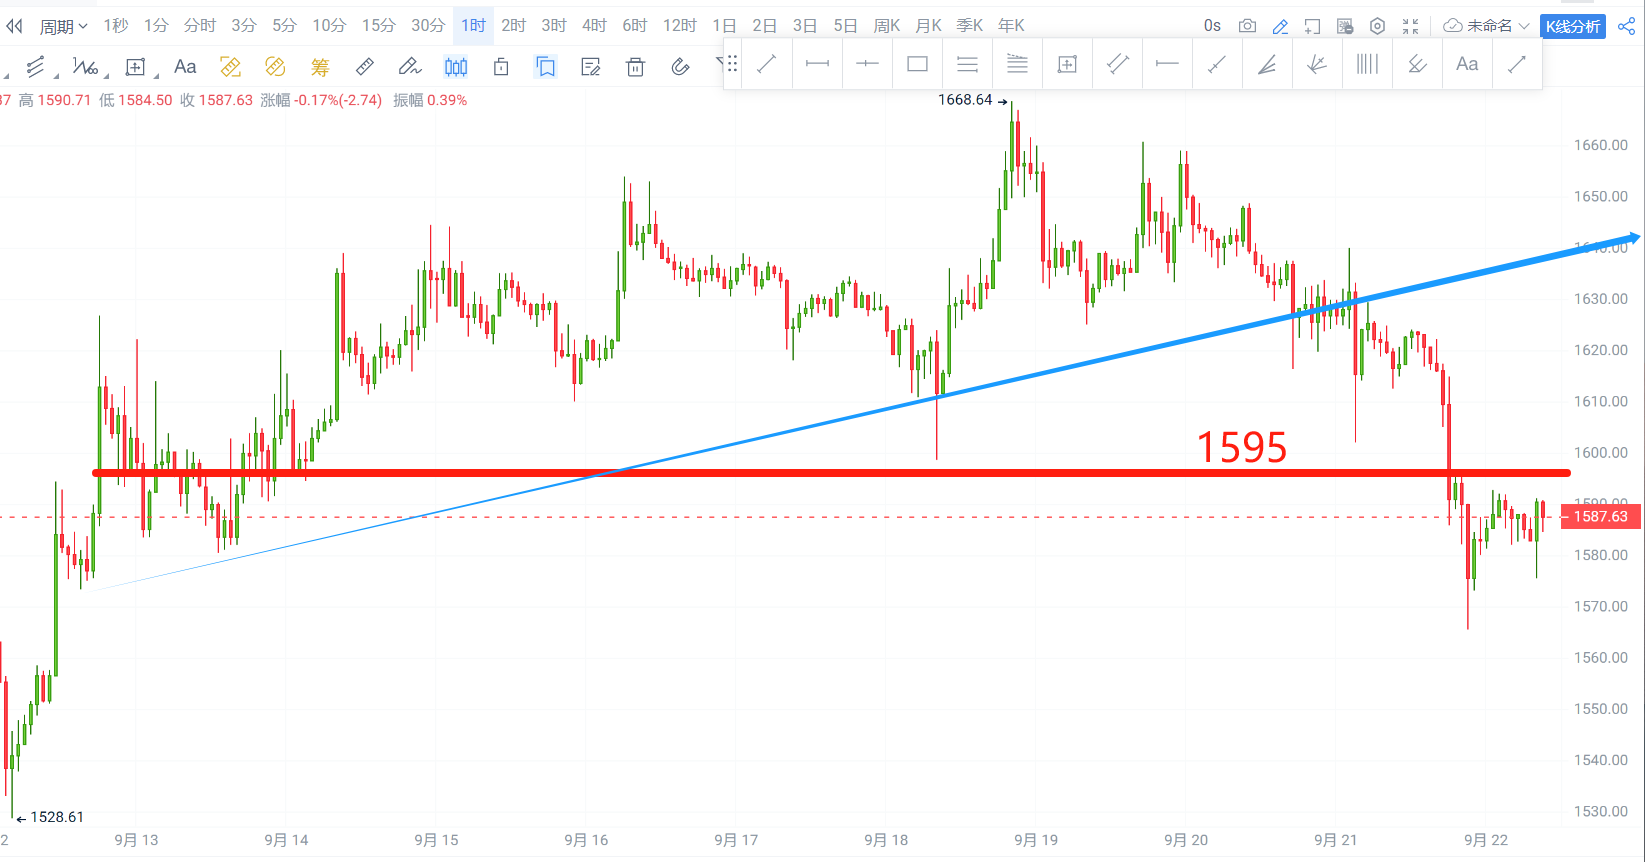
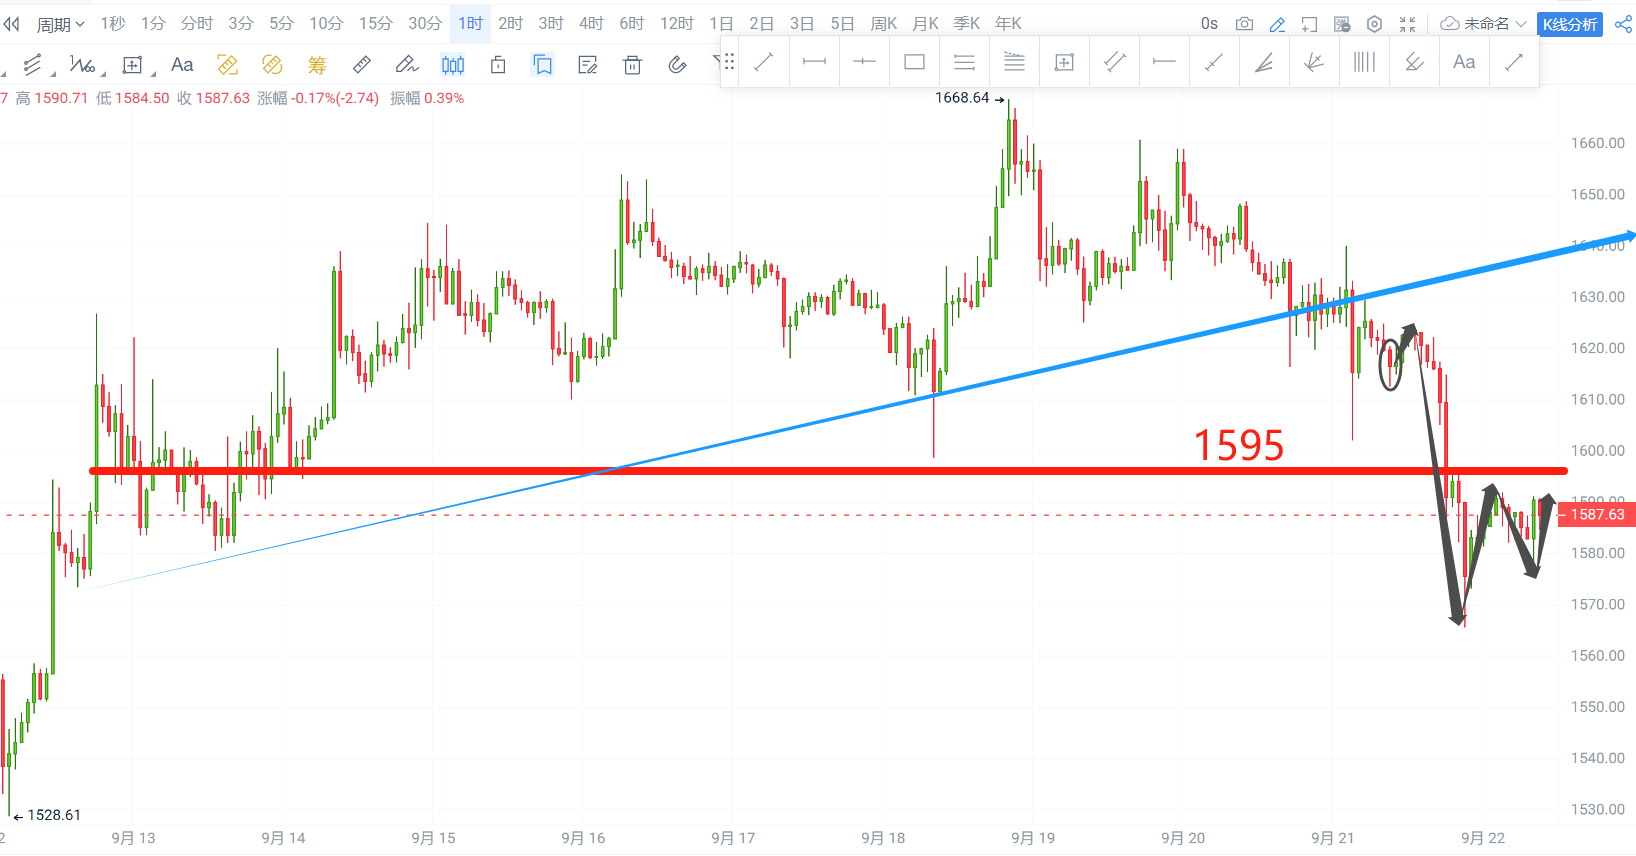
II. Ethereum
- Daily chart: The price has already broken below the trend line and the position at 1630. Pay attention to the oscillation test results in the future.
- 1-hour chart: After breaking below the position at 1595 in the short term, there was a rebound. If the rebound does not break this resistance, there may still be a continued downward trend.

I. Bitcoin
- Yesterday's view:
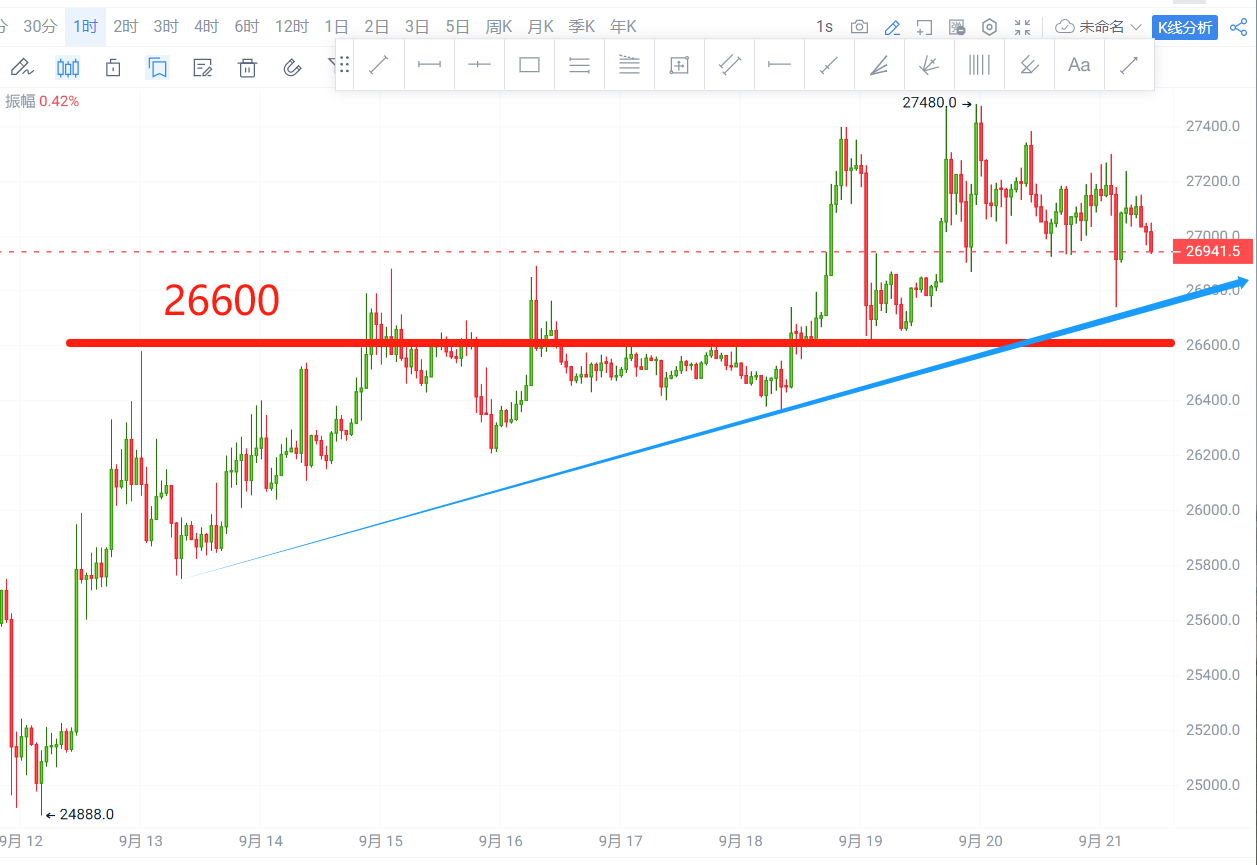
Summary: After the price broke above the position at 26600 in the short term, there was a pullback. If it does not break this support in the future, there is still a possibility of a continued upward trend. Pay attention to the resistance at 28030 and 28400; otherwise, breaking below will return to a downward trend, with support at 25780 and 25000.
- Future trend:
After breaking below the position at 26600, the future trend maintained oscillation near it, reaching as low as 26362.
II. Ethereum
- Yesterday's view:
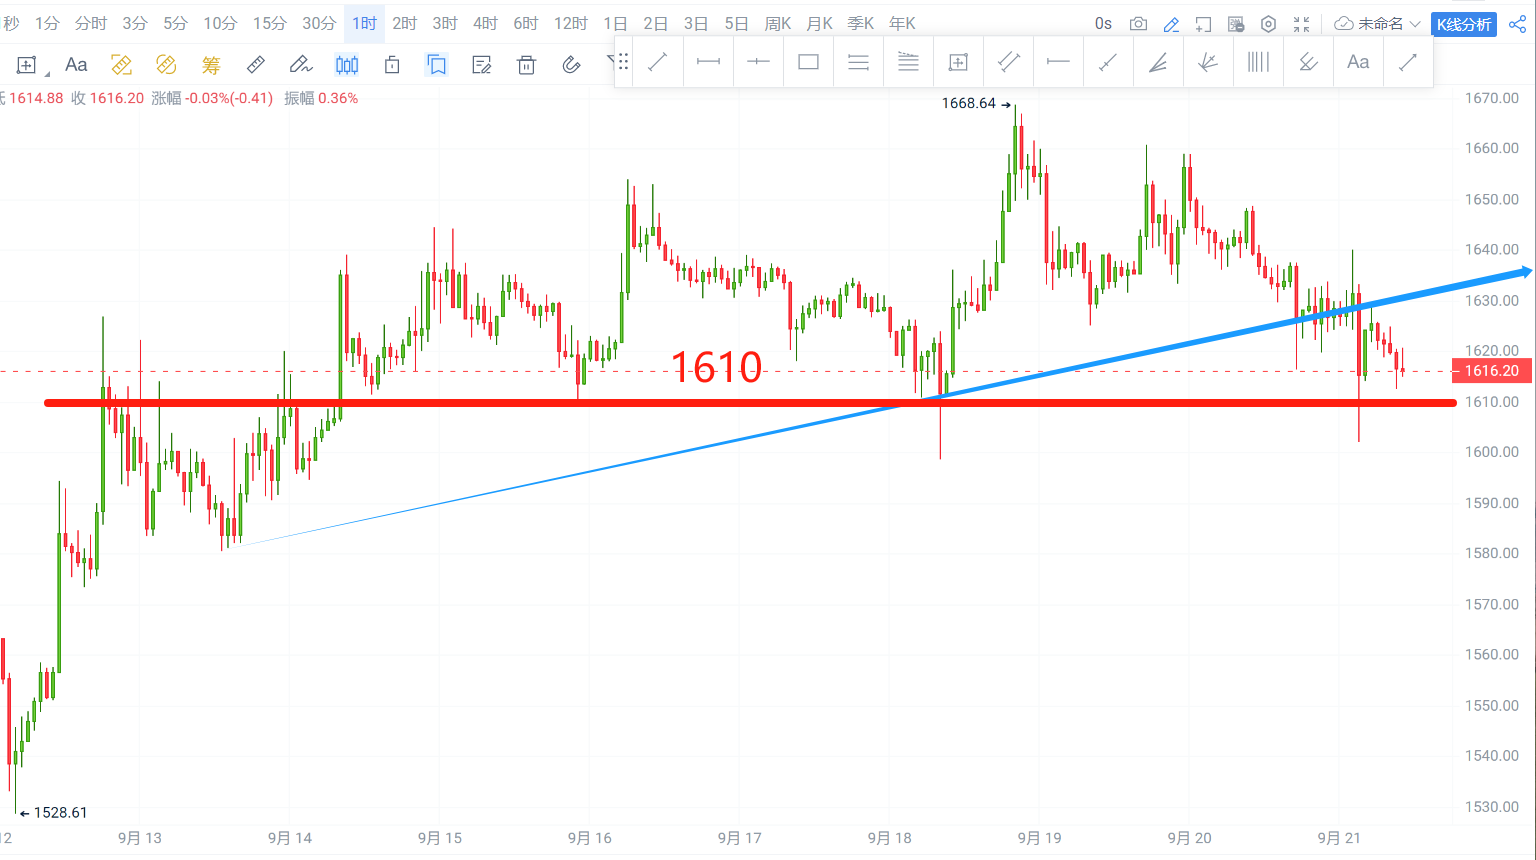
Summary: After the price broke above the position at 1610 in the short term, there was a pullback. If it does not break this support in the future, there is still a possibility of a continued upward trend. Pay attention to the resistance at 1685 and 1742; otherwise, breaking below will return to a downward trend, with support at 1582 and 1530.
- Future trend:
After the price broke below the position at 1610 in the short term, it continued to decline and successfully reached the first target at 1582, reaching as low as 1565.

I. Bitcoin
Summary: After the price broke below the upward trend line and the position at 26670 in the short term, there was a rebound. If the rebound does not break this resistance, there may still be a continued downward trend, with support at 26030 and 25000; otherwise, breaking above will initiate a rebound trend, with resistance at 27400, 28030.
II. Ethereum
Summary: After the price broke below the position at 1595 in the short term, there was a rebound. If the rebound does not break this resistance, there may still be a continued downward trend, with support at 1530 and 1500; otherwise, breaking above will initiate a rebound trend, with resistance at 1630, 1662.


Joining the Tianxia community can provide the following services:
Morning video explanation updated daily;
Daily updated text and image viewpoints;
Technical indicator analysis and answers in the group;
Layout of long and short strategies in the medium and long term;
High winning rate short-term trading strategies;
Trading system long and short signals reference software authorization;
Enjoy lower transaction fees by joining the community for practical combat;
One-on-one or one-on-many guidance and answers (by appointment);
Multiple learning courseware packages to bid farewell to incomprehension;
Multiple analysts (lecturers, practical teachers) guide you through the coin circle, with seven live courses daily
(Service content is continuously updated…)


免责声明:本文章仅代表作者个人观点,不代表本平台的立场和观点。本文章仅供信息分享,不构成对任何人的任何投资建议。用户与作者之间的任何争议,与本平台无关。如网页中刊载的文章或图片涉及侵权,请提供相关的权利证明和身份证明发送邮件到support@aicoin.com,本平台相关工作人员将会进行核查。


