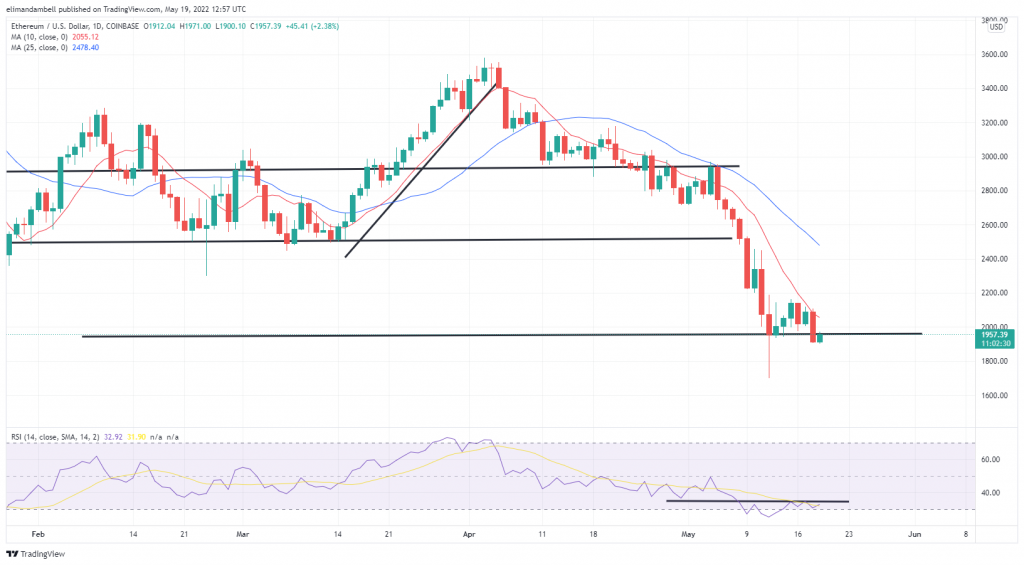
Following several sessions of consolidation, ETH has finally caved in, dropping below the $2,000 floor in the process. As we move towards the end of the week bitcoin also fell for a second consecutive session, with prices falling below $29,000.
Bitcoin dropped below the $29,000 level on Thursday, as bears continued to push prices lower this week.
As a result of a second consecutive session of selling, BTC/USD fell to an intraday low of $28,708.96 on Thursday.
This drop comes after prices were trading at a level of $30,016.18 on Wednesday. However they’ve fallen by over 3% as traders still look to find a stable support point.
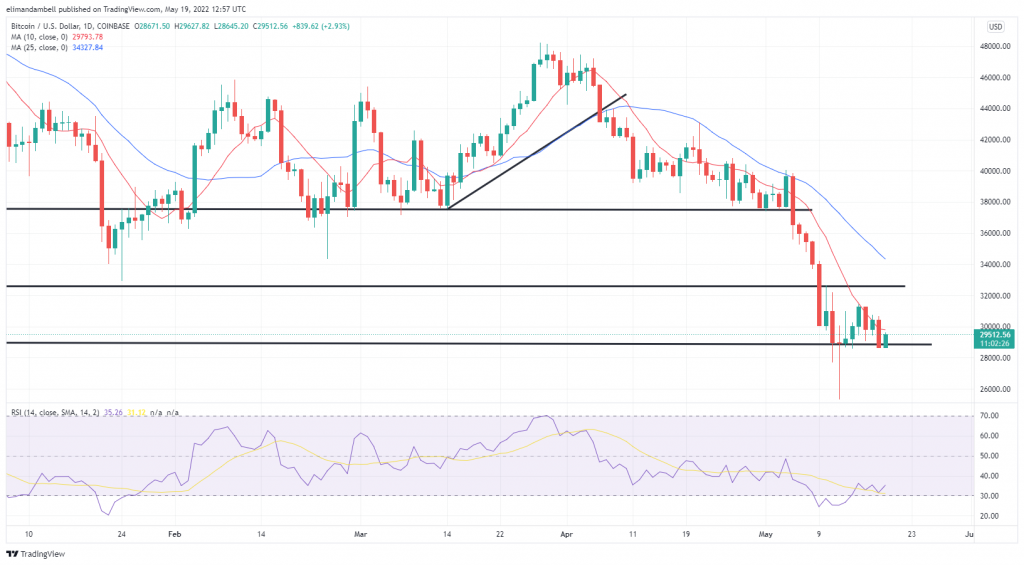
BTC/USD – Daily Chart Despite the 14-day Relative Strength Index (RSI) trading below 30, which is in oversold territory, many do not expect bulls to buy any dips, as some believe we could still be heading to further lows. Looking at the chart, this indicator is currently tracking at 34.94, which is marginally below a ceiling of 35.46. We will likely not see any significant gains until either a breakout from the ceiling, or a move towards last week’s low of 25. After several days of consolidation, ETH plunged on Thursday, with prices falling below $2,000. Despite an onslaught of bearish pressure this week, ETH/USD was mostly able to sustain this sentiment until today. As of writing, ETH fell to an intraday bottom of $1,907.02, which is roughly 5% lower than yesterday’s peak at $2,039.83. ETH/USD – Daily Chart Yesterday, we discussed that we could see the $1,950 floor hit, which has not only happened, but it has been broken. However, as the day progressed prices moved back towards that level, which confirms its status as a support point. As of writing, ETH is trading at $1,952.28, with the 14-day RSI slightly below a ceiling of 35. 免责声明:本文章仅代表作者个人观点,不代表本平台的立场和观点。本文章仅供信息分享,不构成对任何人的任何投资建议。用户与作者之间的任何争议,与本平台无关。如网页中刊载的文章或图片涉及侵权,请提供相关的权利证明和身份证明发送邮件到support@aicoin.com,本平台相关工作人员将会进行核查。