Hyperliquid is showing an unusual combination of improving spot flows and strengthening price action, with 12-hour spot net flows surging more than 350% while HYPE attempts to establish itself above a critical technical area. The move suggests that the latest recovery has more behind it than derivatives speculation alone.
Spot flows surge
Over the 12-hour window, HYPE recorded approximately $8.84 million in spot inflows against $7.31 million in outflows. That produced positive net inflows of roughly $1.53 million, with the net change metric jumping 353.49%.
HYPE/USDT Chart by TradingView
This is particularly notable because shorter windows remain negative. The four-hour spot net flow stands at approximately -$381,000, while the eight-hour figure is around -$287,000. The 12-hour reading therefore captures an earlier period of substantially stronger accumulation that still outweighs more recent selling.
HOT Stories Solana Set for Major Finality Upgrade Shiba Inu (SHIB) Hits Zero on 2 Critical Thresholds, Ethereum (ETH) Reaches Pre-Golden Cross, Hyperliquid (HYPE) Breaks Through: Crypto Market Review
Futures flows tell a different story. HYPE recorded approximately $102.25 million in 12-hour futures outflows against $92.66 million in inflows, producing a $9.59 million negative balance. Eight- and four-hour futures flows are also negative.
That divergence can actually strengthen the quality of the current setup. Spot demand represents direct acquisition of HYPE, whereas futures activity can create leveraged exposure without equivalent underlying buying. Positive spot flows combined with derivatives outflows suggest some leverage is leaving while underlying spot demand remains comparatively stronger.
HYPE's price reflects the surge
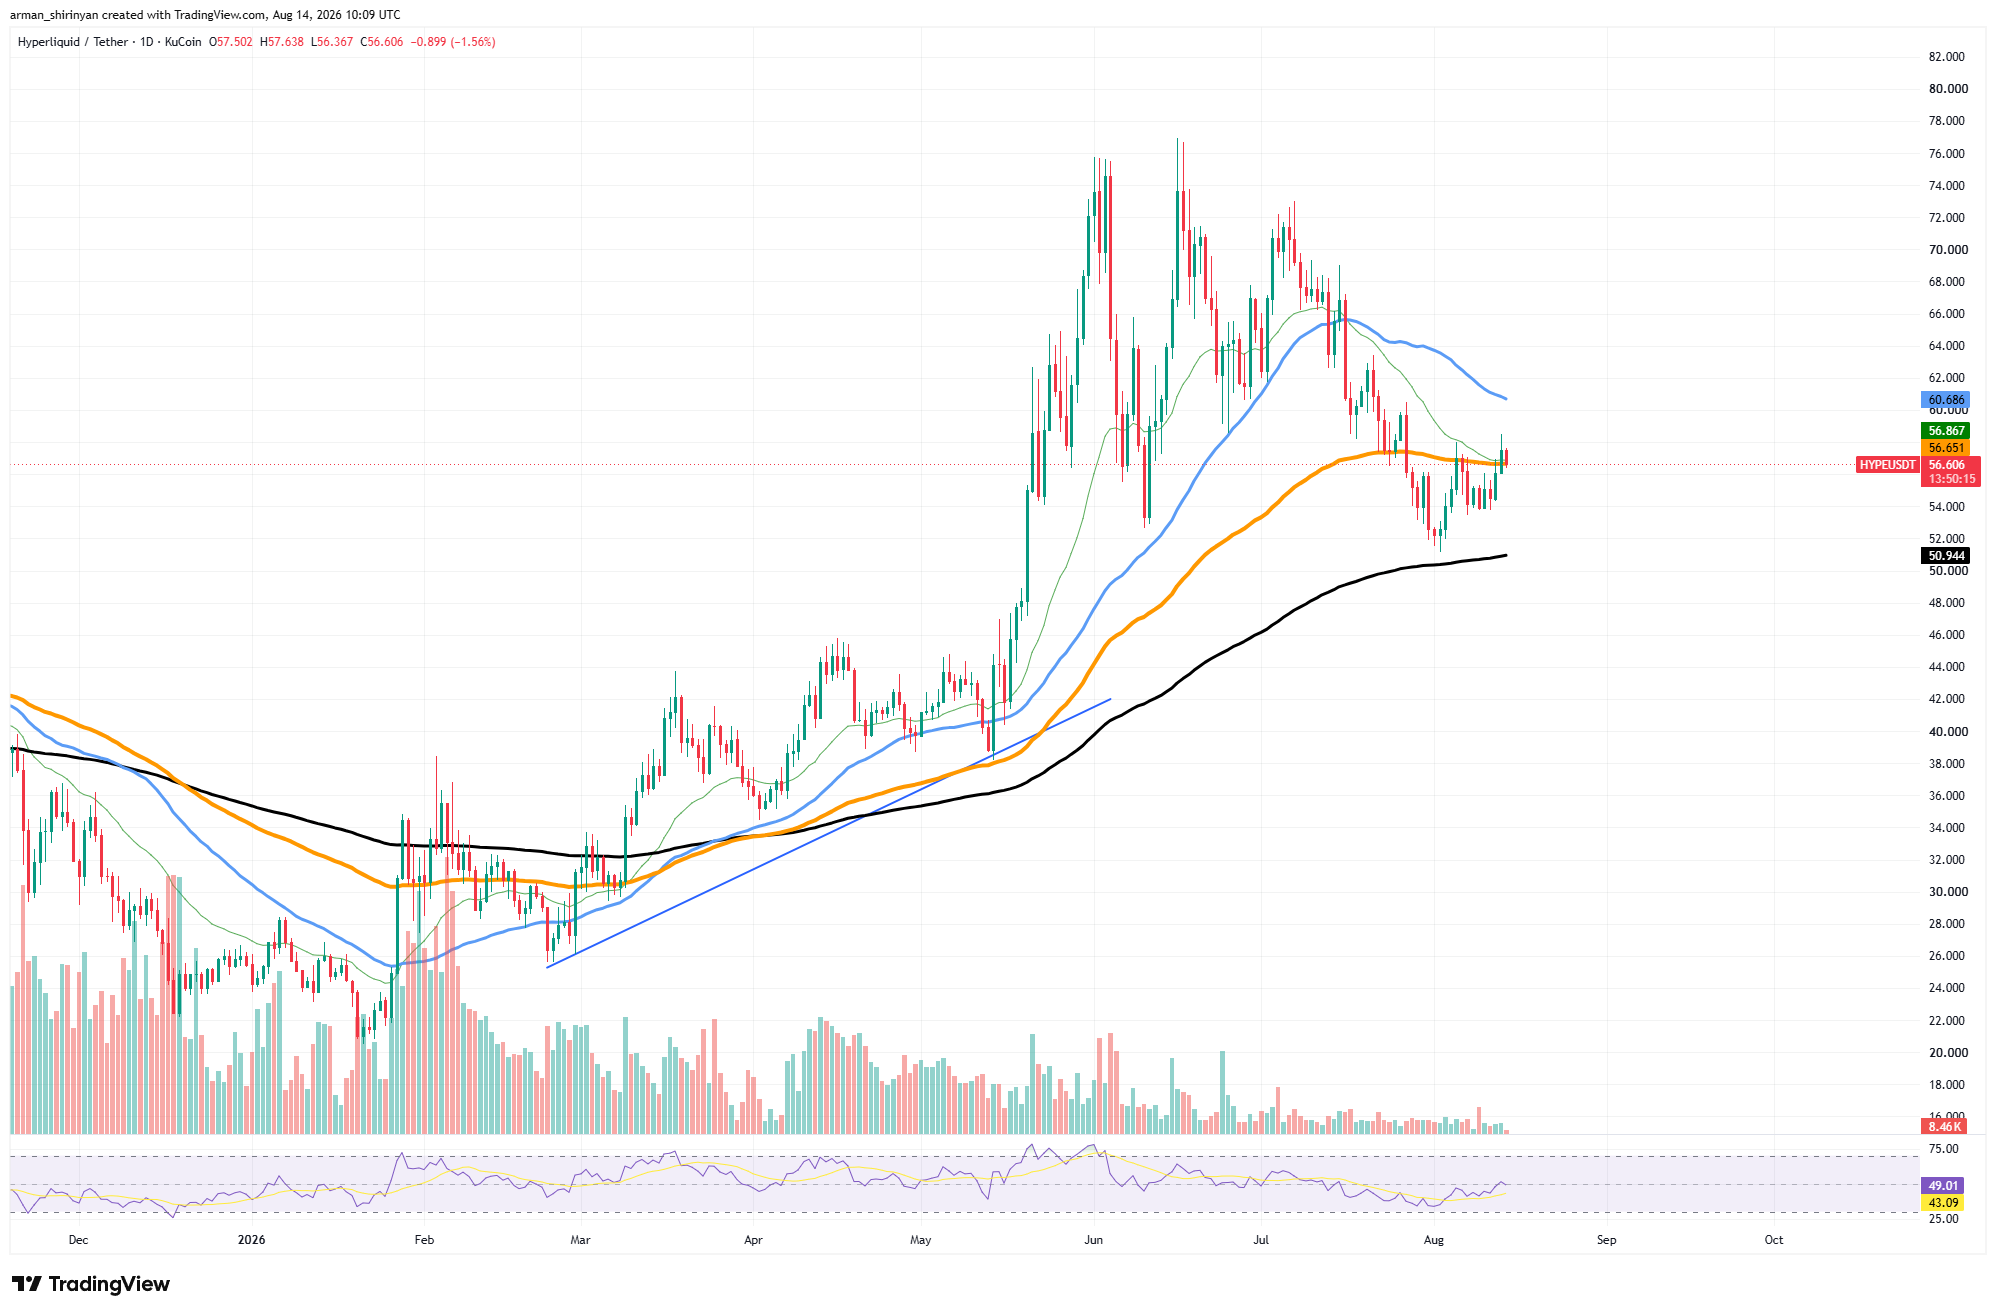
HYPE trades around $56.58 after recovering from the $52 region. Price is now battling the 100-day moving average around $56.65 and the short-term average near $56.87. Establishing support above approximately $57 would represent a meaningful breakout from the recent consolidation.
The next major obstacle sits at the 50-day moving average near $60.69. A successful move through $60–$61 could expose the $64–$66 region and substantially improve the recovery structure.
Meanwhile, the 200-day moving average continues rising near $50.94, providing a significant long-term support level underneath the market.
The 350% spot-flow increase does not guarantee continuation, particularly because shorter-term flows have already turned negative. But HYPE currently has something more constructive than a leverage-driven bounce: positive 12-hour spot accumulation, reduced futures exposure, and a price attempting to break through resistance at the same time.
免责声明:本文章仅代表作者个人观点,不代表本平台的立场和观点。本文章仅供信息分享,不构成对任何人的任何投资建议。用户与作者之间的任何争议,与本平台无关。如网页中刊载的文章或图片涉及侵权,请提供相关的权利证明和身份证明发送邮件到support@aicoin.com,本平台相关工作人员将会进行核查。


