Geopolitical deadlock supports commodities, the US-Iran confrontation ignites the oil gap, yet oil prices remain stagnant? Inflation cools, ETF inflows continue, why isn't BTC rising but rather falling?
There is currently no substantial progress in US-Iran negotiations, and Iran's stance is firm: if the US does not accept Iran's conditions, the Strait of Hormuz will remain blocked.
Trump claims the US fully controls the Strait of Hormuz, but shipping and satellite data show that Iran's main export ports are basically shut down, leading to a stalemate where neither side is fighting nor at peace.
The IEA estimates that disruptions in the Strait would result in a global daily oil supply gap of 1.8 million barrels in the third quarter. However, the three major energy agencies have simultaneously lowered their demand forecasts, combined with an unexpected increase in US oil inventories of 17.42 million barrels last week, limiting the potential for oil price increases, with WTI fluctuating around $83.
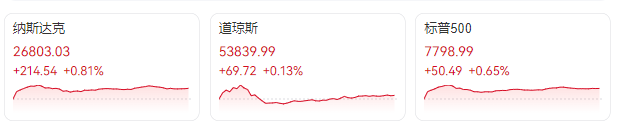
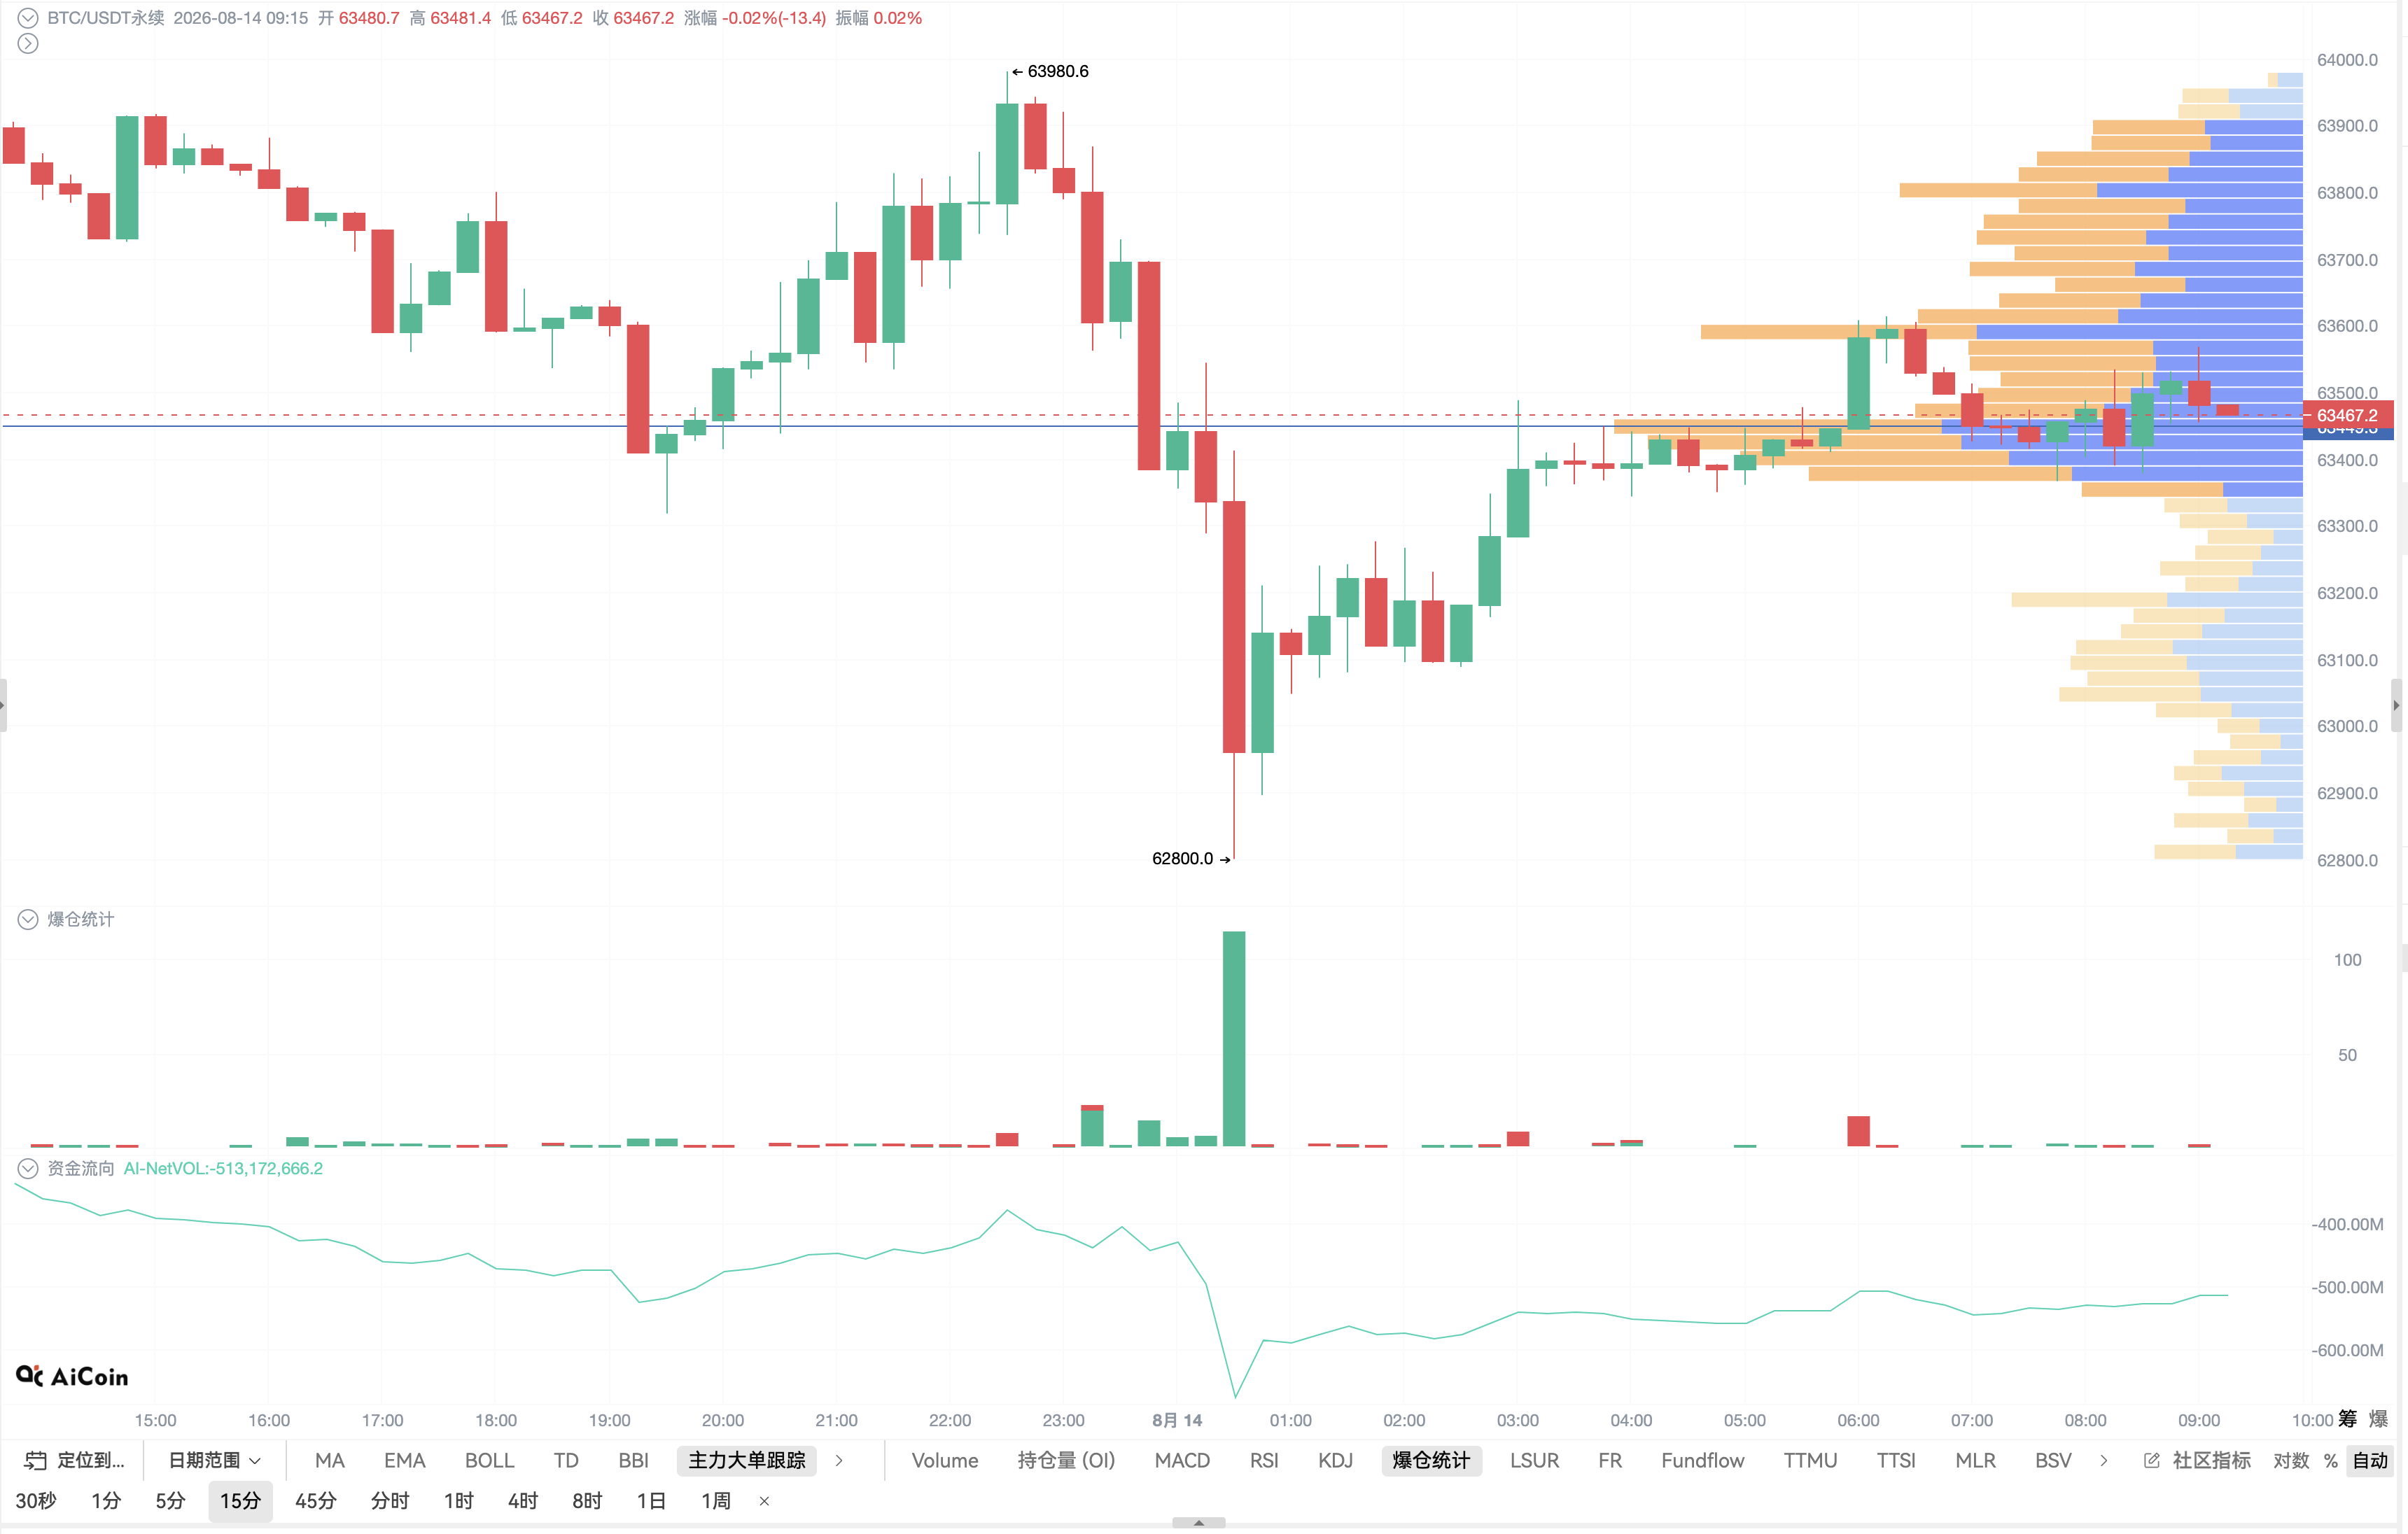
Now let's look at the overnight market. The US stock market shows divergence, with the S&P 500 up 0.6%, reporting 7798 points, approaching a historical high; the Nasdaq is up 0.8%, and the Dow Jones has a slight increase, while the AI sector continues to strengthen, with CoreWeave and Nebius maintaining high popularity. The dollar index hovers around 99.8, showing slight fluctuations after the inflation data release. Gold remains around $4425, supported by mild inflation and a retreat in interest rate hike expectations, but the US-Iran standoff suppresses safe-haven buying. Bitcoin is currently priced around 63450, with CPI and PPI confirming mild inflation, but failing to stimulate a bullish trend. Its correlation with gold has rebounded from -0.9 at the beginning of the year to 0.7, gradually returning to its status as digital gold, stuck in the range of 62000 to 66000, with continuing low transaction volumes.
BTC has weakened after the CPI and PPI both confirmed the cooling inflation, which is a typical signal of bullish dullness. Current price is around 63450, still oscillating within the larger range of 62000 to 66000.
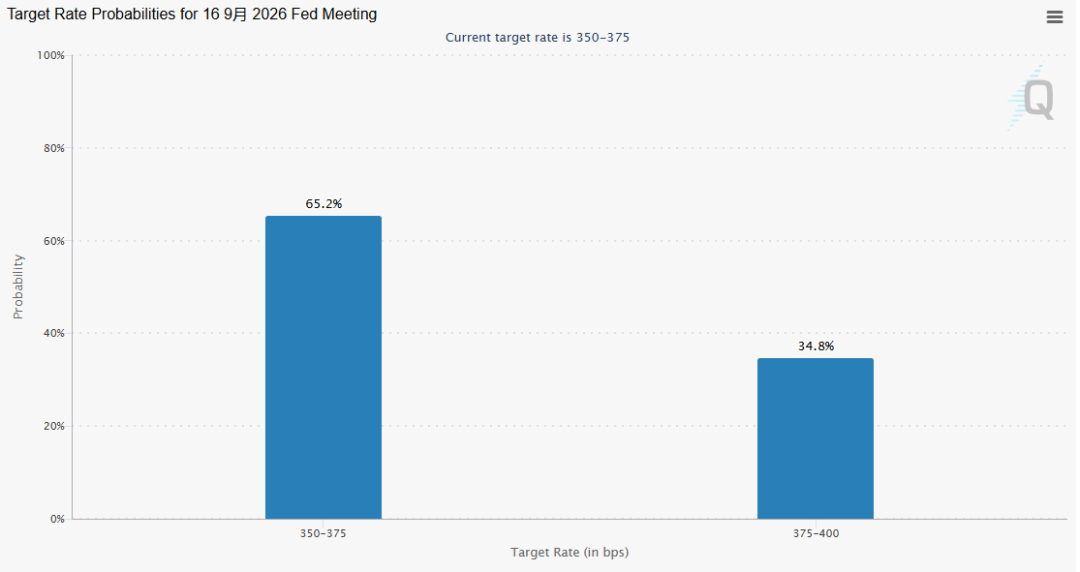
First, let's look at the macroeconomic and capital side: there seem to be many bullish signals, but incremental funds haven't entered the market. This week's inflation data is generally warm, with July CPI year-on-year at 3.4%, down from the previous 3.5%; core CPI year-on-year at 2.5%, PPI year-on-year at 4.7%, down from the previous 5.5%, all meeting or even falling below market expectations. As a result, the probability of a Fed rate hike in September has dropped from around 50% to 35%, and the 10-year US Treasury yield has fallen back to around 4.66%.
There are also highlights on the capital side, with the spot BTC ETF seeing a net inflow of $854 million in the first week of August, marking the best single-week inflow since mid-April, with BlackRock IBIT still being the main buyer. However, prices did not respond positively, instead dropping from 64500 to around 63400. The core issue is the mismatch between supply and demand: whales and ETFs continue to accumulate, while on the other side miners and institutions are selling off, retail investors are exiting, and market liquidity continues to contract, leading to mutual hedging between long and short positions, ultimately resulting in no new buying pressure to drive a market breakthrough.
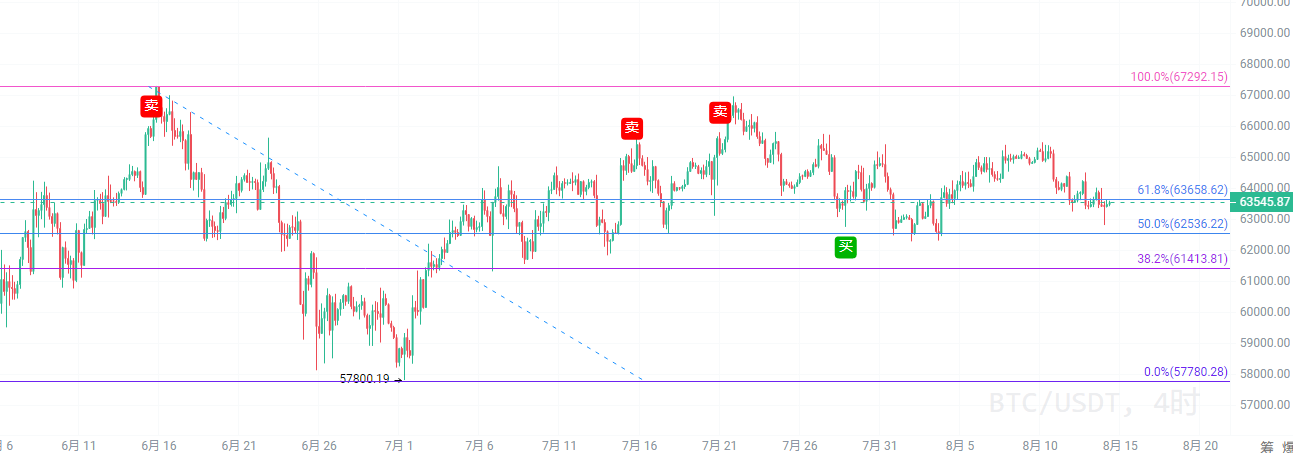
Returning to the market, on the 4-hour level, during BTC's rebound from 63238 to 64500, the trading volume did not increase in sync, and when hitting 64500, the volume was only 1213, indicating a lack of strength in the rebound. The daily chart is more intuitive, with each rebound peak's trading volume consistently declining, showing a typical volume-price divergence. Currently, the 24-hour trading volume is only $299 million, indicating a very quiet market.
We confirm the volume exhaustion using three tiers of standards: first, the volume during the 4-hour rise and fall has shrunk more than 30% from this round's peak, meeting criteria; second, the total same-direction volume over the last three days on the daily chart is less than half of the peak day's volume, meeting criteria; third, the last three 4-hour K-lines show a continuous shrinkage in same-direction volume, approaching minimal volume. All three signals confirm that volume exhaustion is essentially confirmed.
The current Fibonacci range is anchored from 57800 to 67500. The short-term strong resistance above is at 64500, which has been tested multiple times with pressure; the lower 0.618 position is 63658, which has now been broken, turning from support to resistance; the 0.5 position at 62536 is the first downward target, and the 0.382 position at 61400 is the ultimate target. The current price is 63450, involved in a small range of repeated back-and-forth, waiting for directional choice.
In summary, for short-term operational thinking: making a long position here is not suitable as all core forward-looking and decision-making core conditions are not met: the volume has not increased, the volume-price divergence has not been corrected, and support below has not been confirmed. As for making a short position, three layers of volume exhaustion + reduced volume rebound, daily volume-price divergence, repeated pressure at 64500, core signal resonance, indicating an overall bearish stance.
Public account: Big Bull Says Market
免责声明:本文章仅代表作者个人观点,不代表本平台的立场和观点。本文章仅供信息分享,不构成对任何人的任何投资建议。用户与作者之间的任何争议,与本平台无关。如网页中刊载的文章或图片涉及侵权,请提供相关的权利证明和身份证明发送邮件到support@aicoin.com,本平台相关工作人员将会进行核查。