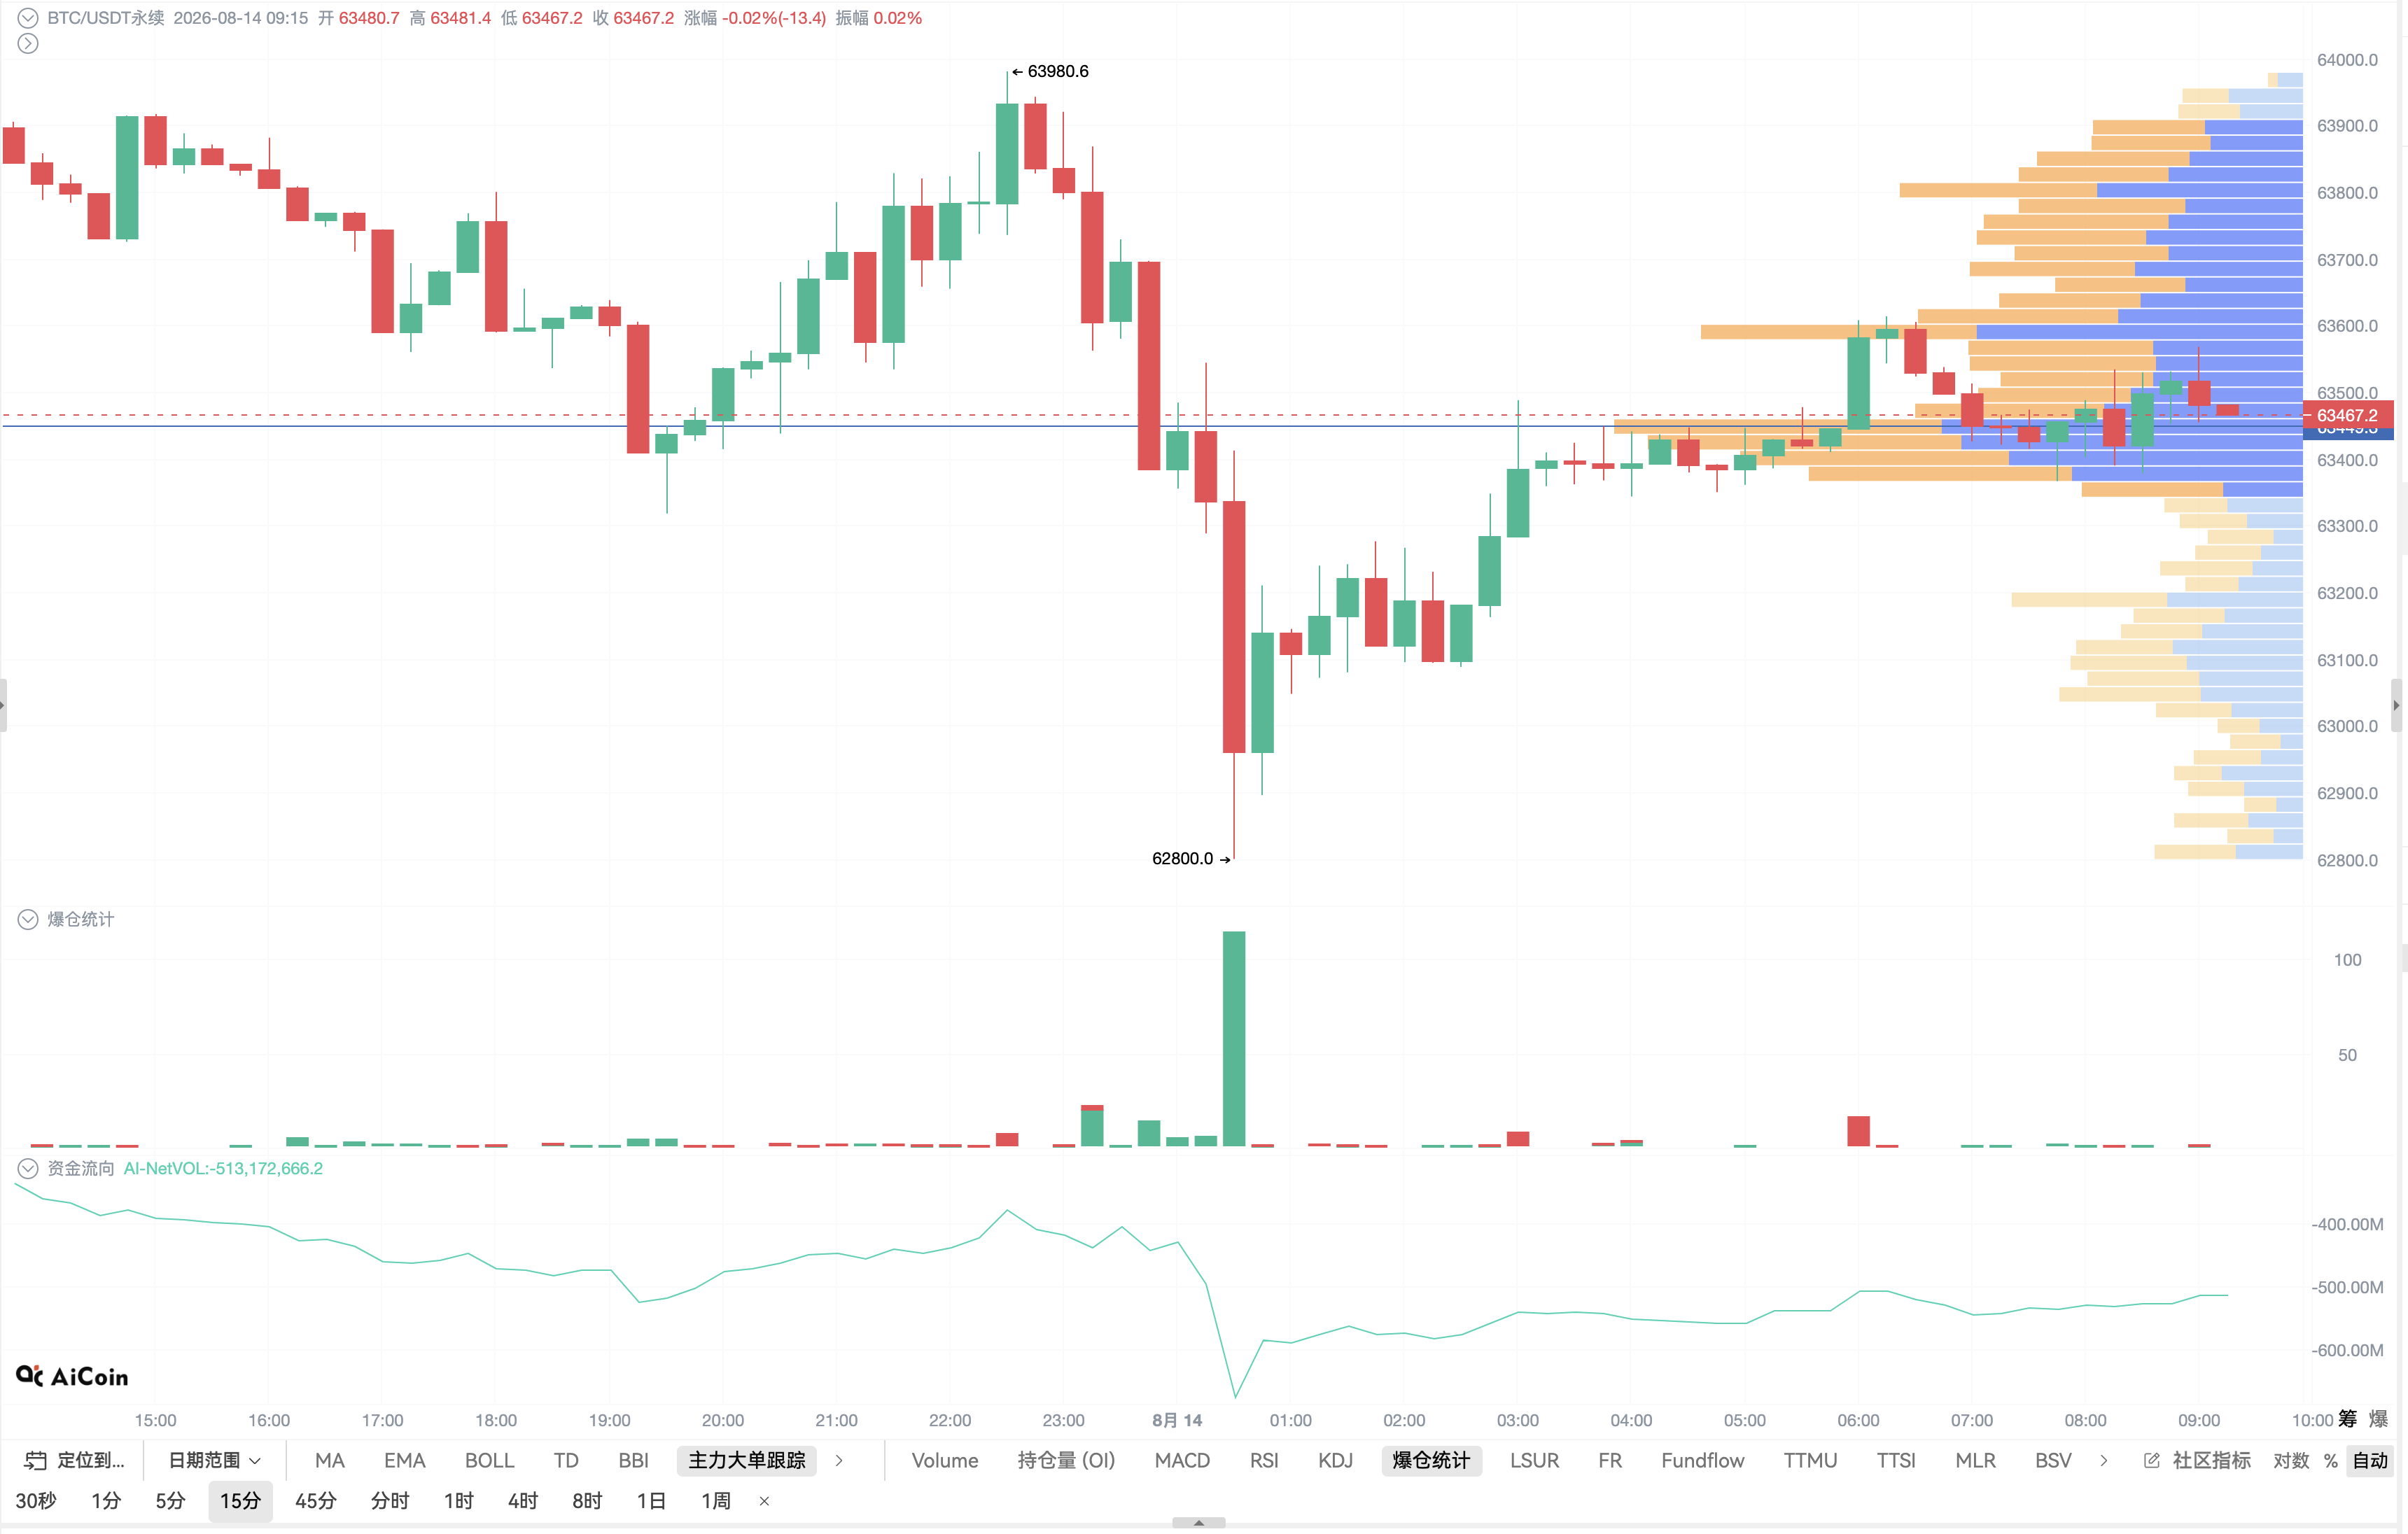
In today's morning session, the market was torn apart by two heavyweight pieces of news. On one side, the 30-year U.S. Treasury rate reached a 24-year high, nearing the historical warning line at 5.216%, putting pressure on global risk assets and BTC facing selling pressure. On the other side, however, whales increased their holdings of 330 BTC after three stop-losses, with some even betting a bullish position of 12.75 million dollars with 40 times leverage. This extreme divergence often signals that a significant market movement is about to happen. As traders, we do not need to take sides, but only need to follow the signals from the Qinglan TPV system and prepare for the response plan.
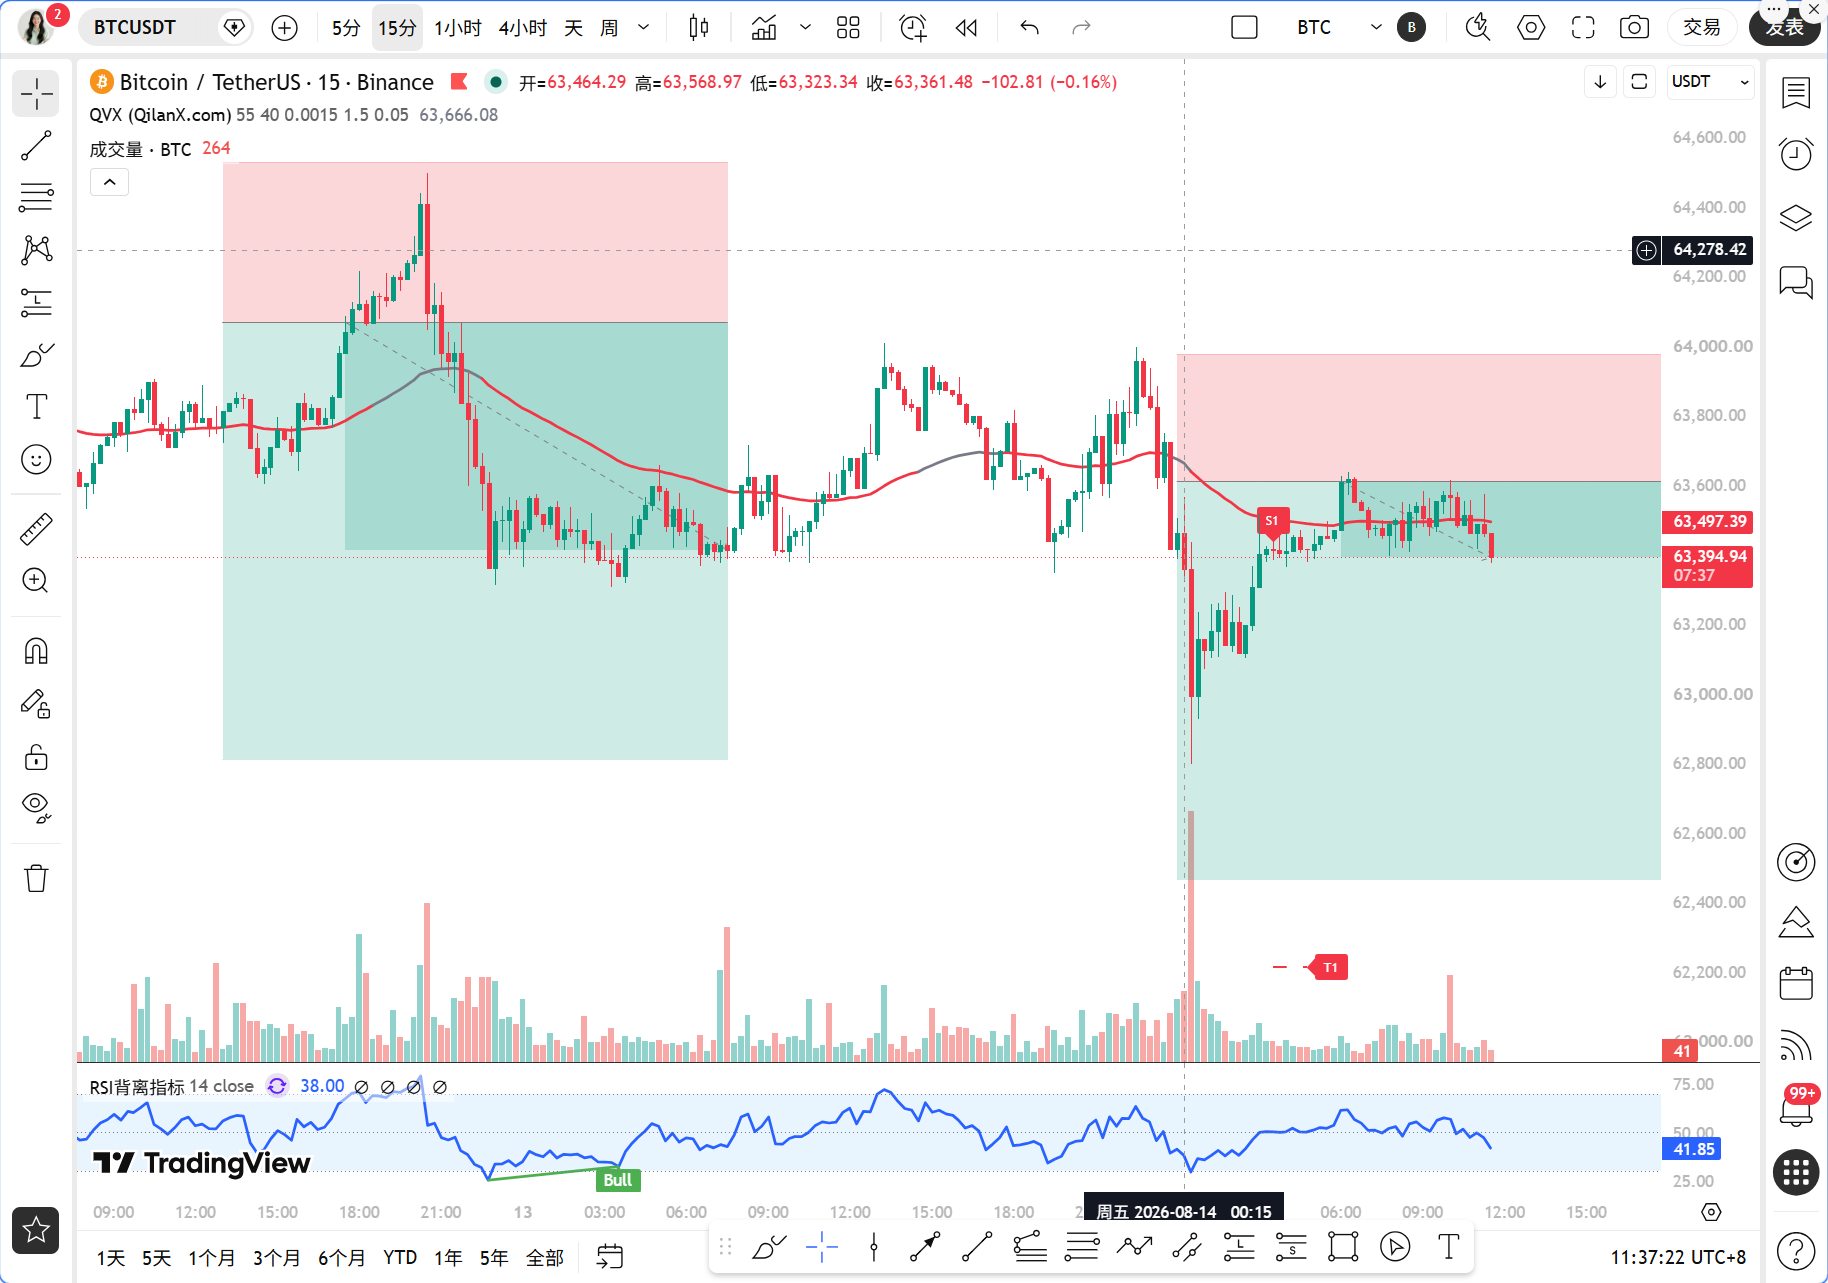
The current time is August 14, 11:37 AM, BTC is quoted at 63,380 USDT, with a 24-hour drop of 0.16%. This position is very delicate, as the price is just below the 1-hour EMA55, yet there has been no panic selling. From the order book, both bulls and bears are waiting for a clear breakout signal. The on-chain market share is 56.23%, indicating that BTC is still the backbone of the market, but short-term momentum has significantly weakened.
First, let's look at the daily chart. MA5 is at 63,584, MA10 is at 64,169, and MA30 is at 64,309, showing a bearish arrangement in the moving average system. The MACD's DIF continues to decline in the negative zone, and the histogram shows -118.12, with bearish momentum still being released. The RSI is at 55.36; although not overbought, it has already retreated from the earlier strong area. The conclusion at the daily level is that the medium-term trend is bearish, but it has not reached an extreme oversold position, and the lower space needs attention to whether the 4-hour level can stop the decline.
Next, let's look at the 4-hour level. MA5 is at 63,436, MA10 is at 63,503, and MA30 is at 64,100, with short-term moving averages starting to flatten, which is a noteworthy signal. The MACD's DIF is at -266.97, DEA at -255.92, and the histogram at -11.05; although still negative, the magnitude is narrowing. The RSI is at 47.02, in a neutral to weak zone. The most critical signal at the 4-hour level is that the MACD histogram is continuously contracting, indicating that the downside momentum is exhausting. If the price can hold around 63,000, it is expected to form a bottom divergence structure.
The 1-hour level is the core trading period at present. EMA55 is at 63,634, and the current price is 63,380, with a distance of 0.40% from EMA55. According to the oscillation determination rules of the Qinglan TPV system, in the past 8 1-hour candles, the closing price above EMA55 occurred 0 times, and the crossing occurred 0 times, indicating that the market is in a clear one-sided bearish trend, not in a consolidation market. The MACD's DIF is at -51.44, DEA at -56.84, with the histogram at 5.40; although the histogram has turned positive, both DIF and DEA are below the zero axis, indicating that this is merely a rebound repair in a bearish trend and does not constitute a reversal signal. The RSI is at 38.95, close to the oversold area.
The 15-minute level serves as an entry reference. MA5 is at 63,463, MA10 at 63,499, and MA30 at 63,494, with moving averages sticking together, suggesting a repeated battle in the range of 63,400 to 63,500. The MACD's DIF is at -2.99, DEA at 11.68, and the histogram at -14.67, with short-term momentum being bearish. The RSI is at 39.87, also in a weak area. The 15-minute level has not given a clear entry signal, requiring the price to choose a direction.
Now let's complete the signal verification using the Qinglan TPV system. For short-selling conditions, first, the price is under pressure below the 1-hour EMA55, with two consecutive closing prices below EMA55, which fully meets this condition. Second, the price is repeatedly testing around 63,400 but cannot consistently stay above EMA55, indicating a typical weak rebound. Third, the rebound momentum is exhausting; although the MACD histogram has turned positive, both DIF and DEA are deeply below the zero axis, making the rebound strength very weak. All three short-selling conditions are met, signaling a clear bearish signal.
Regarding long positions, first, the price must stay above EMA55, which is completely not satisfied in this case. Second, there has not yet been a long lower shadow line or bottom formation. Third, while there are signs of exhaustion at the 4-hour level, the 1-hour level has not confirmed this yet. Therefore, none of the long conditions are met, and there is currently no qualification to go long.
On-chain data shows that the fear and greed index is unknown, but based on market performance, the sentiment should hover around 50. BTC's 24-hour change is -0.16%, with volatility narrowing. Notably, a whale that has held for three years sold 158 BTC at a cost of 20,000 dollars, with floating profits shrinking by 40%, indicating that some long-term holders are starting to waver. On the other hand, a whale increased their position of 330 BTC after three stop-losses, with a long position returning to 110 million dollars and a 12.75 million dollar position leveraged at 40 times. The standoff between these long and short whales often leads to drastic market fluctuations, requiring special vigilance.
In terms of key attack and defense levels, the first resistance level above is at 63,634, which is the position of the 1-hour EMA55 and marks the watershed between bulls and bears. The second resistance level is at 64,100, corresponding to the 4-hour MA30. The first support level below is at the psychological level of 63,000. The second support level is at 62,500, which corresponds to the previous low area. If 63,000 is effectively broken, the next target directly looks at 62,000.
In terms of trading ideas, the direction is clear, primarily bearish. The entry condition is to wait for the price to rebound to the range of 63,550 to 63,650, near EMA55, while observing whether the 15-minute level shows a long upper shadow line or top formation. Set the stop-loss at 63,850, which is 200 points above EMA55, allowing enough room for fluctuations. The first target is at 63,000; if it breaks, you can continue to hold. The second target is at 62,500, which is the support area at the 4-hour level. Position control should be kept within 20% because there are currently whales in long positions with 40 times leverage, which may trigger sharp price movements at any time, and being too heavily weighted could easily lead to stop-losses.
Risk warnings include the whale's 40 times leverage long position and the uncertainty of Federal Reserve policies, which are the two biggest risk points currently. Any force from either side could lead to the price quickly deviating from the technical positions.
Follow Qinglan's crypto classroom to grasp more trading opportunities! Welcome to visit the official website www.qinglan.org
📊 Qinglan TPV trading strategy backtesting reference
🕒 Last backtest time 08-14 07:00:01
Total analysis: 3525 Backtest: 3509 Accuracy rate: 80.6% (2830/3509)
免责声明:本文章仅代表作者个人观点,不代表本平台的立场和观点。本文章仅供信息分享,不构成对任何人的任何投资建议。用户与作者之间的任何争议,与本平台无关。如网页中刊载的文章或图片涉及侵权,请提供相关的权利证明和身份证明发送邮件到support@aicoin.com,本平台相关工作人员将会进行核查。