Written by: Xiaobing
According to the Cryptocurrency Industry Report for Q2 2026 published by CoinGecko, the data is grim: the total market capitalization of the crypto market fell by 12.6% in Q2, shrinking from $2.4 trillion to $2.1 trillion, reaching the lowest level since September 2024, and down about 52% from the peak in October 2025. This marks the third consecutive quarter of decline.
This 58-page report highlights that what matters is not a single number, but that several trend lines are pointing in the same direction: capital is leaving the crypto market, and the exit is very orderly.
Triple Evidence of Capital Outflow
The first piece of evidence comes from stablecoins.
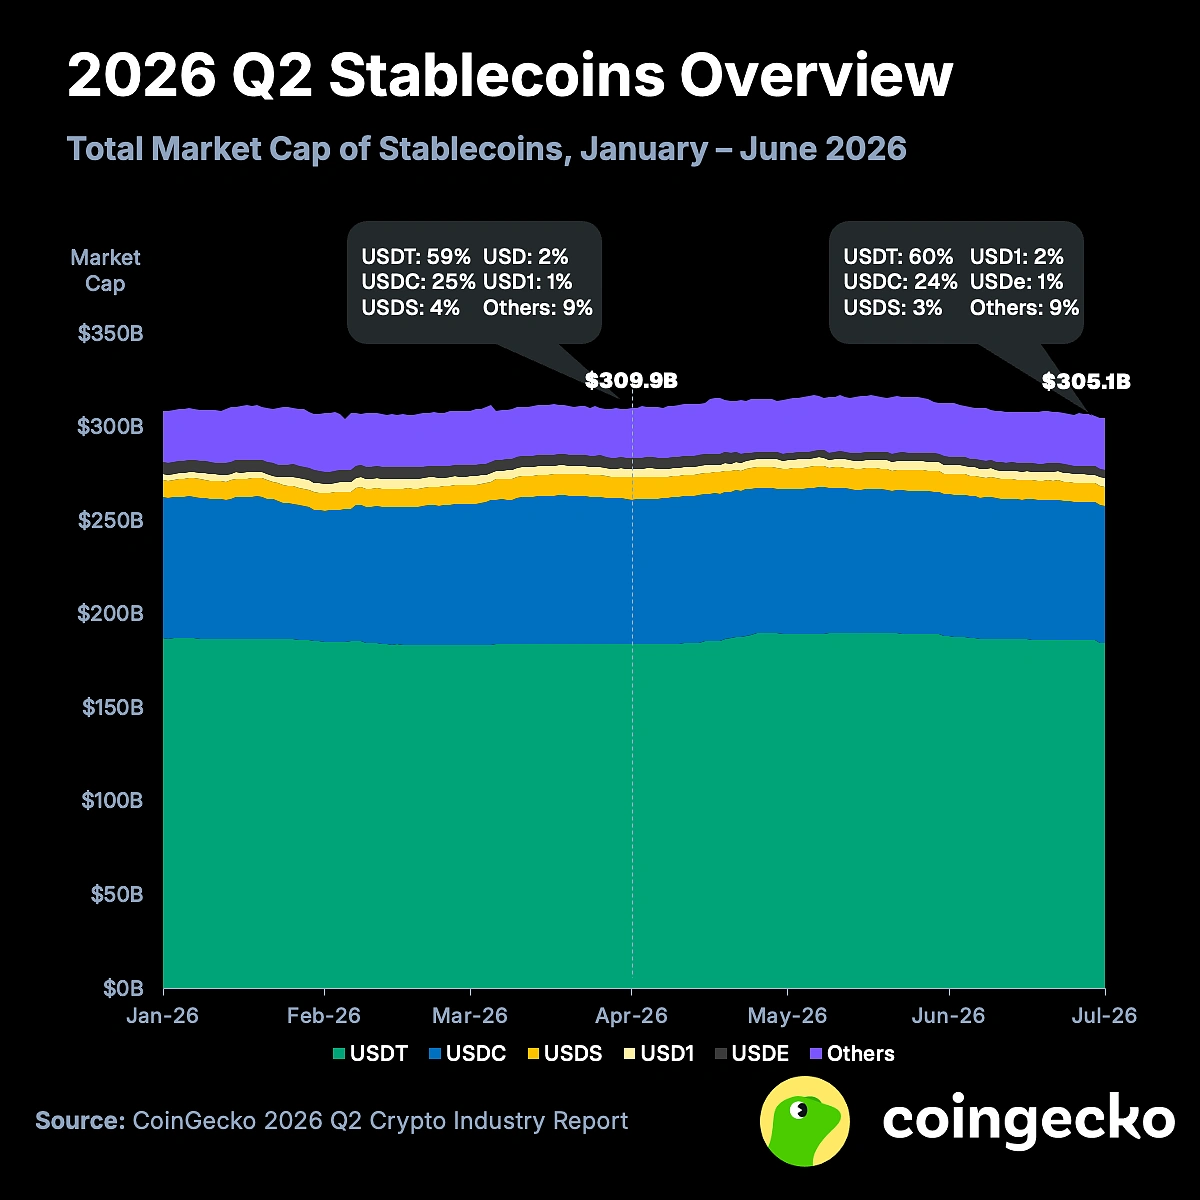
The total market capitalization of stablecoins in Q2 fell by 1.6% to $305.1 billion, marking the first quarter of negative growth since Q3 2023. Stablecoins are the "cash layer" of the crypto ecosystem, and their shrinkage indicates that funds are not merely retreating from risk assets to seek refuge within the market; they are directly withdrawing from the industry.
Structural differentiation is also intensifying. Tether's USDT increased slightly by 0.2%, with market share rising to 60%, while Circle's USDC experienced an outflow of $3.7 billion (-4.8%), Sky's USDS shrank by $2 billion (-16.4%), and Ethena's USDe declined by $1.4 billion (-24.4%). This pattern indicates two things: offshore dollar demand remains solid, but on-chain native yield-generating stablecoins are experiencing a wave of redemptions, primarily because DeFi yields have fallen below risk-free rates.
The second piece of evidence comes from trading volume.
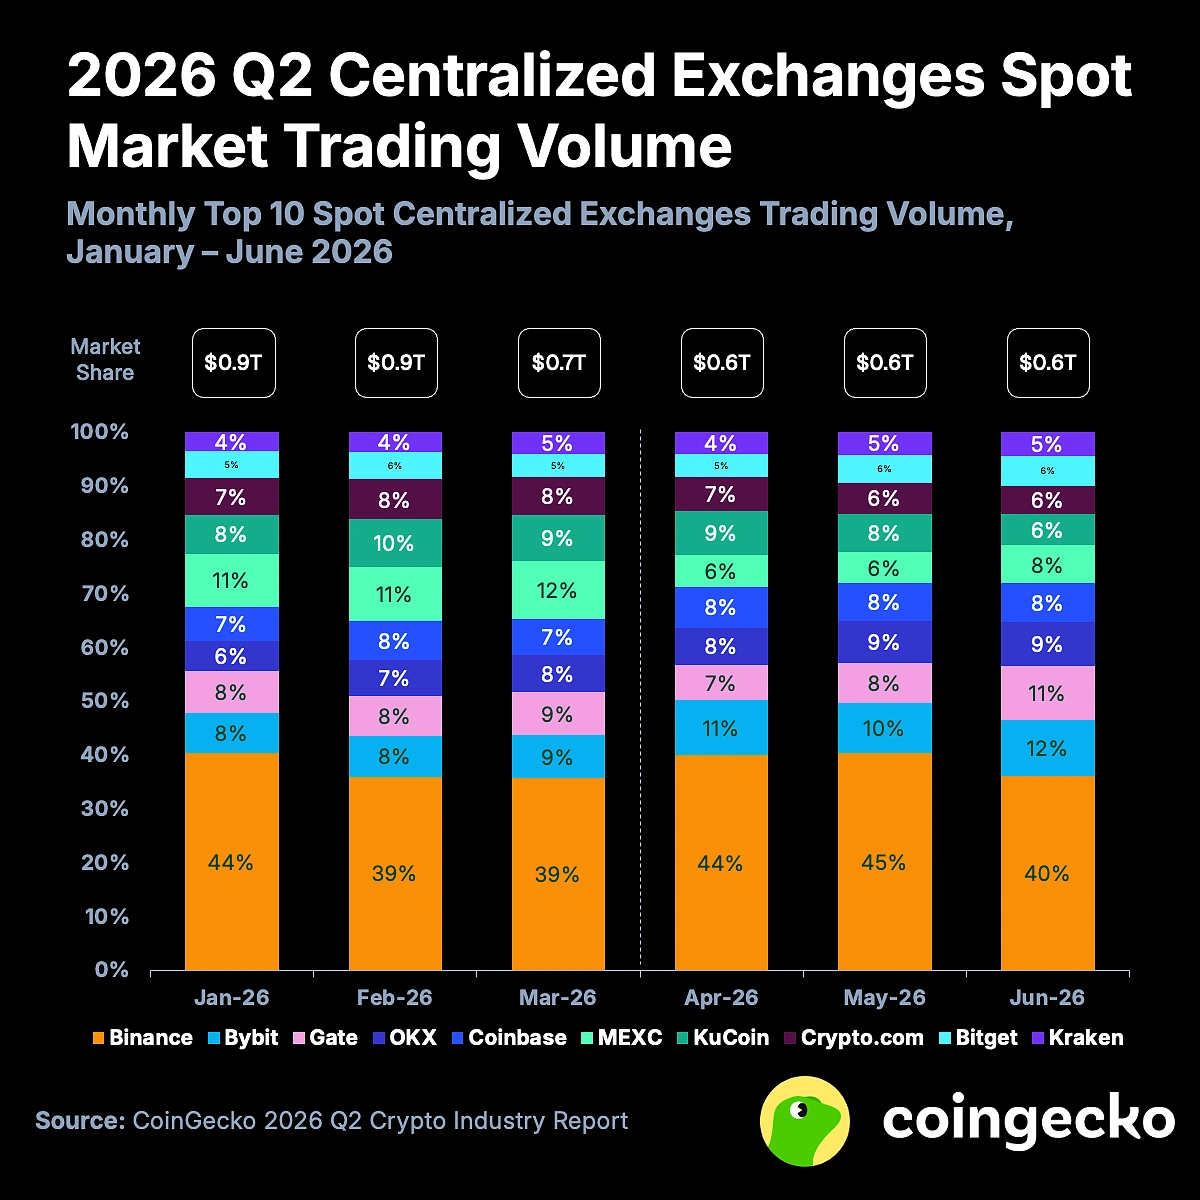
In Q2, the spot trading volume on centralized exchanges fell by 27.9% to $1.95 trillion, with May alone recording only $619 billion, the lowest point of the year. The decline in perpetual contract trading volume was relatively moderate (-10% to $12.7 trillion), which is not good news; this indicates that speculative demand is weakening slower than investment demand, and the market structure is becoming more fragile.
The third piece of evidence comes from DeFi.
In Q2, the total value locked (TVL) in DeFi plummeted by 23.4%. Ethereum was most affected by the KelpDAO attack, with its TVL shrinking by 28.7% (-$15 billion), and its market share dropping to 52.9%. The decline in locked value, combined with an average decrease in on-chain transaction fees of 44.6%, indicates that on-chain economic activity is overall shrinking.
BTC and ETH Both Lag Behind
If we only look at the total market capitalization, a 12.6% decline is only moderate amidst the volatility of the crypto market. What is truly disconcerting is the divergence of crypto assets from traditional risk assets.
In Q2, the US stock market experienced a strong rebound, while Bitcoin (-14.2%) and Ethereum (-25.4%) completely failed to keep up.
This is an important structural signal: the narrative of "Bitcoin as digital gold/risk asset/technology stock alternative" that has prevailed over the past two years has simultaneously failed this quarter. It did not follow gold's rise, did not follow the Nasdaq's rise, and did not serve as a safe haven during rising risk sentiment.
Ethereum's situation is even worse.
Q2 marked the first time in history that ETH has recorded three consecutive quarters of decline. While Bitcoin's market share has remained above 55%, Ethereum's share has dropped to around 10%, far below the historical average of 18%.
June was the most brutal month of the entire quarter. The combination of the Federal Reserve's hawkish stance, the fluctuating US-Iran situation, and Strategy's symbolic sale of Bitcoin together triggered the most severe single-month drop of the year. Strategy's sale involved only 32 BTC (worth about $2.5 million, accounting for 0.0038% of its holdings), but it shattered Saylor's narrative of "never selling," leading to nearly $4 billion flowing out of US-listed Bitcoin ETFs over the following 12 trading days.
A Few Bright Spots
In a generally shrinking market, a few corners are still experiencing growth, but the direction of the growth is noteworthy.
The prediction market saw its nominal trading volume increase by 48.7% in Q2 to $11.38 billion, with June alone reaching a historic high of $5.28 billion.
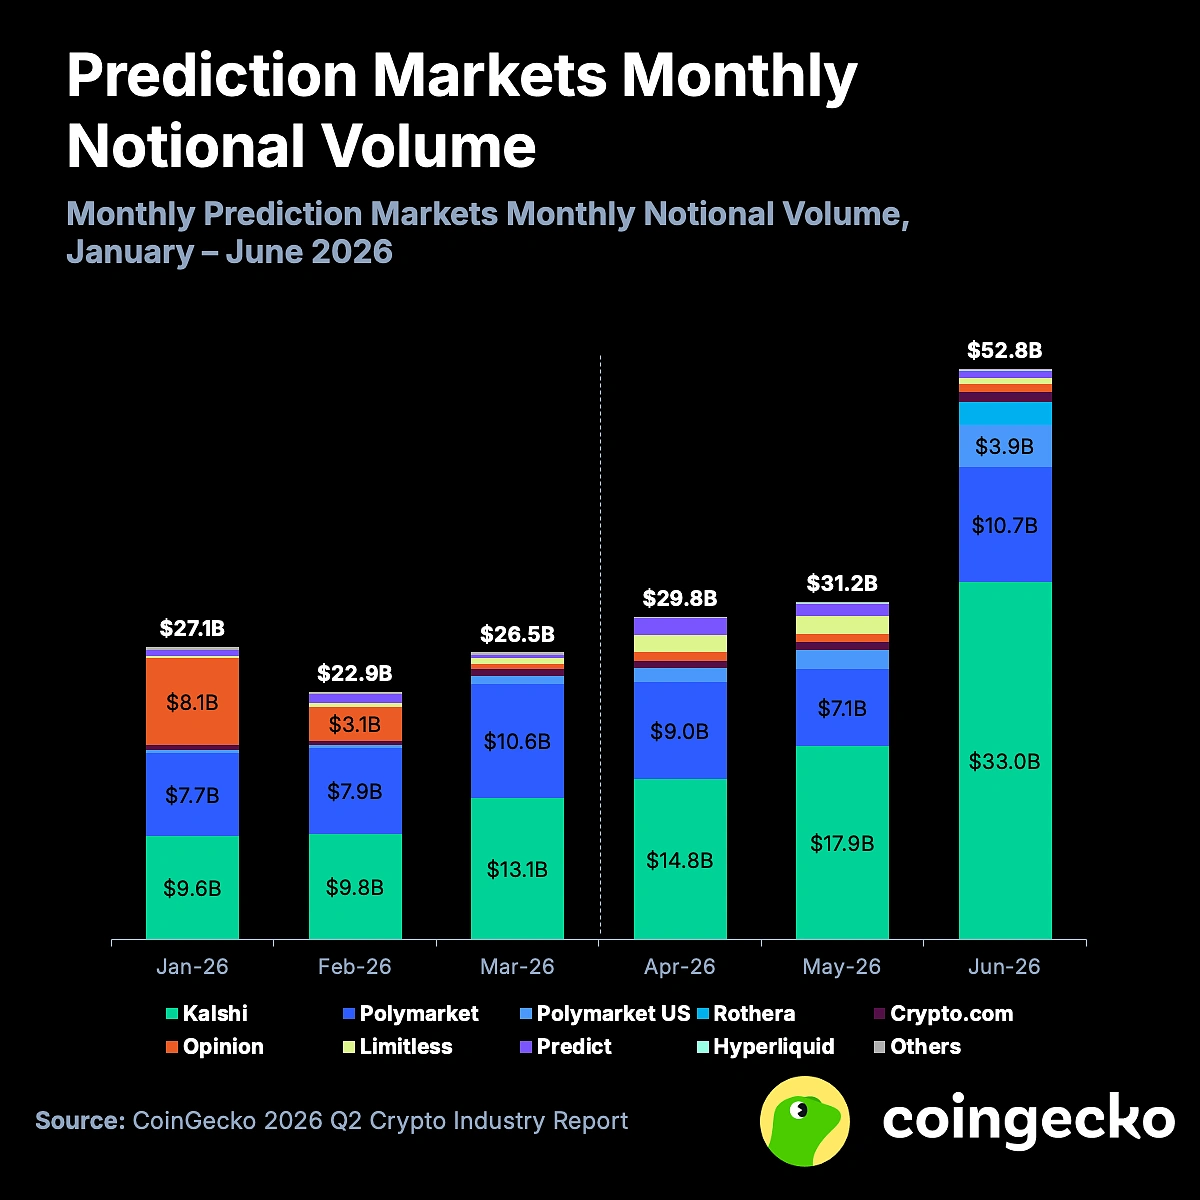
Kalshi's market share expanded from 42.4% to 58.9%, while Polymarket's fell from 35.8% to 30.2%. Robinhood's joint venture project Rothera launched in May and entered the fourth place in June with a trading volume of $2.1 billion. The main driver of this growth is sports events, which accounted for 81% of the total contracts on Polymarket by June.
Hyperliquid's HYPE, with its newly launched ETF, prediction market functions, and protocol launched on Coinbase, entered the top ten by market cap, standing out as the most notable exception among altcoins in Q2.
The tokenized collectibles market has seen new players emerge. Collector Crypt took the first place with a 317% monthly trading volume growth (from $97 million in January to $406 million in June), capturing 62.8% market share in June. However, the report also pointed out that over 98% of the trading volume on these platforms comes from gacha-type card drawing mechanisms, not true liquidity in the secondary market.
What the July Rebound Changed
CoinGecko's report covers up to the end of June, and the market in July has already given some responses.
Bitcoin rebounded about 9.8% in July, rising from dipping below $58,000 at the beginning of the month to around $65,000, with the July high reaching $67,000. However, this rebound is not encouraging in historical context: out of the past 12 years, 9 Augusts recorded declines, with a median return rate of -7.49%. The script from 2018 is often cited as the most comparable template; that year, July also rebounded 21.3% after a significant decline, only to drop 9.4% in August, another 6% in September, and then crash in November.
The current price of Bitcoin is about $64,000, down approximately 49% from the historic high of $126,000 in October 2025, needing to double to return to that peak. Whale addresses have net added about 270,000 BTC over the past month, but the accumulation speed of long-term holders has slowed down by 47%. ETF funds have not yet flowed back on a large scale.
Overall, the crypto market is experiencing a well-ordered capital withdrawal, without a panic-induced collapse, only a gradual retreat. Where the tide will recede to depends on two things: when the Federal Reserve eases, and whether the industry can find real sources of revenue beyond speculation before the next cycle arrives.
免责声明:本文章仅代表作者个人观点,不代表本平台的立场和观点。本文章仅供信息分享,不构成对任何人的任何投资建议。用户与作者之间的任何争议,与本平台无关。如网页中刊载的文章或图片涉及侵权,请提供相关的权利证明和身份证明发送邮件到support@aicoin.com,本平台相关工作人员将会进行核查。