撰文:Patrick Bush
原文:《VanEck Mid-July 2026 Bitcoin ChainCheck》
Please note that VanEck has exposure to bitcoin.
Key Takeaways
- Price consolidation, not recovery: BTC closed ~$63,700, flat month-over-month but 33% off its six-month high and 14% below its 200-day moving average.
- Derivatives suggest caution, not capitulation. Put/call IV skew (+11.4pp) and perp funding (+4.5%) in ranges historically preceding below-average returns.
- Miner economics are near multi-year lows. Hash price at ~$30.6/PH/s/day compressed daily revenue to $28.5M, putting lower-efficiency rigs at or below breakeven.
- AI deals improving even as equities de-rate. WULF’s Anthropic lease and CLSK’s $6.6B deal are top unlevered yields, but rate pressure, regulatory risk, and AI ROI skepticism have the group ~42% off 52-week highs.
Bitcoin Consolidates in Summer Lull
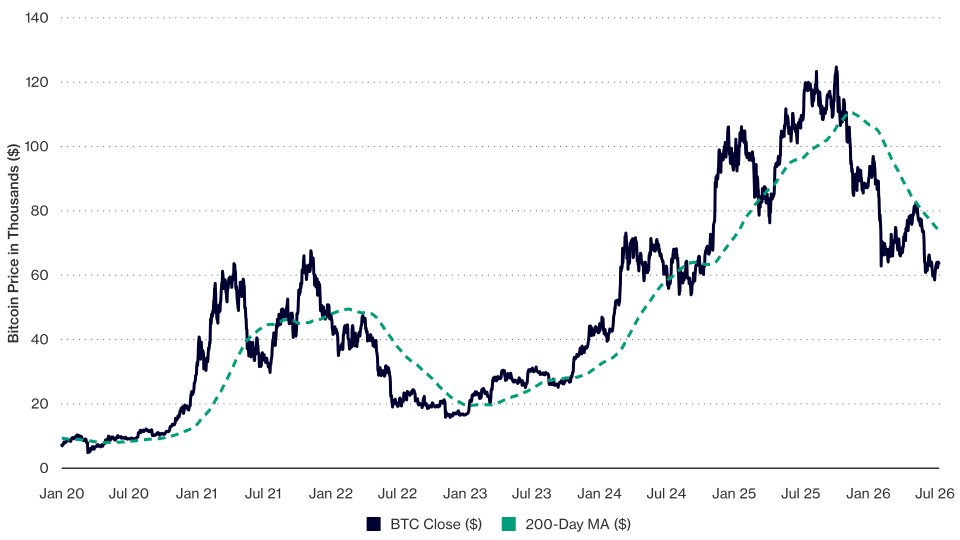
BTC Price and 200-Day Moving Average
Source: Glassnode. As of 7/14/2026. Past performance is not a guarantee of future results. Not intended as a recommendation to buy or sell any securities named herein.
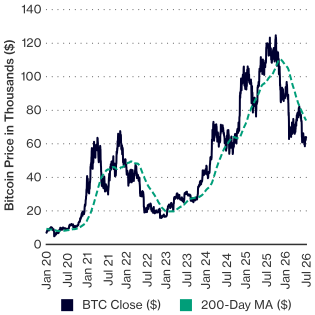
Bitcoin (BTC) spent the past 30 days consolidating after its disheartening spring slide. Bitcoin closed July 12 at $63,742 which is about flat versus a month ago (+0.3%) even as the 30-day moving average (MA) fell to ~$62,694 (-12.1% m/m) on the roll-off of higher May prints. Price oscillated in a tight $58,544–$66,291 band (low June 30, high June 15) while 30-day realized volatility fell to 30.4% annualized which is below the trailing-year 43% level and well under the ~81% long-run average. The BTC price pause caps two straight monthly declines (May -3.6%, June -20.5%) and a -33% six-month drawdown but ends the period ~14% below its 200d MA (~$74k).
BTC held its price range on thin participation as spot volume sagged into the summer. Spot volume averaged ~$5.1bn/day over the last 30 days, down roughly 29% from the ~$7.2bn daily average since 2019. However, this softness is a typical summer pattern with June–August volumes running below the rest of the year each of the last 6 years: −23% (2020), −26% (2021), −39% (2023), −29% (2024), −19% (2025). If we parse spot volume a bit further to disaggregate “taker order” active buys versus active sells, we find that active orders are skewed towards sellers (as is the norm), but the differential is declining. The buy−sell volume delta ran net-negative at ~−$70mm/day over the previous 30 days and −$59mm/day over the last week, against a −$21mm/day average since 2019.
Derivatives Signal Caution Rather Than Capitulation
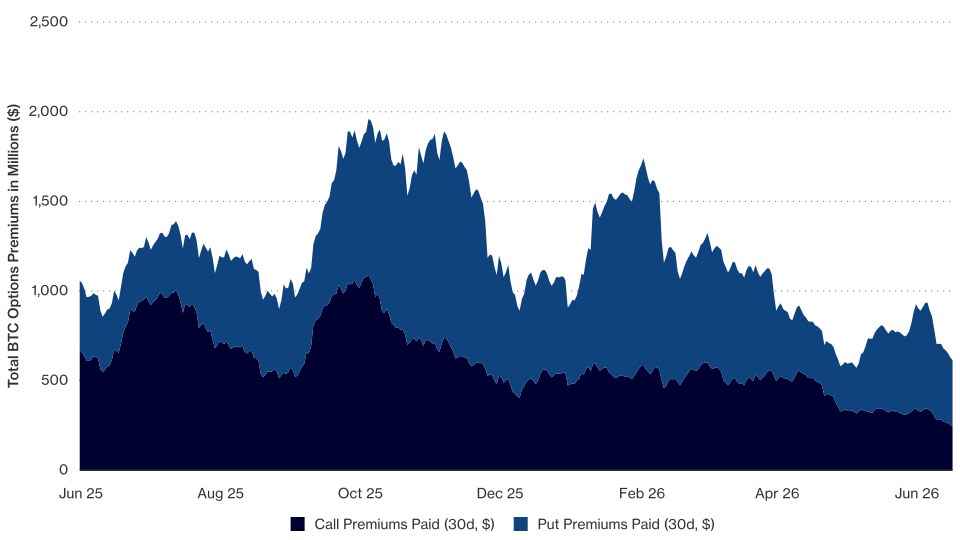
BTC Options Premium Paid (30d): Total $613.6M, -23% M/M (Calls + Puts, Stacked)
Source: Glassnode. As of 7/13/2026. Past performance is not a guarantee of future results. Not intended as a recommendation to buy or sell any securities named herein.
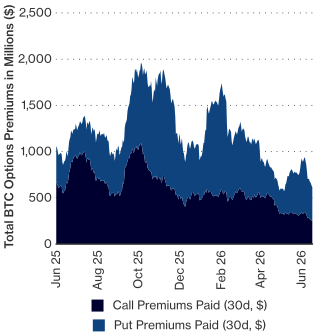
The options complex stayed firmly defensive over the last 30 days as options buying declined. Total premium paid eased 23% m/m to $613.6M (57th percentile since 2021). Put premiums paid fell 20% m/m to $367.7M but held the 74th percentile, while call premiums dropped 27% to $245.9M (40th percentile), lifting the Put/Call premium ratio to 1.49 (90th percentile) from 1.36. This reads against an average since 2021 of 0.71 (buying skewed towards calls).
Open interest came in modestly but stayed higher measured over the longer term. Total OI was down 13% m/m to $29.9B (80th percentile), with call OI at $17.9B (78th) and put OI at $12.0B (82nd) with both lower m/m. This drops the Put/Call OI ratio to 0.67 from 0.73 (71st percentile).
Implied volatility (IV) remains historically cheap with most options buying concentrated on scooping up puts. 1-month Call IV eased 1pp to 35.5% (3rd percentile in since 2021) and remains pinned near record lows, while 1-month Put IV held roughly flat at 46.9% (18th percentile). The result is a steepening volatility differential (skew) between puts and calls. The 1-month put/call skew widened to +11.4pp from +9.8pp a month earlier (83rd percentile), versus just +1.7pp a year ago.
Stepping back, selling 1-month call volatility pays less than at almost any point since 2021 while the relative price of put volatility continues to climb even as absolute volatility stays cheap. This is a fascinating dynamic which tells us that traders are still worried about BTC price downside and are possibly even willing to fund put purchases, which act as downside price protection, with the proceeds of selling calls. This skew toward expensively priced put volatility indicates elevated fear amongst options players.
Forward returns tend to beat historical average returns when put/call IV skew levels are below +5pp. However, it appears that positive put/call options volatility skew portends negative future price action until absolute capitulation occurs. On the balance, forward returns tend to be lower in the +5 to +15pp band (~60th -90th percentile) which is where today's +11.4pp / ~83rd percentile reading sits. Only at extreme put skew > +15pp (90th percentile), do returns rebound above average.
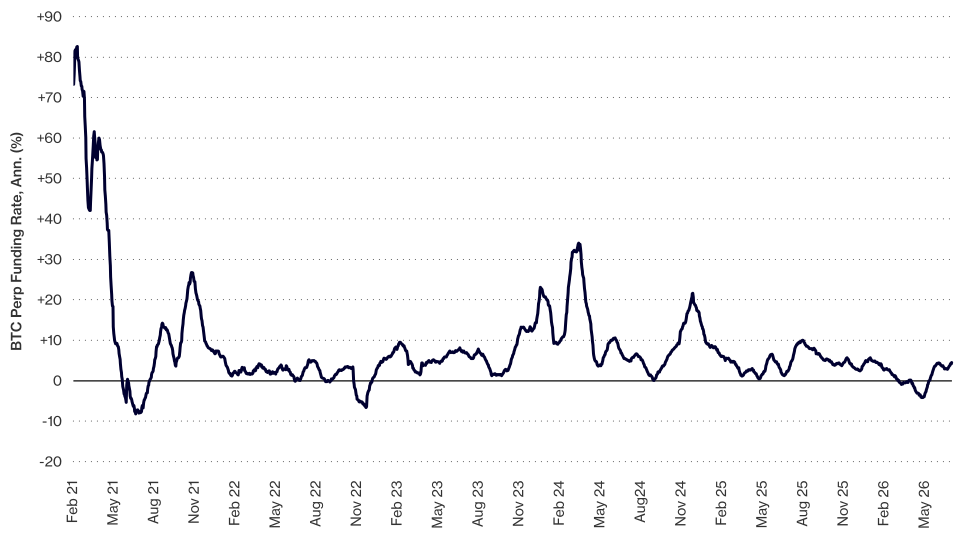
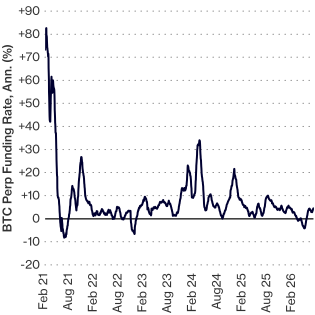
BTC Perpetual Funding Rate: 1-Month Rolling, Annualized (now ~+4.5%)
Source: Glassnode. As of 7/14/2026. Past performance is not a guarantee of future results. Not intended as a recommendation to buy or sell any securities named herein.
BTC perpetual-futures (perps) leverage has de-risked sharply over the past year. Average perpetual open interest fell -10.6% month-on-month to ~$29.4B (from ~$32.9B), extending a slide from ~$35.7B two months ago, though it is still above its ~$21.4B all-time average.
However, the average perpetual funding rate is roughly unchanged at +4.2% (1-month average rate, annualized) versus the prior month but up sharply from -3.4% two months ago. In May, traders were paid to be short Bitcoin through perps positions and now traders must pay a modest premium to be long. This current funding rate is about half the +8.4% long-run average and this suggests that positioning is still far from bullish. The 3-month funding average has likewise turned back up to +1.7% annualized (from negative in spring).
From a the standpoint of liquidations, the perp complex confirms calmer, more deliberate price action. Compared to the previous 30 day period, liquidations have dropped on the long-side ($2.2B -> $1B) while holding the same levels on the short side ($0.8B).
Today's low-positive funding (perp funding ~+6.7% annualized over the past week, ~+4.5% on a 30-day average, versus a +8.4% long-run average) has historically produced positive, but below-average returns. At current +5% to +10% funding level, BTC's median forward return has run about -0.5% (30d), +0.4% (90d) and +10.0% (180d), versus an all-days base of +0.4%, +1.1% and +12.7%, with the medium term (3 to 6mo) the softest window. As a reminder, the best buying opportunities have typically been when funding flips negative: mildly negative funding (-5% to 0%) delivered median forward returns of +2.3% (30d), +5.4% (90d) and +16.9% (180d), well above the base returns. That noted, the most recent episode of negative funding rate buys (April 13 to May 23, 2026; 23 of 41 days with negative funding) are still underwater, down about -20% versus an average entry near $77.9k against ~$62.3k now.
Taken together, the options and futures complex points to below-average forward returns over the near-to-medium term. Put skew at +11.4pp (83rd percentile) sits in the band that has historically preceded softer-than-average price action, and low-positive funding of +4.5% to +6.7% annualized corroborates this, with both signals pointing to their weakest readings over the 30-to-180-day window. Neither complex has reached the extreme that has historically marked a bottom: put skew has not pushed past +15pp, and funding has not flipped negative. Until one of those capitulation signals arrives, the setup favors continued near-term downside pressure over an immediate rebound.
BTC 1-Month Put-Call IV Skew vs Forward Return by Skew Band
| Skew band (pp) | Approx Percentile | Days | 30-day (%) | 90-day (%) | 180-day (%) | 365-day (%) |
| Base (all days) | — | 1910 | +0.4 | +1.1 | +12.7 | +27.5 |
| -15 (extreme call skew) | 0 | 2 | +28.6 | +48.2 | +27.7 | +56.4 |
| -15 to -10 | 0-2 | 29 | +10.5 | +0.5 | -5.2 | +12.4 |
| -10 to -5 | 2-9 | 156 | +7.4 | +9.8 | +24.3 | +77.1 |
| -5 to 0 | 9-36 | 534 | -1.0 | +5.9 | +15.7 | +49.8 |
| 0 to +5 | 36-61 | 506 | +2.8 | +5.4 | +14.3 | +63.3 |
| +5 to +10 | 61-80 | 363 | -4.0 | -18.3 | -23.8 | -25.1 |
| +10 to +15 - current (+11.4) | 80-91 | 234 | +1.4 | -8.8 | +15.3 | -19.1 |
| > +15 (extreme put skew) | 91-100 | 176 | +1.3 | +5.4 | +37.6 | +32.5 |
Source: Glassnode. As of 7/13/2026. Past performance is not a guarantee of future results. Not intended as a recommendation to buy or sell any securities named herein.
ETP Outflows Dominate While DAT Confidence Shaken
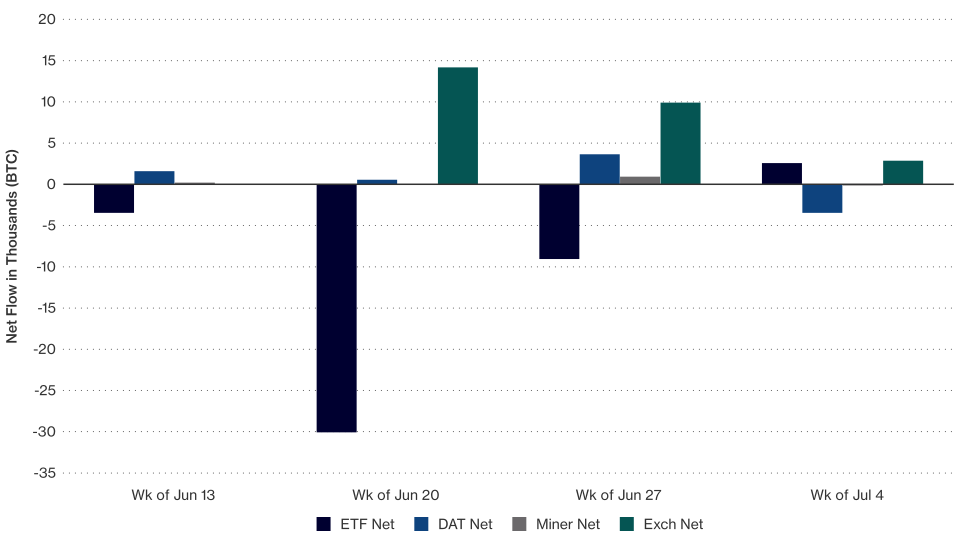
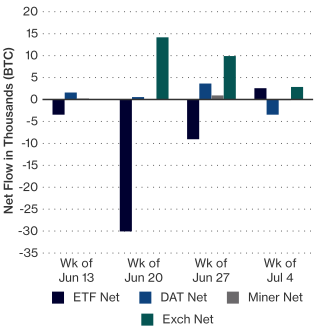
Weekly Net Flows by Cohort (BTC): Jun 13 – Jul 12, 2026
Source: Glassnode.As of 7/14/2026. Past performance is not a guarantee of future results. Not intended as a recommendation to buy or sell any securities named herein.
Net demand was negative over the 30 days and holdings declines were mostly by ETP outflows. US spot ETPs shed 40,010 BTC (−$2.40bn) while corporate treasuries added only 2,343 BTC and miners retained 1,204 BTC. Meanwhile, exchanges holdings rose 26,674 BTC (3.280m → 3.306m) to fill the gap.
Most of the holdings decline was concentrated during the week of June 20 with ETPs dumping 30,058 BTC while exchange balances jumped 14,170 BTC. The bleeding of supply amongst ETPs moderated the week of June 27 with a 9,054 as BTC crested its period low price (and multi-year low) of $58.5k on June 30. Early July saw ETP flows turn slightly positive as during the week of July 4, ETPs gained 2,568 BTC.
The big news of the month for DATs, or digital asset treasuries, was the continuing fallout from Strategy's May 26 announcement that it used $1.38B of cash to retire $1.5B face value of its 2029 convertible notes at roughly an 8% discount to par. This was an issue because Strategy needed to source roughly $1.8B of cash per year to cover the dividend and interest obligations across its capital stack. Post the repurchase, the company was left with a USD reserve of just $900M as of May 31, or about 6 months of coverage.
This tiny reserve shook confidence in both the common shares and the preferred stack. STRC, the main preferred vehicle, traded as low as $74 against its $100 par.
Due to market pressure, Strategy made its first BTC sale since 2022 for a token 32 BTC. However, the market was not satisfied with the gesture and Strategy sold 3,588 BTC in late June/early July. With MSTR common under pressure (which also shook confidence in the price of BTC), those BTC sales fed directly into the negative flows across DATs.
Onchain Fundamentals
Holdings By Age Cohort (BTC)
| Cohort | Holdings | % of Circ | 30d ago | 1yr ago | 4yr MA | m/m (%) | y/y (%) | vs 4yr MA (%) |
| 1y–2y | 2,523,813 | 12.6 | 2,565,538 | 2,048,087 | 2,518,456 | (1.6) | +23.2 | +0.2 |
| 2y–3y | 1,109,125 | 5.5 | 1,135,756 | 1,420,350 | 1,781,800 | (2.3) | (21.9) | (37.8) |
| 3y–5y | 1,949,852 | 9.7 | 1,951,419 | 2,843,375 | 2,531,018 | (0.1) | (31.4) | (23.0) |
| 5y–7y | 1,434,565 | 7.2 | 1,454,203 | 1,060,197 | 1,463,445 | (1.4) | +35.3 | (2.0) |
| 7y–10y | 1,660,558 | 8.3 | 1,675,102 | 1,600,101 | 1,288,678 | (0.9) | +3.8 | +28.9 |
| >10y | 3,525,658 | 17.6 | 3,523,289 | 3,326,907 | 3,119,818 | +0.1 | +6.0 | +13.0 |
| >1y total | 12,203,573 | 60.8 | 12,305,307 | 12,299,017 | 12,703,215 | (0.8) | (0.8) | (3.9) |
| 6m–12m | 3,545,812 | 17.7 | 3,624,122 | 3,161,375 | 2,165,284 | (2.2) | +12.2 | +63.8 |
Source: Glassnode. As of 7/14/2026. Past performance is not a guarantee of future results. Not intended as a recommendation to buy or sell any securities named herein.
Over the past 30 days, transfer activity picked up among coins that have been held for 3-10 years while dropping for 1-2-year and 10-year cohorts. As a reminder, when tokens are transferred, they are referred to as “spent” and we consider that as a proxy for Bitcoin sales. Relative turnover, which measures the share of an age group's total coin holdings that are transferred (expressed as a percentage of holdings), rose 74% m/m for the 3-5-year group, 111% for the 7-10-year group, and 23% for the 5-7-year group. When measured in total tokens moved rather than relative turnover, about 1.98M BTC tokens aged >1yr moved over the past 30 days. This figure is roughly +32% y/y and +6% m/m but most of that volume came from the middle-aged owners selling into the early-July price bounce.
Amongst the oldest and youngest cohorts within long-term token age band (>1 yr), token transfers were lower. For coins older than ten years, turnover fell 63% m/m to just 0.5% of total >10-year token figures, the lowest spending rate of any age band in the past month. Meanwhile the 1-2-year group’s token turnover was down 10% m/m. Thus, the selling appears to be concentrated in the middle of the age curve whereas the youngest and oldest cohorts appear to be holding their tokens. In earlier cycles that pattern tended to proceed positive or flat (but below average) six-to-twelve-month forward returns.
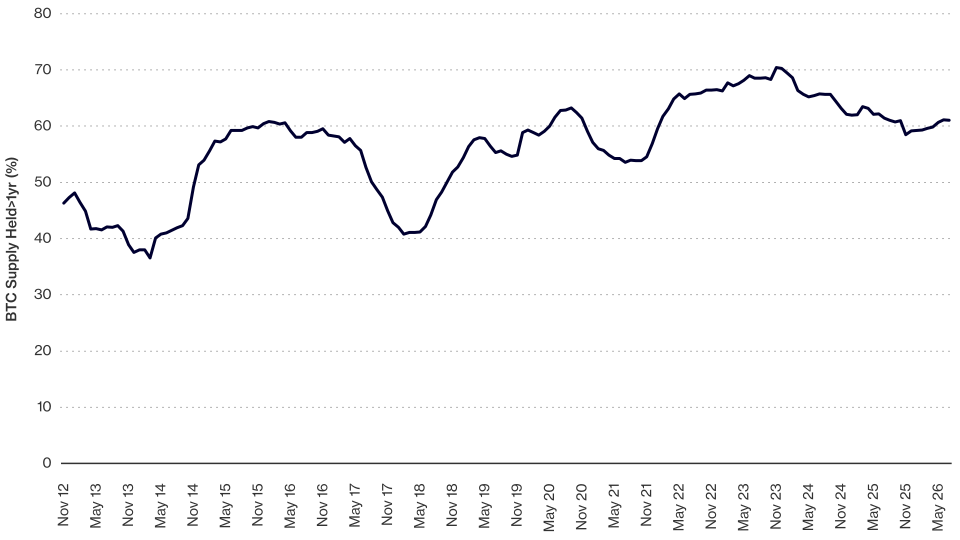
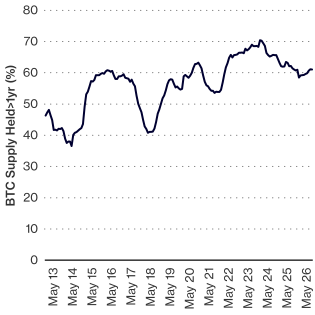
BTC Supply Held Longer Than 1 Year (Share of Circulating), 2012 to 2026
Source: Glassnode. As of 7/14/2026. Past performance is not a guarantee of future results. Not intended as a recommendation to buy or sell any securities named herein.
Stepping back, onchain behavior points to more Bitcoin holders exhibiting firmer hands because the share of tokens held longer than a year has been consistently increasing. Tokens that have not moved in over a year reached 12.20M BTC, or 60.8% of circulating supply, which is the 68th percentile going back to 2012. This figure has also been grinding higher amid the Bitcoin price drop as the share of tokens held longer than a year has grown from 59.1% six months ago to 59.9% three months ago to 60.8% now at an average of about 0.4 points a month.
Additionally, there is good reason to expect it keeps rising. Sitting just behind the one-year line is another 3.55M BTC, roughly 17.7% of supply, in the 6-to-12-month band. This age cohort’s size is in the 95th percentile since 2020. If those coins pass the twelve-month mark without being spent, they graduate into the long-term bucket and lift the long-term share further. If current spending and aging trends hold, we project that the long-term share gets to about 62% in three months and approaches 63% in six months. As the table below shows, this sort or regime characterized by a high share of supply idle >1yr that is already >60%, tends to show greater than average BTC returns over each time period we tested.
Forward BTC Returns By Long-Term (>1yr) Share Regime (Median)
| Regime | Days (n) | 30d (%) | 60d (%) | 90d (%) | 180d (%) | 1yr (%) | 2yr (%) |
| All days | 4958 | 3.2 | 7.7 | 9.7 | 32.4 | 85.2 | 211.6 |
| Share > 60% & rising, 6m (current regime) | 1119 | 4.0 | 11.6 | 20.3 | 49.9 | 131.8 | 222.2 |
Source: Glassnode. As of 7/14/2026. Past performance is not a guarantee of future results. Not intended as a recommendation to buy or sell any securities named herein.
NUPL, a gauge of how much of the market's Bitcoin is sitting at a paper gain rather than a loss, is currently reading 0.19, with its 30-day average at 0.17. This is down 33% from the prior month and the metric sits in the17th percentile of the past four years and below both the one-year and four-year averages of about 0.37. This puts the market in the Hope and Fear zone where more coins are underwater than usual. Other metrics of profitability agree as 53% of supply is in profit against a four-year average of 76% (only the 9 th percentile), and unrealized losses equal to 16% of market value which sits in the 81 st percentile.
Another important metric we highlight is the realized profit and loss ratio that compares the dollars of profit taken to the dollars of loss realized each day. This figure has recovered to 0.43 from 0.28 but is still below 1.0, meaning more value is being locked in at a loss than at a gain, and well under its four-year average of 2.29. In past cycles, when this ratio has sat below 1.0 on a 30-day basis, bitcoin's following one to six months have run below normal by a statistically significant margin, while a NUPL reading this low has usually lined up with the kind of discount that came before above-average returns over the next year or more.
AI Pivot Continues Even as Miner Stocks De-Rate
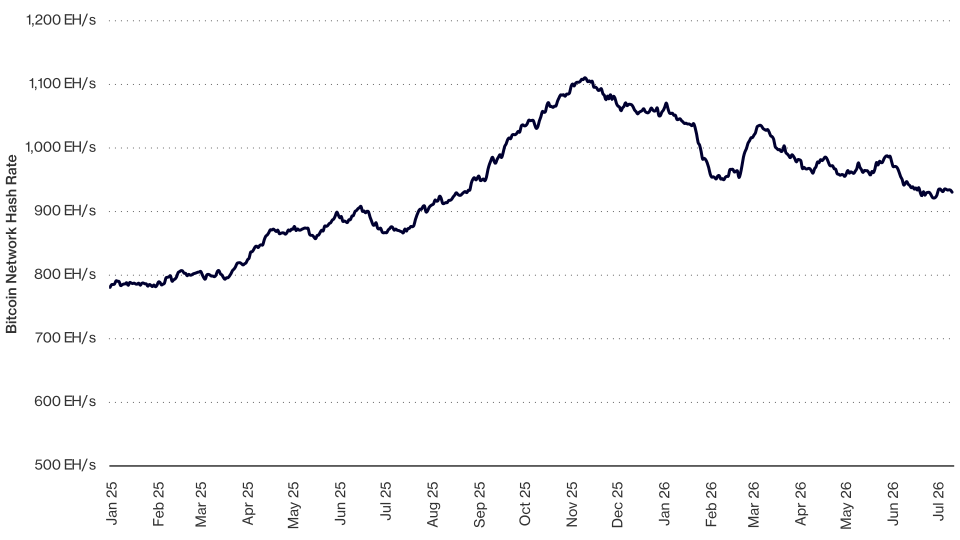
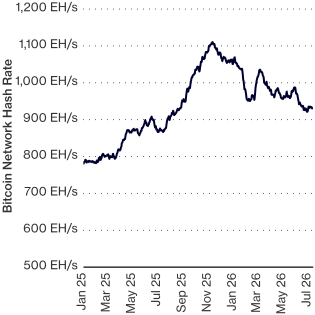
Network Hash Rate (30-Day Average)
Source: Glassnode. As of 7/14/2026. Past performance is not a guarantee of future results. Not intended as a recommendation to buy or sell any securities named herein.
Over the past 30 days (through July 12), pulse on Bitcoin’s miner is worsening economics as hash rate remains elevated despite the price drop. Network hash rate has held near record highs, averaging roughly 930 EH/s over the period and printing about 915 EH/s on the latest read.
Daily miner revenue currently averages $28.5M (-39.5% y/y) over the trailing 30 days against a trailing-twelve-month average near $40.5M (-30%). The latest daily print of $28.9m sits at only the 12 th percentile of the last twelve months and the 29 th percentile since 2023. June was the first full month to reflect the economics slump, with miner revenue estimated to be $841m, down 25% from May's $1.12B. July miner revenue is tracking similarly weak month-to-date, at about $322m through the 12th.
The combination of High hashrate and low revenue compress per-unit economics to depress implied hashprice (daily revenue divided by hashrate) to roughly $30.6 per PH/s/day. This is bordering multi-year lows and is at a level where lower-efficiency rigs run at or below breakeven and BTC's YTD -26% decline has made the squeeze worse.
Total miner-held BTC sits near 1.785m, essentially flat year over year (+0.1%) and down only about 2.3% from roughly 1.828m in early 2023. That is consistent with steady selling of newly mined coin rather than capitulation. The bigger balance-sheet story is corporate: the listed miners (Bitdeer, Bitfarms, Core Scientific, Riot, MARA) have sold more than 15,000 BTC from treasuries to fund AI/HPC buildouts. That is large for any single company but small against total miner-held supply.
Miner Headlines:
- MARA acquired 1,200 acres in TX that is expected to provide 1GW of grid connected access by October '27 and another 1GW by April '26, for ~$600M.
- WULF signed a 20-year AI lease with Anthropic for $19B to provide 401MW of CITL. The company also agreed to sell its 50.1% stake in its Abernathy JV.
- CLSK signed a 20-year lease with an IG tech company to provide 175MW of CITL for $6.6B.
- HIVE signed a LOI with IG tenant for 10-years to utilize 25MW of CITL.
What Have We Learned About the AI Pivot Since June?
Since publishing our Valuation Framework for Bitcoin Miners Pivoting to AI last month, the group has broadly de-rated despite the underlying case for their power assets remaining intact, as evidenced by continued deal flow and new market entrants. We believe the disconnect is worth unpacking.
The sell-off has been driven by a range of factors:
- Rates and market technicals: The 10-year Treasury yield has moved higher, directly threatening the cost of capital required to fund these buildouts and compressing the spread between project returns and financing costs. Compounding this, the semiconductor index, now larger than the consumer staples and consumer discretionary sectors combined, has become increasingly overbought, and its high correlation with AI infrastructure stocks has dragged the group lower.
- Regulatory/Political overhang: The New York Governor's executive order pausing all new data center construction for one year, along with other sites being abandoned across the country from community-led push-back, has the market pricing in further risk to these companies developing their future planned capacity.
- AI ROI skepticism: Questions are mounting around whether enterprises are seeing tangible returns on AI spend as companies look to cut back on their spending, a narrative that if gains traction, could slow hyperscaler capex towards the power underpinning these deals.
- Open-source pressure: The rapid advancement of open-source models could threaten the pricing power of proprietary LLMs, raising the potential for commoditization across the model layer, and dampening the durability of AI infrastructure demand.
Against these headwinds, we have maintained conviction in the sector, underpinned by continually improving deal terms, new entrants validating the opportunity, and hyperscaler capex trajectories that still imply meaningful acceleration into 2027. We are further encouraged by growing indications that enterprises are increasingly looking to secure dedicated compute capacity, a signal that AI ROI concerns may be overstated, and that the demand underpinning these infrastructure buildouts is more durable than the recent de-rating implies. AI contracts are being signed at higher values per MW and longer terms (WULF ~$2.36M/MW for 20-yrs to Anthropic), and with embedded expansion paths for additional MWs from the same customer (CLSK including LOI and exclusivity for nearly 900MW of additional power in its portfolio). We view continued strong appetite for data-center debt, improving financing terms, and the ability to diversify geographically as meaningful offsets to the near-term noise, and to the extent construction pauses spread to other states, the scarcity value of already-permitted and energized capacity increasing. Scrutiny of this space is to be expected given the size of this technological shift, and we view it as a feature of the opportunity rather than a flaw in the thesis.
Looking at our comp sheet below, we see that while the de-rating has been broad-based, names with higher premiums and a smaller share of MWs leased out have been hit harder, as the market grows less willing to pay up for a "story" and more focused on visible cash flows. We also identify that on average, our group is ~42% below its 52-week high.
Comp Sheet - Capacity
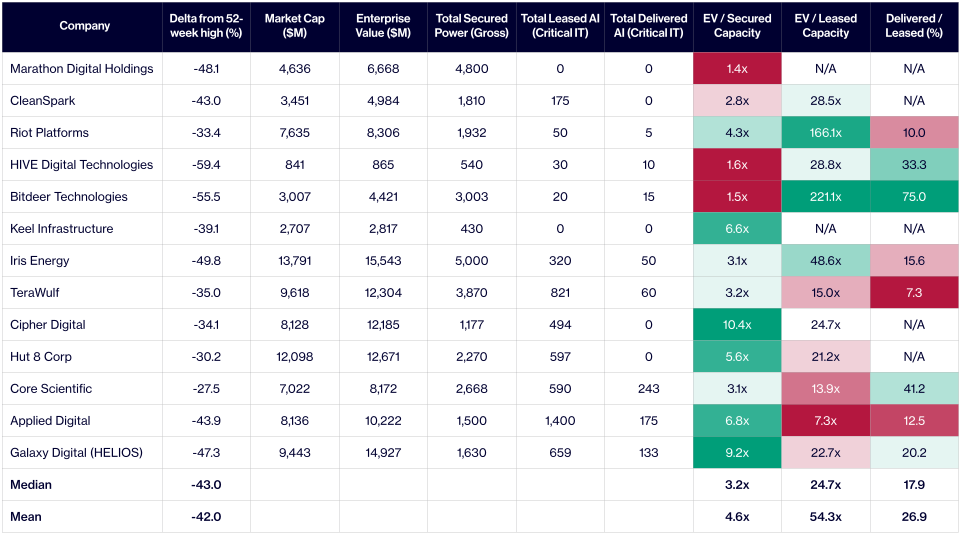
Source: VanEck Research, Bloomberg. As of 7/14/2026. Past performance is not a guarantee of future results. Not intended as a recommendation to buy or sell any securities named herein.
Returns on Capex Improving, Supporting "Second Mover Advantage"
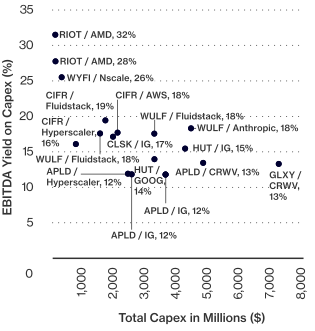
While we have only seen a couple of new AI deals since our prior note (WULF & CLSK), these transactions rank among the most attractive we have observed on an unlevered yield to capex basis. The strength of these expected returns supports the "second-mover advantage" thesis. As power scarcity persists, the value of available capacity increases. Companies with remaining 2027-2028 power availability may be able to secure increasingly attractive pricing and contract terms as the demand continues to outpace supply.
Return on capex remains an important metric for evaluating these opportunities, as investors focus more closely on the capital intensity required to fund large-scale infrastructure buildouts. Notably, while the cost of raising capital has continued to decline, the returns generated on deployed capex have moved higher (on avg), widening spreads and enhancing shareholder value creation. For recent projects, we estimate debt financing could support ~80-85% loan-to-cost, at borrowing costs meaningfully below the mid-to-high-teens unlevered yields implied by these investments. With longer deal terms and expansion opportunities embedded in many projects, the ultimate returns could prove even more attractive than initial economics suggest.
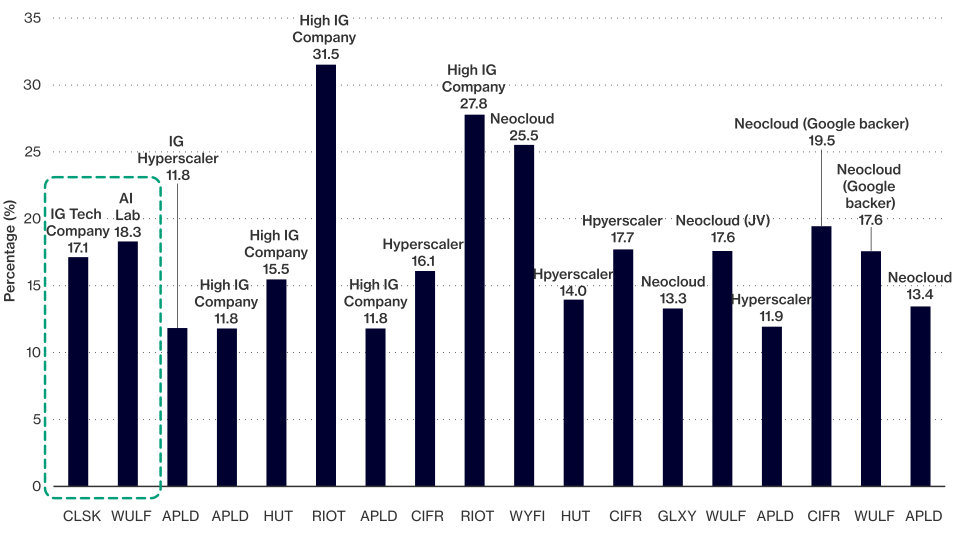
Source: VanEck Research, Bloomberg. As of 7/14/2026. Past performance is not a guarantee of future results. Not intended as a recommendation to buy or sell any securities named herein.
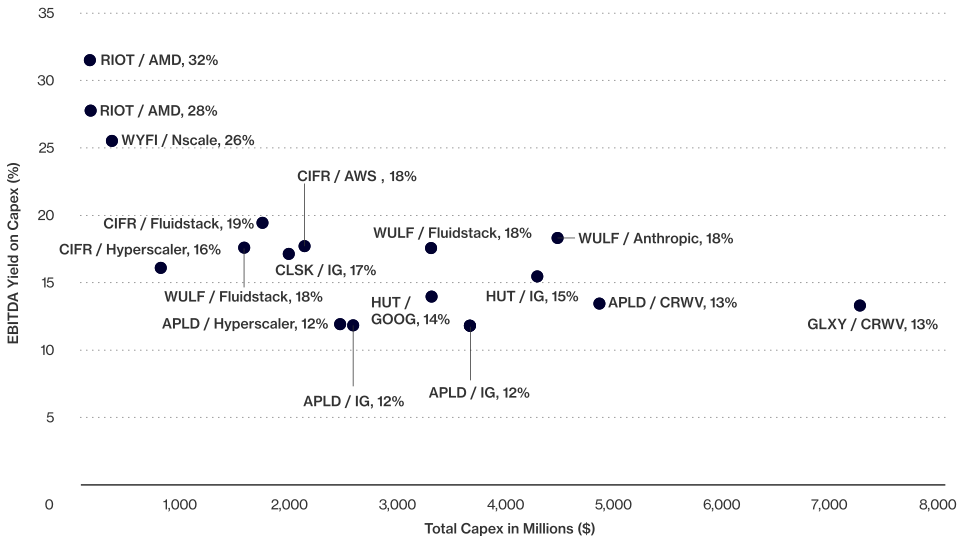
Source: VanEck Research, Bloomberg. As of 7/14/2026. Past performance is not a guarantee of future results. Not intended as a recommendation to buy or sell any securities named herein.
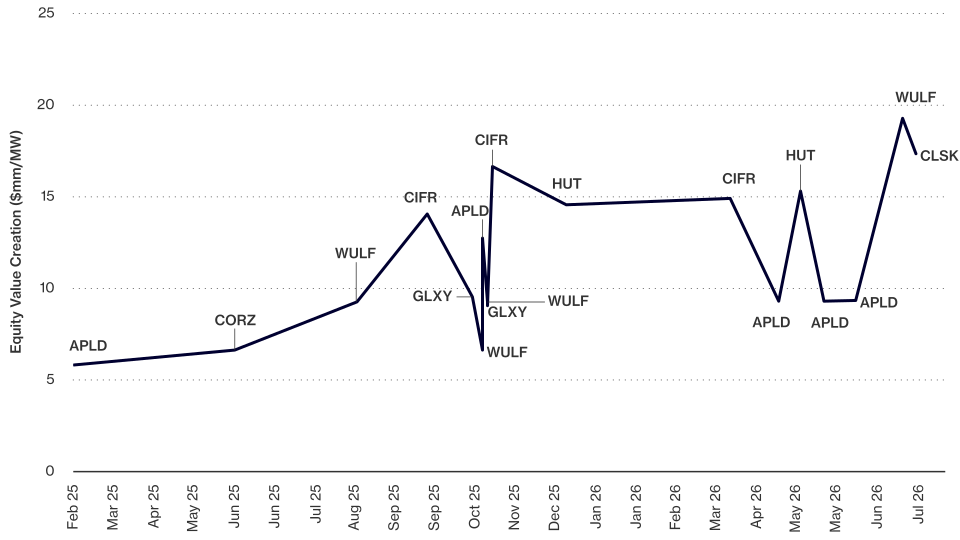
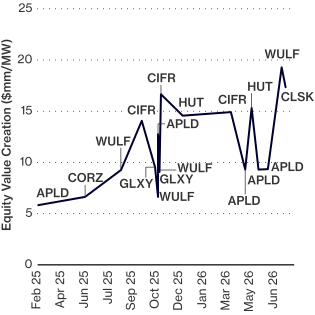
Equity value created per MW has trended higher, with the most recent deals ranking among the strongest we've tracked. WACC remains the key sensitivity in this framework, and the continued decline in borrowing costs for these projects is a constructive signal that equity value creation has room to trend higher from here.
Source: VanEck Research, Bloomberg. As of 7/14/2026. Past performance is not a guarantee of future results. Not intended as a recommendation to buy or sell any securities named herein.
Recent Transactions as an Implied Exit Value
Since June, tangible transactions in the data center REIT space have started to print for delivered MWs. For leases that exist today, we can begin to move beyond MW as a sole proxy for value, and begin to translate each miner's contracted capacity into a dollar range, bracketed by what private buyers and REITs are willing to pay per MW.
That range is wide, and the spread reflects buyer type as much as asset quality. At the high end, public REITs have shown a willingness to pay up to consolidate full ownership of already-leased assets, particularly where they're buying out an existing JV partner rather than acquiring cold. Using low-cost public equity and debt, these buyers can justify a premium for scarce, fully de-risked capacity in top-tier markets, leased to investment-grade hyperscale tenants on long terms. We view this as a ceiling for delivered power, where Digital Realty has paid as much as $27M per MW for high quality stabilized assets.
At the low end, disciplined institutional buyers underwriting new acquisitions to a target cash yield are structurally more price-sensitive. These vehicles are raising capital from investors who care about current distributions, so every deal has to clear a minimum return threshold, capping what they can pay per MW even for good-quality, stabilized assets. We view this as a floor, with Blackstone's Digital Infrastructure Trust (BXDC) underwriting new acquisitions in the $12-15M/MW range.
BTC Correlations Have Stepped Down
Consistent with our prior view, BTC correlation across the group has begun to drift lower. YTD avg daily-return correlation has declined from 0.55 to 0.50 since our last note, with the 1-year figure similarly compressing from 0.49 to 0.46. While these moves are minor, they are signs that the market is beginning to gradually reprice these businesses on their own merits rather than as BTC miners. We expect this trend to continue as contracted AI revenues become a larger share of forward earnings.
Correlation (Daily Returns)
| Period | MARA | RIOT | CLSK | CIFR | IREN | BTDR | CORZ | WULF | HUT | KEEL | HIVE | APLD | Avg |
| YTD | 0.66 | 0.54 | 0.67 | 0.44 | 0.43 | 0.43 | 0.41 | 0.46 | 0.44 | 0.55 | 0.54 | 0.44 | 0.50 |
| YTD (Prior) | 0.70 | 0.60 | 0.72 | 0.49 | 0.46 | 0.46 | 0.48 | 0.51 | 0.49 | 0.62 | 0.57 | 0.46 | 0.55 |
| 1-year | 0.66 | 0.52 | 0.64 | 0.40 | 0.36 | 0.43 | 0.36 | 0.30 | 0.44 | 0.48 | 0.51 | 0.36 | 0.46 |
| 1-year (Prior) | 0.70 | 0.58 | 0.67 | 0.45 | 0.39 | 0.49 | 0.36 | 0.35 | 0.49 | 0.53 | 0.52 | 0.32 | 0.49 |
| 2-year | 0.69 | 0.61 | 0.66 | 0.49 | 0.46 | 0.51 | 0.40 | 0.42 | 0.55 | 0.55 | 0.57 | 0.29 | 0.52 |
| 3-year | 0.63 | 0.58 | 0.61 | 0.47 | 0.47 | 0.40 | NM | 0.41 | 0.53 | 0.53 | 0.55 | 0.26 | 0.49 |
| 5-year | 0.61 | 0.59 | 0.55 | 0.40 | NM | NM | NM | 0.28 | 0.57 | 0.56 | 0.55 | 0.22 | 0.48 |
| 2025 | 0.69 | 0.56 | 0.63 | 0.44 | 0.43 | 0.54 | 0.35 | 0.36 | 0.55 | 0.49 | 0.53 | 0.28 | 0.49 |
| 2024 | 0.60 | 0.63 | 0.60 | 0.53 | 0.48 | 0.46 | NM | 0.44 | 0.57 | 0.55 | 0.58 | 0.23 | 0.51 |
| 2023 | 0.67 | 0.60 | 0.54 | 0.51 | 0.54 | 0.06 | NM | 0.35 | 0.62 | 0.59 | 0.59 | 0.11 | 0.47 |
Source: VanEck Research, Bloomberg. As of 7/14/2026. Past performance is not a guarantee of future results. Not intended as a recommendation to buy or sell any securities named herein.
Frequently Asked Questions
What do bitcoin’s derivatives markets indicate about near-term price direction?
Current derivatives positioning suggests below-average returns over the next 30–180 days. The 1-month put/call implied volatility skew has widened to +11.4 percentage points (83rd percentile since 2021), a level historically associated with softer forward returns. Perpetual futures funding of +4.5%–6.7% annualized corroborates this. A sustained reversal to negative funding or a skew above +15pp would be more constructive signals.
Why are bitcoin miner economics under pressure in mid-2026?
Miner revenue is under pressure from two converging forces: bitcoin’s year-to-date price decline of roughly 26% and record-high network hash rate averaging ~930 EH/s. This has compressed implied hashprice to approximately $30.6/PH/s/day, near multi-year lows. Daily miner revenue over the trailing 30 days averaged $28.5M, down 39.5% year-over-year. Lower-efficiency mining rigs are running at or below breakeven, though total miner-held supply remains stable, suggesting managed selling rather than forced capitulation.
What does the growth in long-term bitcoin holders mean for the market outlook?
The share of circulating bitcoin supply held for more than one year has reached 60.8%, in the 68th percentile historically, and has been rising steadily through the price decline. An additional 17.7% of supply sits in the 6–12-month aging band. Historically, regimes where the long-term holder share exceeds 60% and is rising have been associated with above-average bitcoin returns over 30-day to 2-year horizons, suggesting that while near-term caution is warranted, the structural supply picture is constructive for patient investors.
Links to third party websites are provided as a convenience and the inclusion of such links does not imply any endorsement, approval, investigation, verification or monitoring by us of any content or information contained within or accessible from the linked sites. By clicking on the link to a non-VanEck webpage, you acknowledge that you are entering a third-party website subject to its own terms and conditions. VanEck disclaims responsibility for content, legality of access or suitability of the third-party websites.
To receive more Digital Assets insights, sign up in our subscription center .
免责声明:本文章仅代表作者个人观点,不代表本平台的立场和观点。本文章仅供信息分享,不构成对任何人的任何投资建议。用户与作者之间的任何争议,与本平台无关。如网页中刊载的文章或图片涉及侵权,请提供相关的权利证明和身份证明发送邮件到support@aicoin.com,本平台相关工作人员将会进行核查。


