The Bitcoin market rebounded after a second bottom test above 60,000, with the prior low at 57,758 establishing a support range. Yesterday, the market found strong support around 62,500, and today it closed with a large bullish candle at a current price of 64,700. The market had a net inflow of 602 million USD, and buying funds continue to flow in. The daily Bollinger Bands are generally flat and closing upwards, the MACD bullish green bars have completely turned to red bars, and the RSI has reached 61.9, indicating a neutral to bullish zone. The mid-term bullish trend has stabilized, with the first resistance level above being the intraday high of 65,260. Standing firmly at this position will allow for a challenge at the previous 67,000 line. The key mid-term support below is 62,500; as long as this bottom does not break, the overall oscillation upward structure will not change;
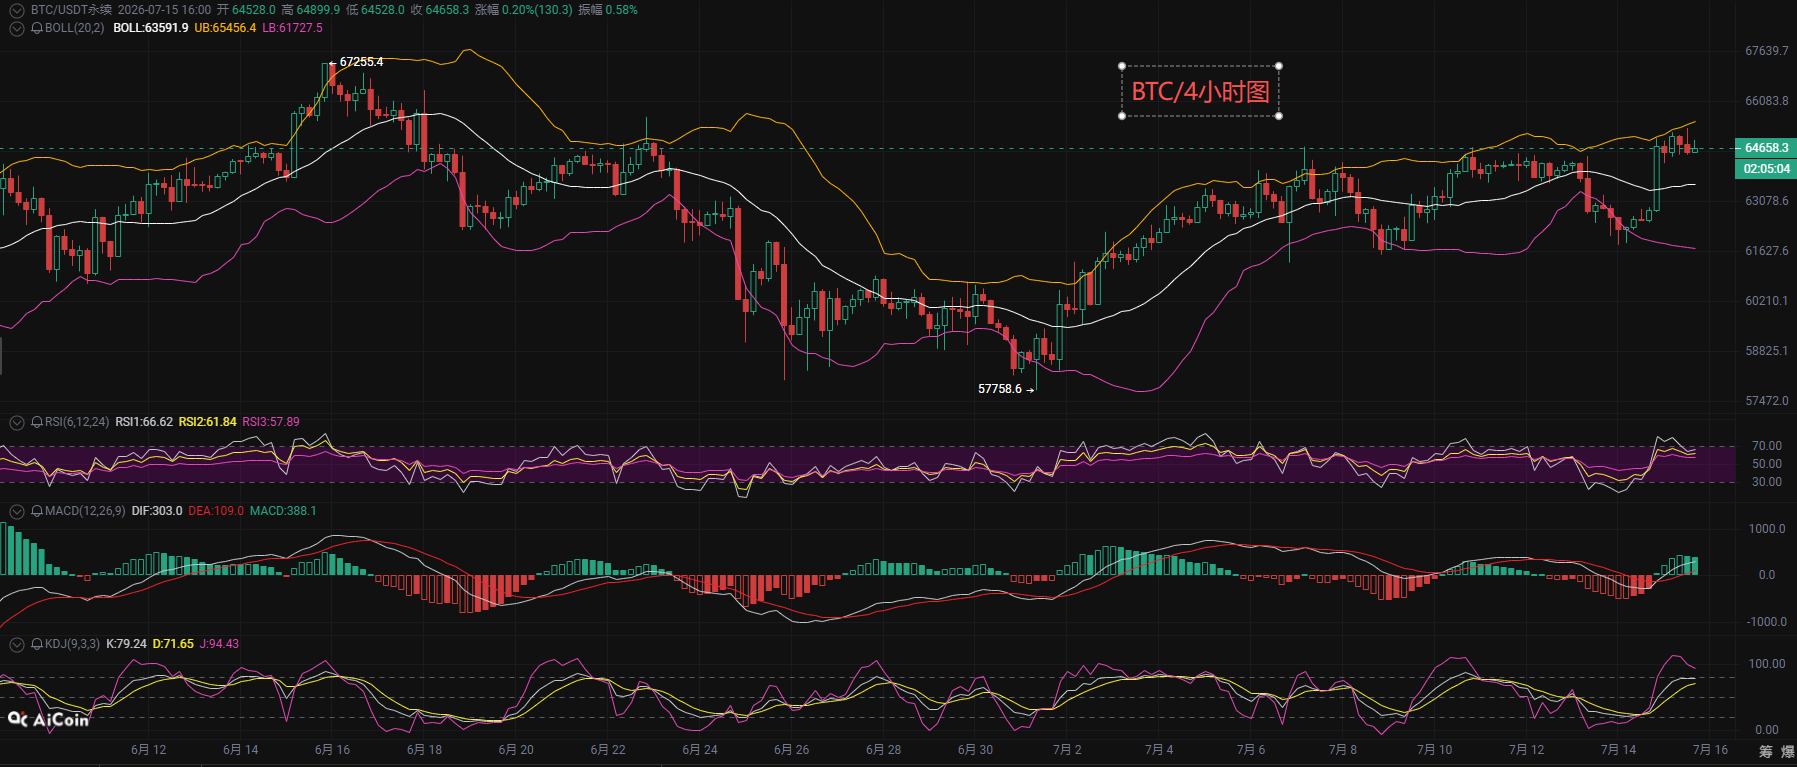
Looking at the 4-hour cycle, during the first half of the market, it deeply dipped to a low of 61,806, with very strong support from funds. A single large bullish candle directly broke through the middle Bollinger Band resistance, reversing the short-term bullish trend. However, the current RSI value of 67.2 is close to the overbought zone, and the KDJ indicator is at a high position, indicating a short-term need for a pullback. The 4-hour support range is 64,000-64,200; in the shorter time frame, the market can be seen more clearly. Yesterday, it started a one-sided rise from 62,458, and the Bollinger Bands opened upwards. However, the current MACD red bars are continuously decreasing, suggesting a weakening of bullish momentum, and the KDJ indicator is turning downwards, indicating that a short-term pullback might occur, making it unsuitable to blindly chase higher prices at this level.
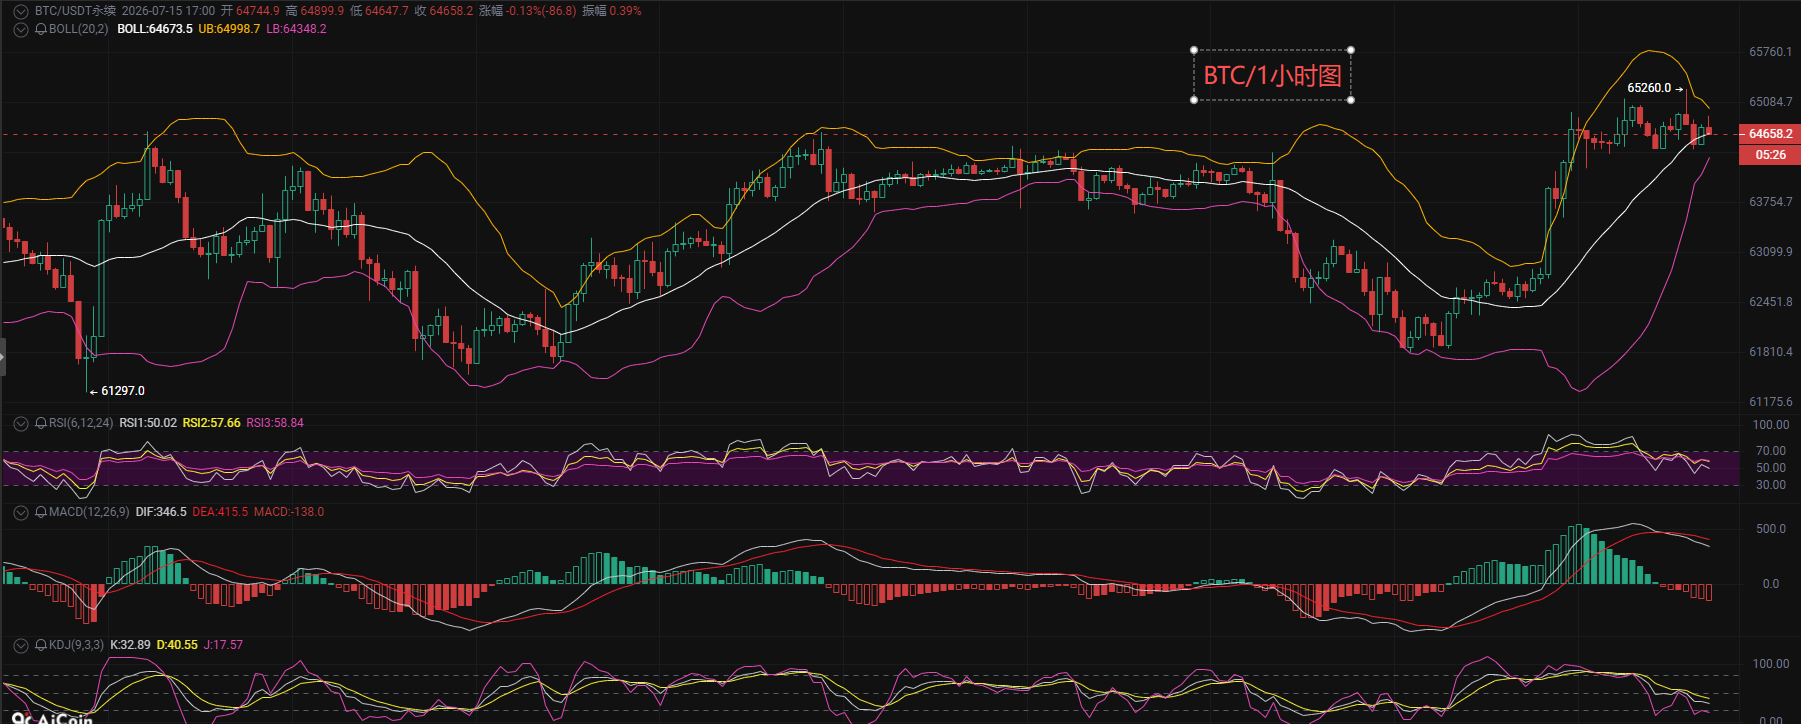
Here’s a practical approach for everyone: for those holding low-position long positions, the current price is close to the pressure zone; you may take profits in batches. Wait for a stabilization at the support level around 63,800 before re-entering long positions. Set stop-loss below the low point of 62,400; for those looking to bet on short positions, wait until the price reaches a high without breaking 65,260 and then try a small position after an hourly close shows resistance. Set the defense above 65,400; cautious traders should wait for a pullback support before entering the market to avoid losses from spikes after highs. The above is solely a technical sharing of the market and does not constitute any investment advice.Follow Mr. Coin for real-time analysis of the market.
7.15 Short-term Reference for Bitcoin:
Down in the range of 65,300-66,300, defending at 67,500, stop-loss at 500 points, target looking below 64,500
Up in the range of 62,300-63,300, target above 63,800, stop-loss at 500
There may be delays in sending the article; strategy suggestions are for reference only. The market changes rapidly; regardless of how confident you are in the market judgment, always manage your stop-loss and take profit to secure your gains.
7.15 Short-term Reference for Ethereum:
Above 1,905-1,925, defending at 1,870, target below 1,760,
In the range of 1,830-1,780, defending at 1,700, target above 1,880,
There may be delays in sending the article; strategy suggestions are for reference only. The market changes rapidly; regardless of how confident you are in the market judgment, always manage your stop-loss and take profit to secure your gains.
For more real-time trading strategies, online technical learning, and resolving positions, you can follow the instructor's public account (Mr. Coin Talks Coins) to get the add method: the first ten to daily will receive free strategies for resolving positions.

免责声明:本文章仅代表作者个人观点,不代表本平台的立场和观点。本文章仅供信息分享,不构成对任何人的任何投资建议。用户与作者之间的任何争议,与本平台无关。如网页中刊载的文章或图片涉及侵权,请提供相关的权利证明和身份证明发送邮件到support@aicoin.com,本平台相关工作人员将会进行核查。