Every market selloff gets blamed on liquidity.
People point to the Fed balance sheet, M2, credit spreads, real yields but which one is the signal?
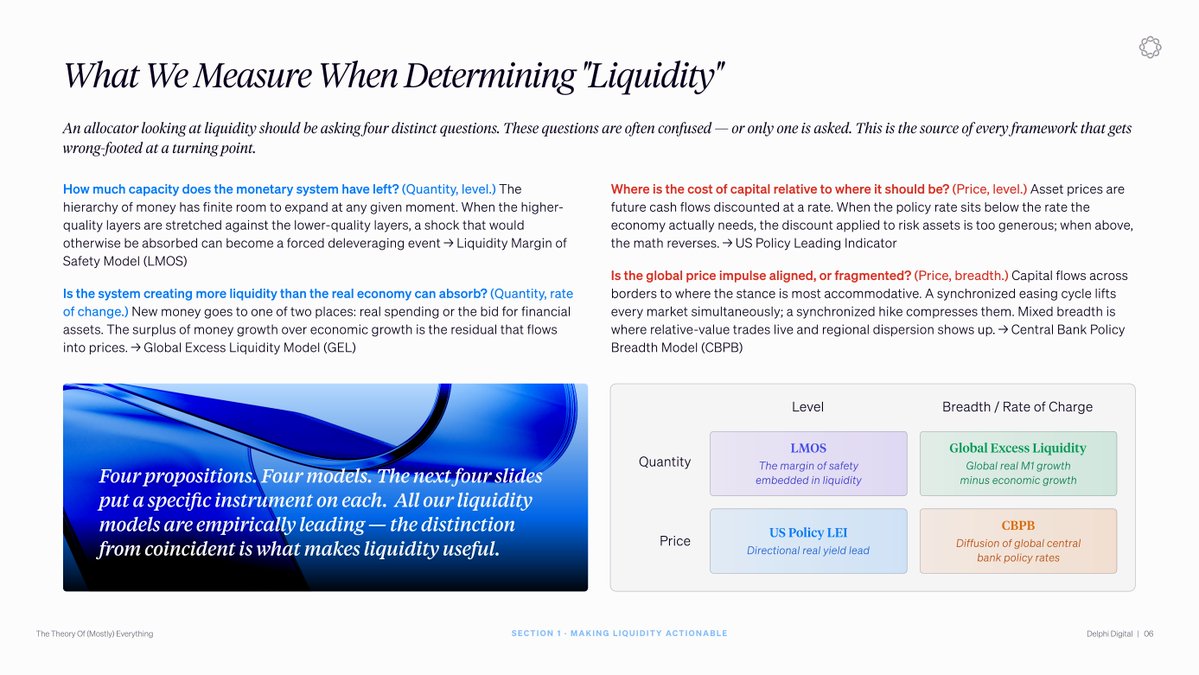
None of them fully. Liquidity is not one number but a structure with two sides: how much money exists, and what it costs. Quantity has a level and a rate of change. Price has a level and a breadth dimension. The popular indicators each capture a piece while missing the rest.
Money exists in a hierarchy with reserves and deposits on top and loans and securities below. When the lower-quality layers grow large relative to the higher-quality layers, the system has less capacity to absorb shocks without forced deleveraging.
New money goes to one of two places: real spending or financial assets. When money growth outpaces economic growth, the excess flows into asset prices.
Asset prices are future cash flows discounted at a rate. The discount applied to risk assets is too generous when policy rates sit below the rate the economy actually needs.
The math reverses when rates sit above. Money also moves to wherever it's cheapest, so markets rise and fall together when central banks act in sync. Mixed signals create rotation between regions instead.
These four questions are not interchangeable. Each one maps into asset prices and downside volatility on a different horizon, and the dominant driver rotates across cycles.
In 2018, quantity-of-money signals stayed constructive into the year and markets still sold off because the Fed was hiking. The dominant driver had rotated.
A framework built on one dimension misses every rotation. The Fed balance sheet, M2, credit spreads, and real yields are each tracking a piece of the system, not the whole thing.
免责声明:本文章仅代表作者个人观点,不代表本平台的立场和观点。本文章仅供信息分享,不构成对任何人的任何投资建议。用户与作者之间的任何争议,与本平台无关。如网页中刊载的文章或图片涉及侵权,请提供相关的权利证明和身份证明发送邮件到support@aicoin.com,本平台相关工作人员将会进行核查。


