Written by: Glassnode
Translated by: AididiaoJP, Foresight News
Bitcoin remains within the range of 60,000 to 70,000 USD. The spot market shows early signs of absorption, while the derivatives market has completed a reset. Volatility has cooled down, and the position structure has become more balanced. However, due to a lack of clear catalysts, the market lacks the confidence needed for a sustained breakthrough.
Summary
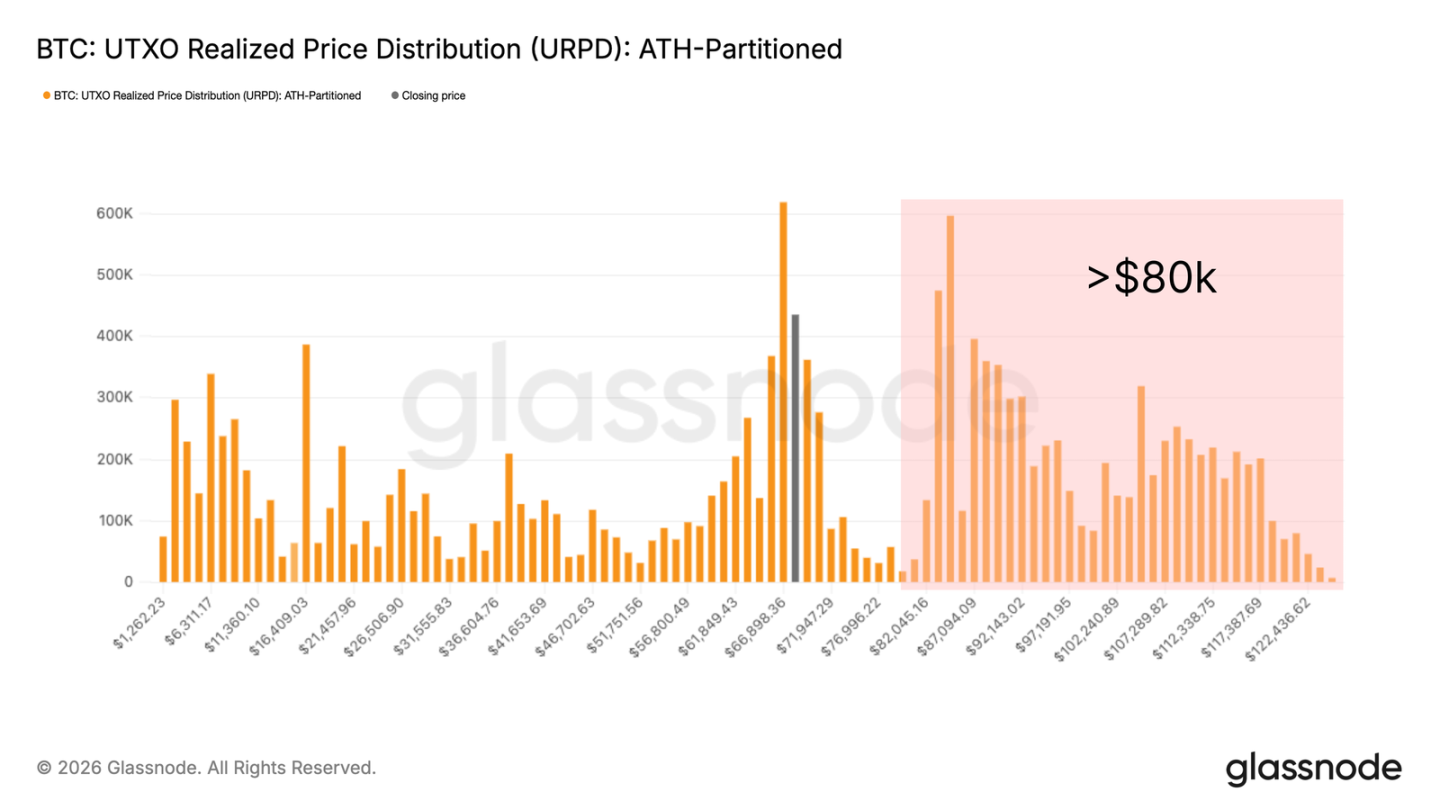
- Bitcoin is still staying within the wide range of 60,000 to 70,000 USD. URPD data shows that there is a dense supply accumulation in the range of 80,000 to 126,000 USD. To digest this supply accumulation, a larger price discount may be needed, or a longer redistribution process may be required.
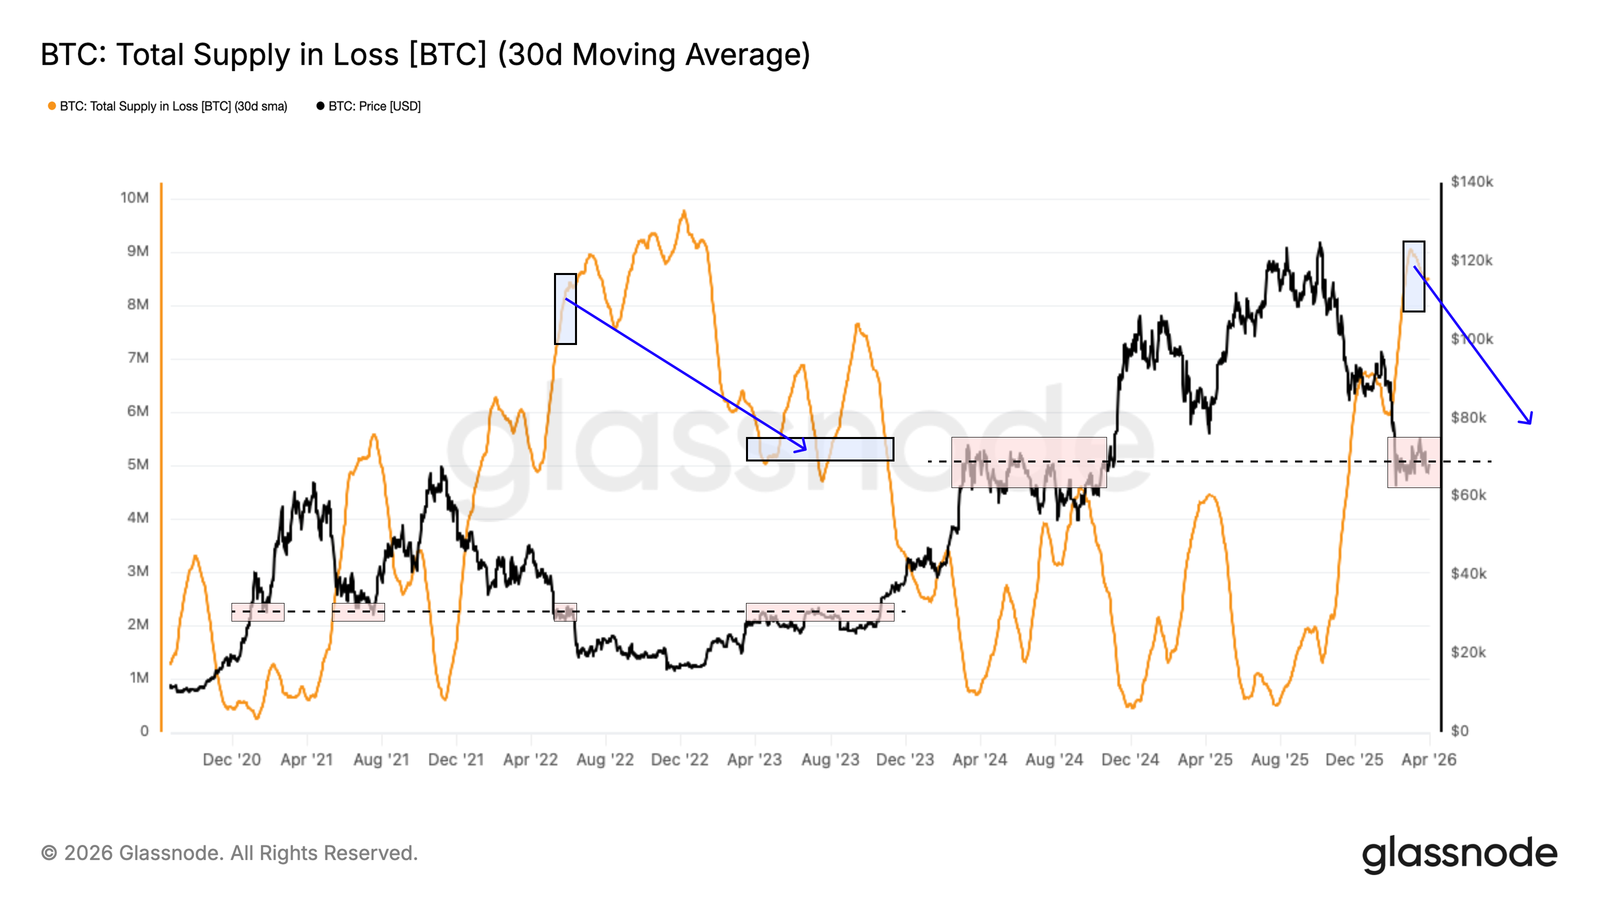
- The total supply in a loss state is close to 8.4 million BTC, which is similar to the market structure in the second quarter of 2022. At that time, the market needed to redistribute about 3 million BTC to return to the middle of the cycle.
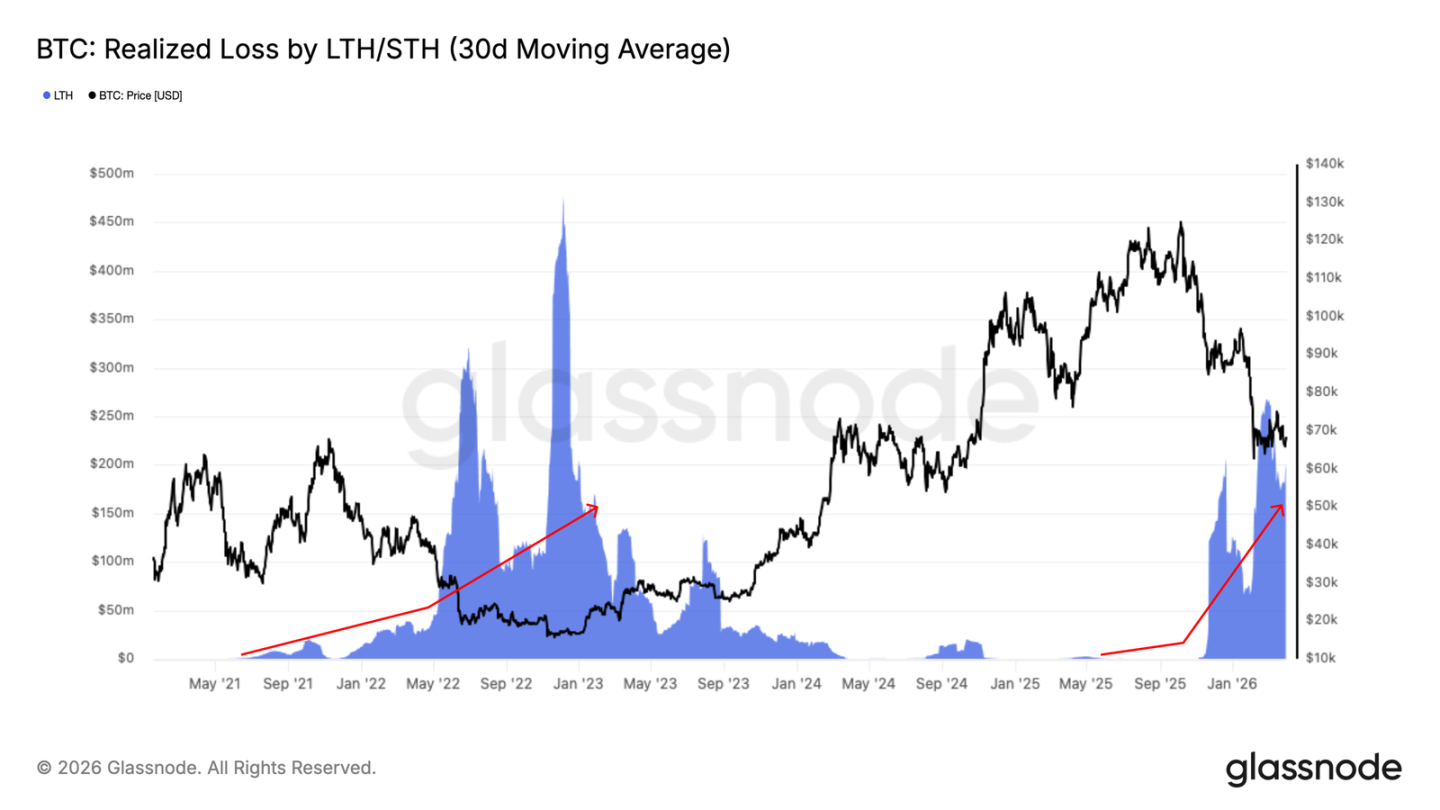
- The realized losses of long-term holders have continued to rise since November 2025, currently reaching around 200 million USD per day, confirming the emergence of active surrender behavior. If this metric cools down to below 25 million USD per day, it will be a key threshold for the market bottoming.
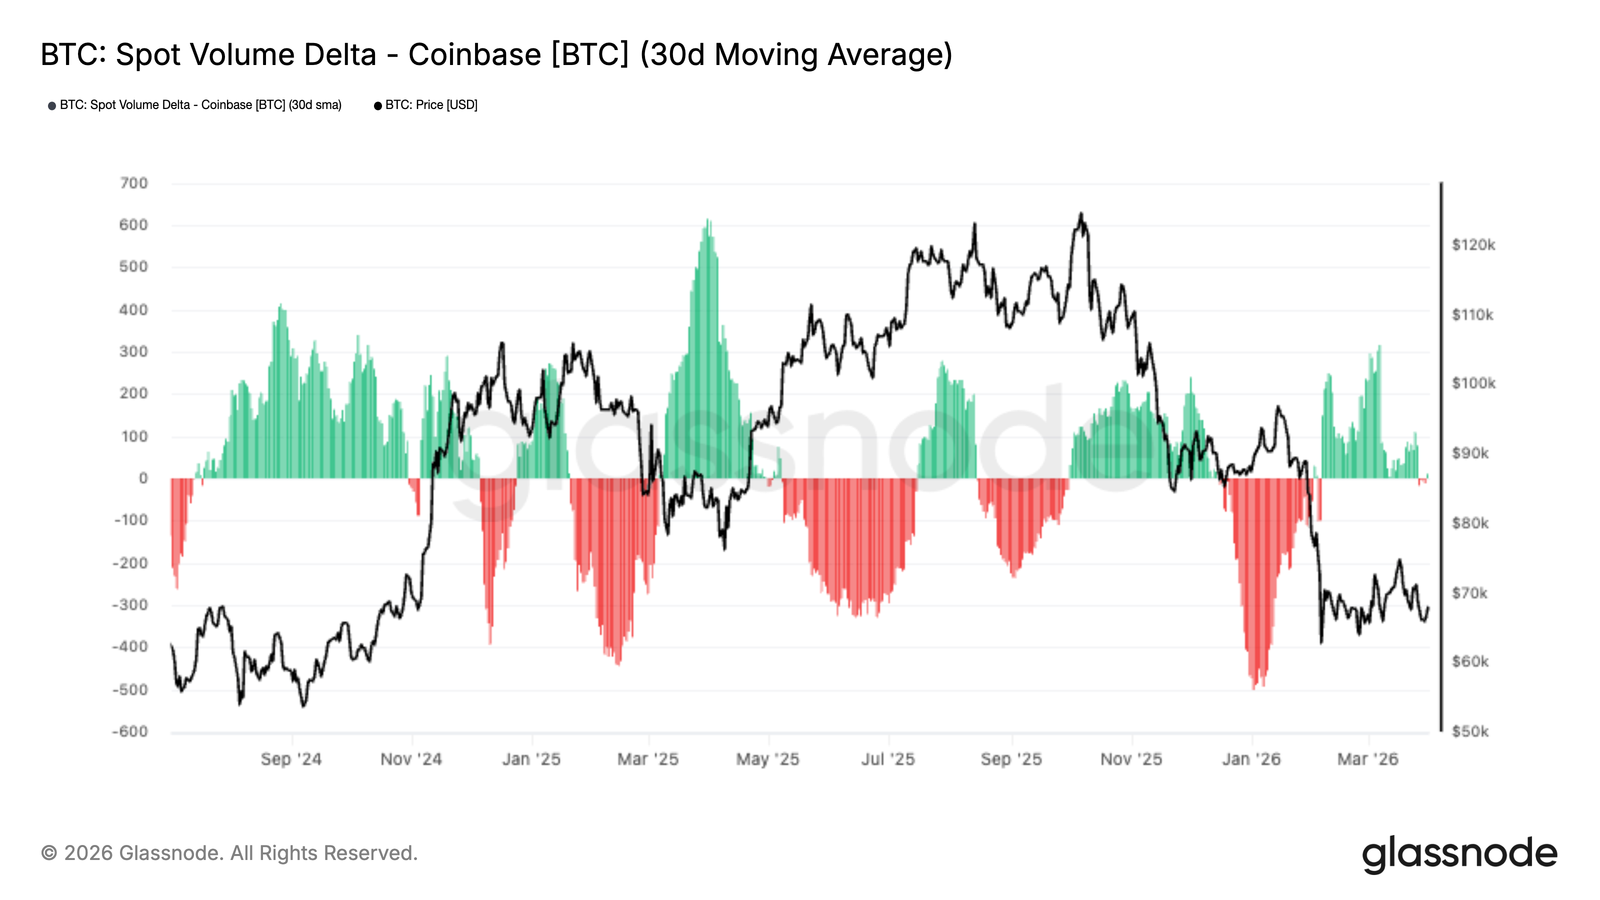
- The cumulative transaction volume difference on Coinbase's spot market has turned slightly positive, indicating that spot buyers are beginning to absorb selling pressure. However, the current level of demand is still far below the levels typically seen when forming sustainable lows in the market.
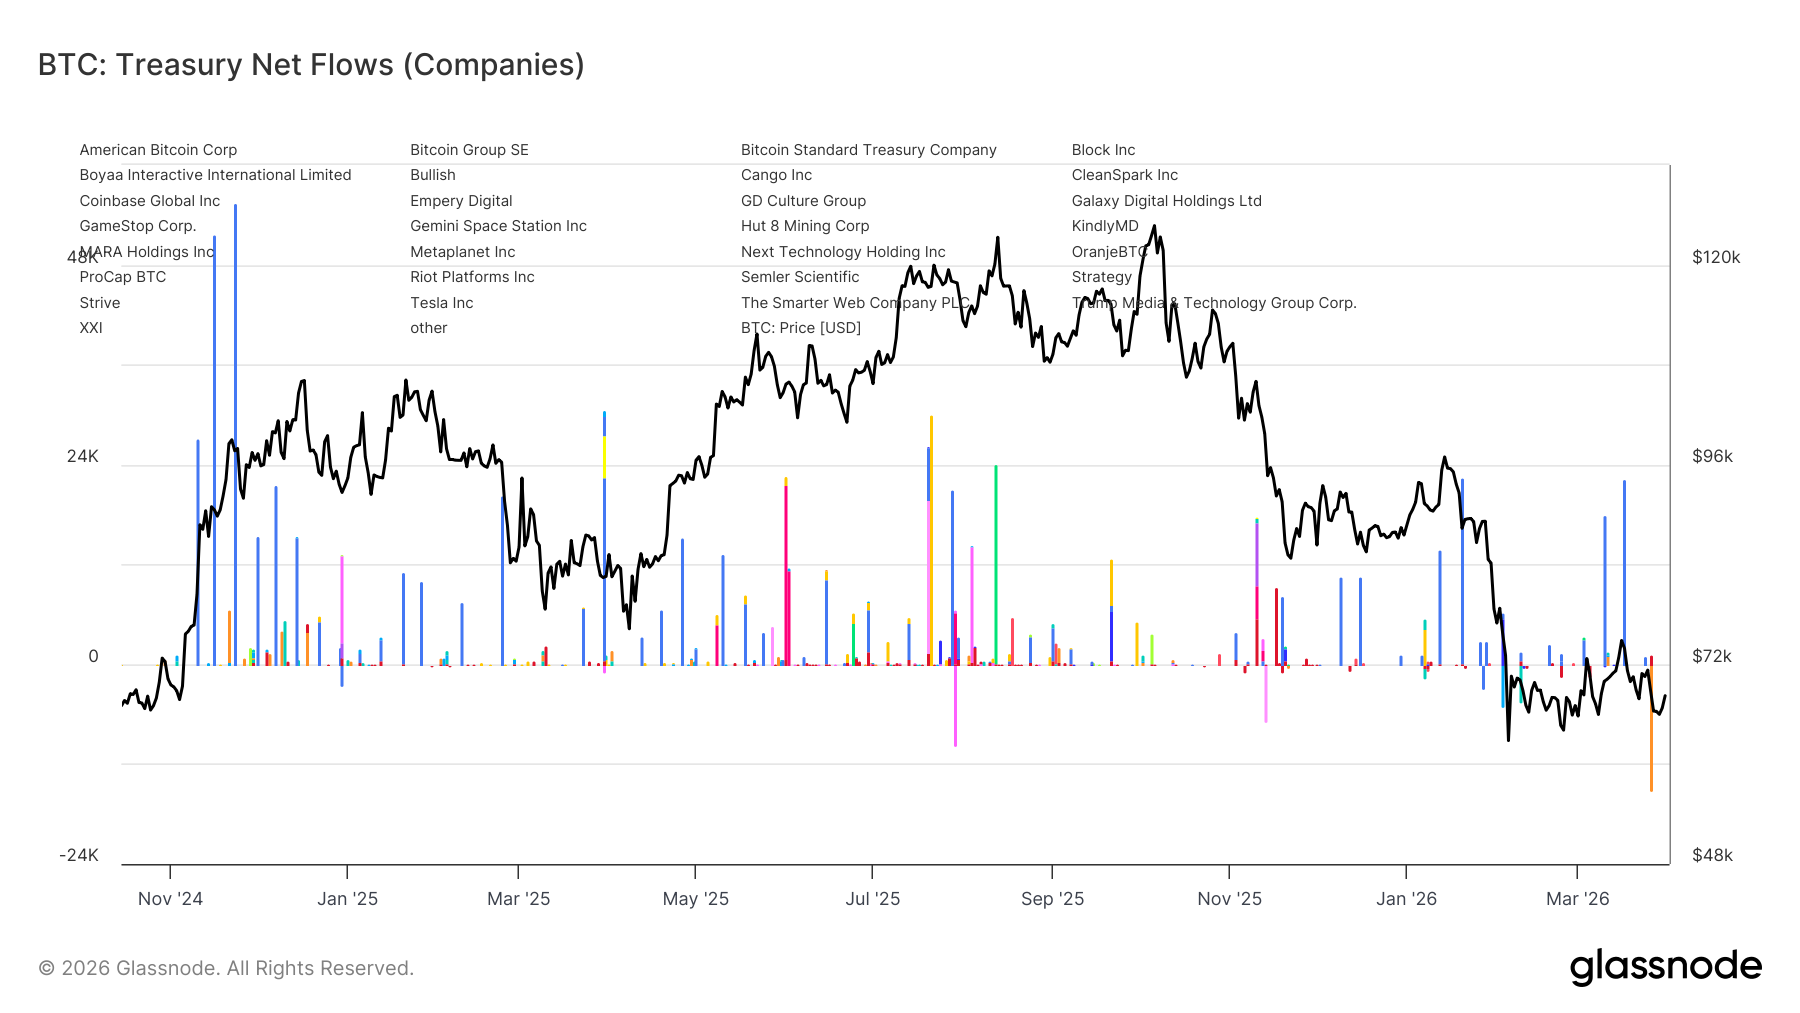
- Treasury fund flows have become more concentrated: Marathon has distributed about 15,000 BTC, while Strategy remains the only institution consistently making large purchases.
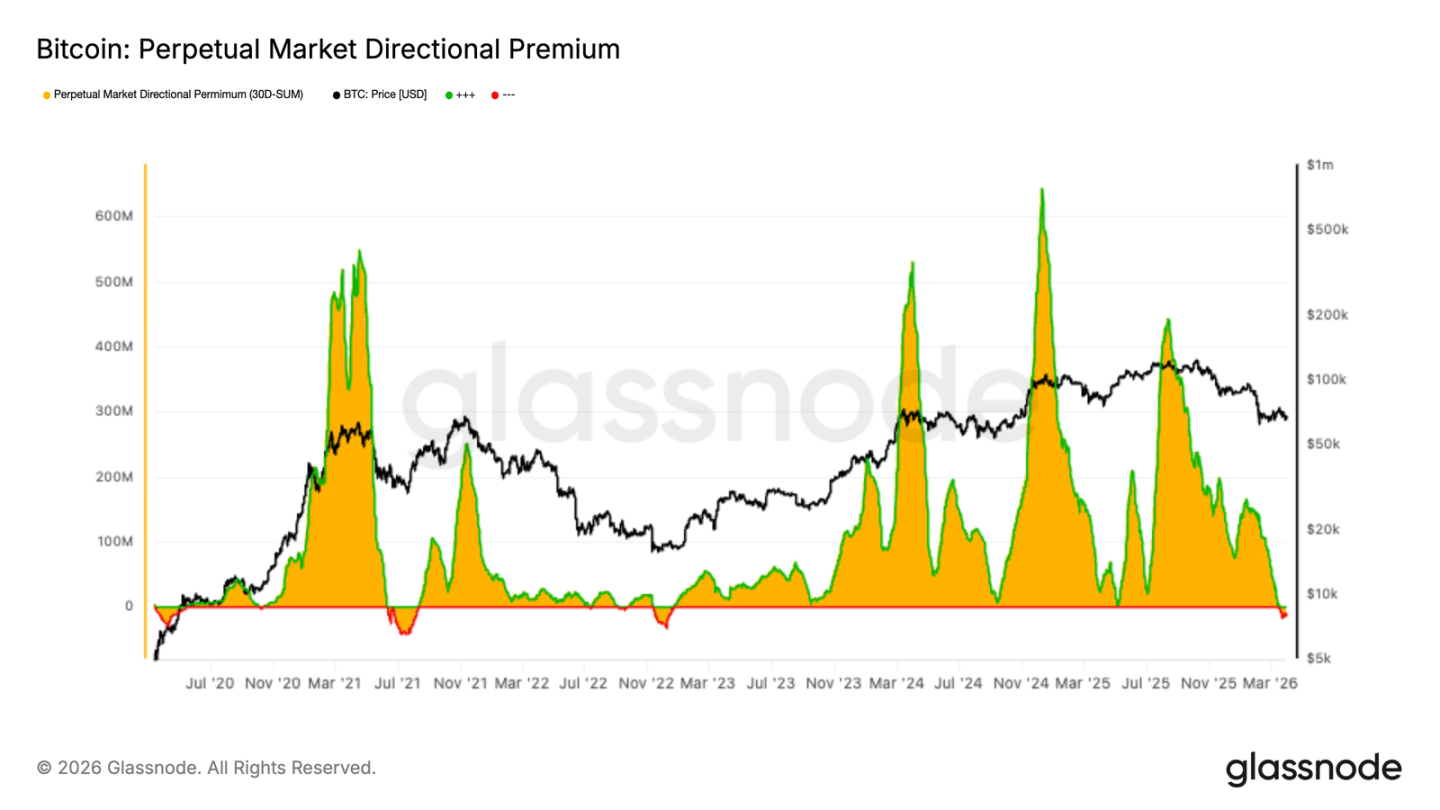
- The directional premium in the perpetual contract market has compressed to near neutral levels and slightly below zero, reflecting the reset of long leverage and cooling speculative enthusiasm.
- The current position status of perpetual contracts is no longer driven by momentum, as long positions are closing, and short interest is re-emerging. This makes the futures market as a whole more balanced, but also more cautious.
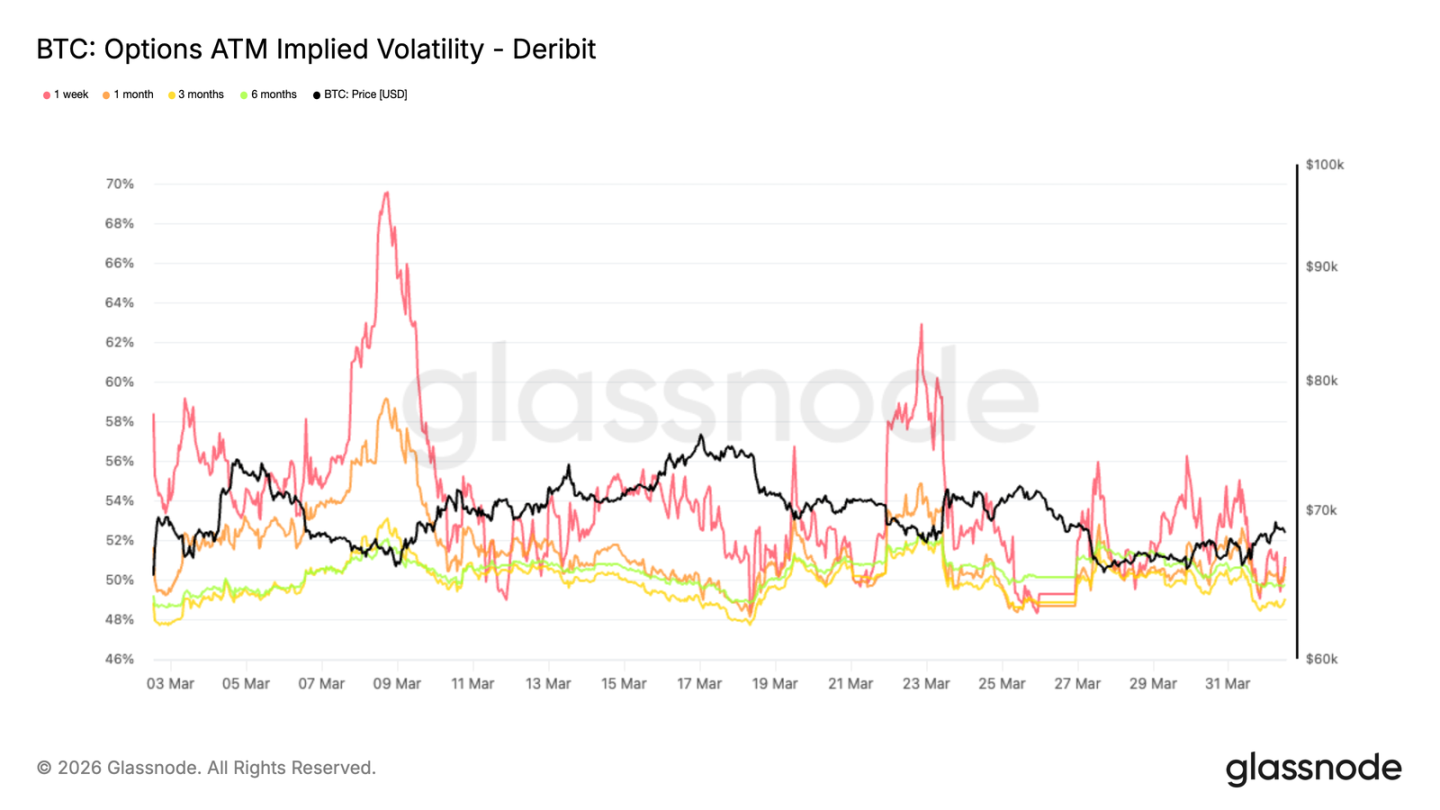
- Implied volatility has continued to soften across the entire term structure, indicating that the options market is pricing in a calmer environment in the short term and a decrease in demand for volatility exposure.
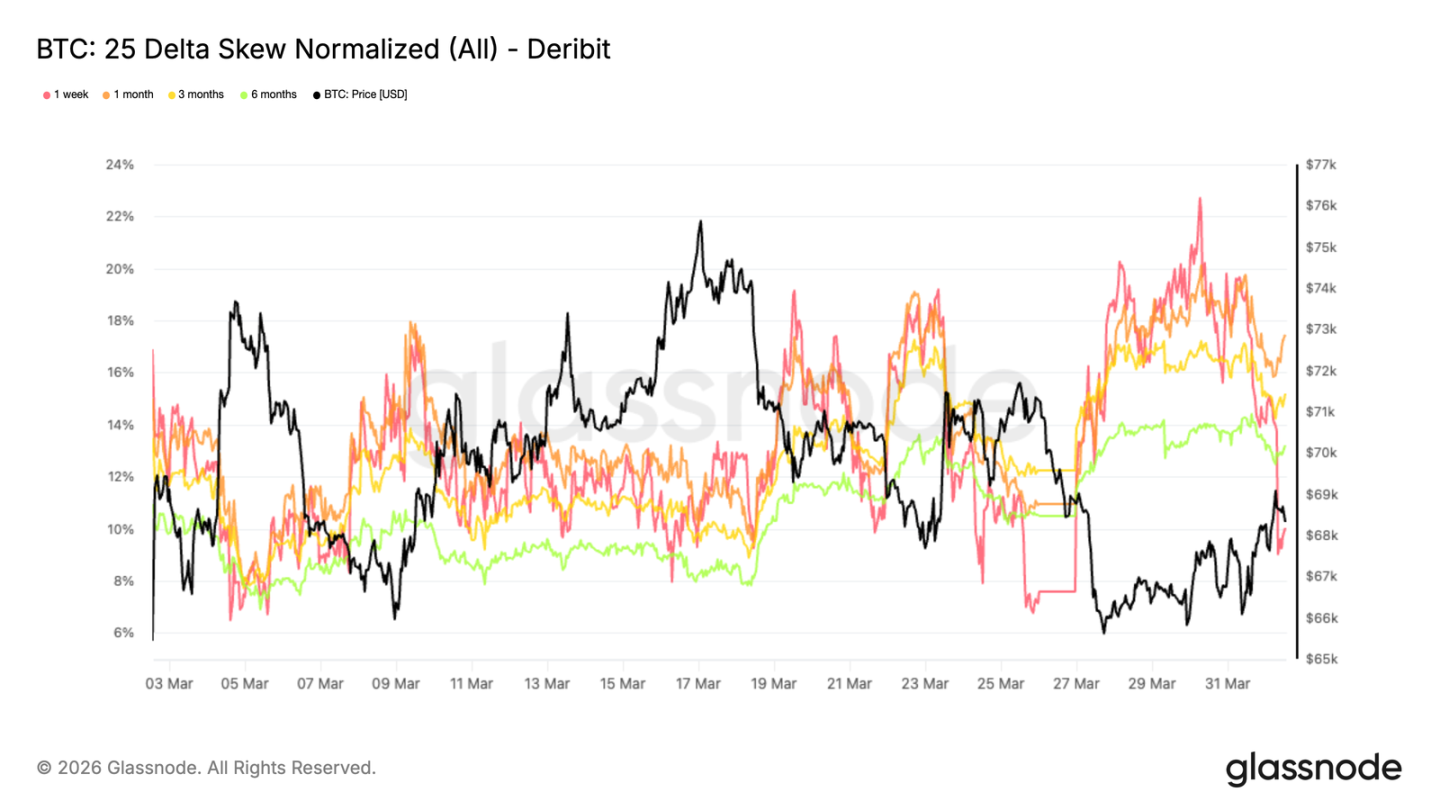
- The skew indicator has begun to tilt downward again, indicating a return of protective positioning, but its levels remain far below those usually associated with strong hedging demand.
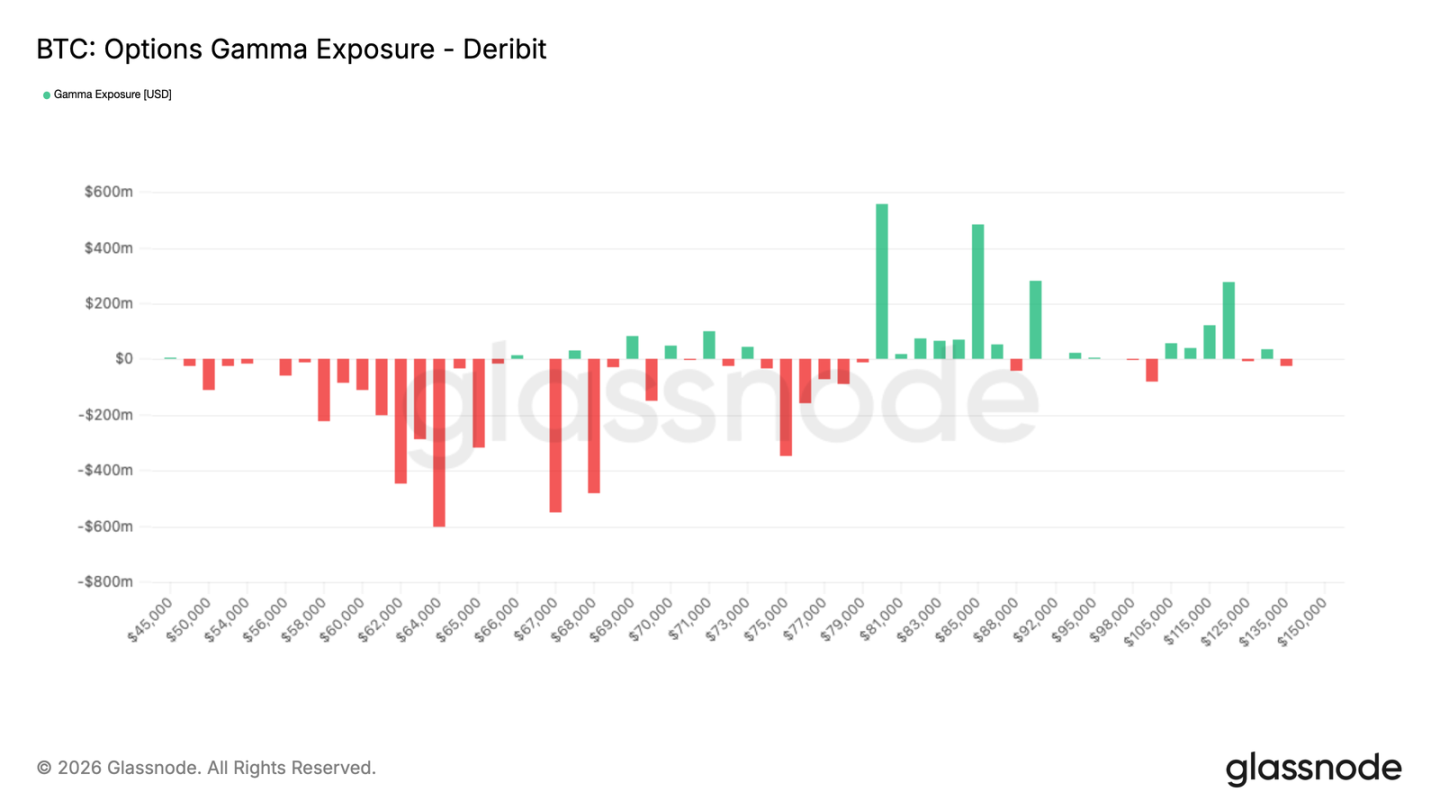
- Gamma positions have returned to a state supporting the market, reducing the convexity effect during price declines, and indicating that market maker's short-term positions have become more stable after a recent negative gamma phase.
On-chain Insights
Volume of Unrealized Loss Supply
As prices consolidate in the 60,000 to 70,000 USD range, this report will step out of short-term price dynamics to assess the structural forces shaping the current market environment. As stated in a recent report, one of the most persistent resistances suppressing momentum comes from the large supply purchased above 80,000 USD, which is currently in a state of unrealized loss.
This group has endured over six months in a bear market environment, facing a binary behavioral choice: to sell in any rebound to mitigate further losses or to psychologically surrender as prices decline deeper.
The URPD chart clearly illustrates this, showing a densely distributed supply cluster in the range of 80,000 to 126,000 USD, firmly hanging above market prices. Resolving this supply accumulation is likely to require significant price discounts to attract new buyers or to undergo a longer period of time for these coins to transfer from realizing loss holders to more resolute new holders.
Loss Supply Volume
To quantitatively assess the supply accumulation overhead, we can use the "Total Supply in Loss" metric. It counts the number of circulating bitcoins that last moved at a price higher than the current spot price. After smoothing through a 30-day simple moving average to eliminate short-term noise, this metric currently stands at about 8.4 million BTC, indicating that for the past month, about 8 to 9 million coins have continuously been in a loss state.
The scale of this value, combined with the spot price trading near the midpoint level of the current cycle, suggests that the market structure resembles that observed in the second quarter of 2022. Historically, resolving such a scale of supply accumulation requires a significant redistribution of coins from loss holders to new buyers entering at lower prices. The precedents set during the 2022 bear market are instructive. Usually, the total supply in a loss state needed to compress from over 8 million BTC to about 5 million BTC before the market decisively regained the midpoint of the cycle. This means that before the market condition normalizes, about 3 million coins changed hands.
Tracking Ongoing Redistribution
After determining the scale of loss supply needing redistribution, the next step is to monitor the speed of this process. The "Realized Losses of Long-term Holders" metric measures the total losses realized by investors holding for more than six months and now selling below their initial cost basis. This metric directly captures the active redistribution process of the overhead supply mentioned above.
The 30-day moving average of this metric has steadily risen since November 2025, currently standing at about 200 million USD per day. This confirms that long-term holders are increasingly surrendering to the current market. While this wave of loss realization is a necessary and constructive step in the bear market clean-up process, it alone is not sufficient to constitute a reversal condition for the market. If this metric can significantly cool down to below 25 million USD per day, it will represent a more convincing signal of seller fatigue and is a prerequisite for market bottoming before the sustainable bull market begins.
Off-chain Insights
Return of Coinbase Spot Demand
The spot market shows initial signs of stabilization. The 30-day moving average of the transaction volume difference on Coinbase's spot market has turned slightly positive in the latest data. Previously, it experienced prolonged negative values in January and early February, during which the sustained selling pressure reflected ongoing distribution behavior.
The recent shift indicates that as prices stabilize, buyers are beginning to absorb the available supply and provide support. However, the positive difference's magnitude remains mild, indicating that current demand is still tentative and not driven by strong conviction.
Historically, stronger market recoveries require ongoing positive flows of spot funds, and transient buying behaviors often fail to lead to subsequent momentum. Currently, the recent rebound is constructive, but a more sustained recovery may require continuous expansion of buying pressure.
Treasury Fund Flows Become Complex
In recent months, the broad base of treasury fund flows has significantly weakened. The latest data reveals a more imbalanced and selective activity pattern. In the early stages of the cycle, corporate hoarding of coins was supported by a broader array of allocators. However, recent fund flows indicate that buying support is becoming increasingly concentrated.
Most notably, Marathon has sold about 15,000 BTC, which is one of the clearest examples of corporate treasuries reducing rather than increasing exposure. In contrast, Strategy appears to remain the only consistent structural buyer; even as participation from other companies has become more sporadic, this company continues to make regular purchases.
This shift points to a significant change in market structure. Corporate demand is no longer a widespread trend of corporate hoarding; it now seems narrower and more reliant on a single dominant participant. The eventual outcome is that while corporate buying remains, its foundation has become less broad, thus reducing its reliability as a structural support source compared to the early stages of the cycle.
Perpetual Premium Reset
The directional premium in the perpetual contract market continues to compress, with a 30-day total now approaching neutral levels and slightly below zero. This marks a clear cooling of the previously bullish conditions that supported the price rise.
This shift indicates that bullish speculative positions are being closed out, and short interest is beginning to re-emerge. The current structure does not reflect strong market conviction, but points to a more cautious and balanced perpetual contract market landscape.
Historically, the resetting of directional premiums typically occurs alongside consolidation or trend exhaustion. This occurs because leverage is repriced after a prolonged trend. In this sense, the recent decline in premiums indicates that speculative willingness has faded, allowing the perpetual market to complete a thorough reset under weakened leverage conditions.
Volatility Expectations Are Lowering
After the positions in the options market completed their reset, implied volatility is the first area to show changes. The volatility term structure of Bitcoin has moved down overall compared to last week, with the front end leading the decline. The 1-week at-the-money implied volatility is currently at 51%, while the 3-month term is 49%. Implied volatilities for other terms are closely arranged in between, with the 6-month term at 49.8%, indicating a significantly compressed term structure.
This reflects a market that is downgrading its expectations for large fluctuations in the near term, even though there is still uncertainty in the macro context. The longer-term volatilities have relatively stronger support, indicating that uncertainty has not vanished but has been pushed further out in time. In the short term, pricing is shifting towards a more convergent volatility regime, as the market lacks immediate catalysts and demand for options flexibility has waned.
Downside Protection Is Starting to Rebuild
As volatility expectations soften, the skew indicator reveals a shift in position structure towards a more cautious direction. The 25 delta skew (calculated as put options minus call options) indicates that the higher it is, the more the market is pricing in a preference for downside protection. Last week, the 1-week skew reached a monthly high of 22.7% before the pullback, reflecting its sensitivity to immediate price movements. In contrast, longer-term skews continue to rise and remain elevated: 1-month is at 17.4%, and 6-month is at 13.2%.
This differentiation between different terms is telling. While the recent price stabilization has slightly eased short-term hedging demand, the protective options in the mid to long term still have strong buying interest. The market is not aggressively pricing in large fluctuations, but the entire term structure continues to assign more weight to downside risk. This points to a sustained defensive bias rather than merely a temporary reaction to short-term market volatility.
Short-term Gamma Below Market Levels
This more defensive position structure becomes increasingly relevant when it corresponds to market makers' gamma exposure. Negative gamma is currently accumulating below current prices, extending from 68,000 USD down to over 50,000 USD. This means that the market is purchasing put options below the current price and does not anticipate the recent rebound to last too long, forcing market makers to become counter-parties to these trades.
In this mechanism, market makers will have to sell when prices weaken, thereby amplifying downside volatility. As liquidity remains thin after the March 27 contract expiration, the overall market structure appears fragile. Once prices enter that region, they may accelerate downward momentum due to hedging flows, triggering an accelerated sell-off that transforms what could have been gradual changes into more severe repricing, potentially retesting the 60,000 USD level—the low at the time of the sell-off on February 5.
Calm Realized Volatility Masks Vulnerability
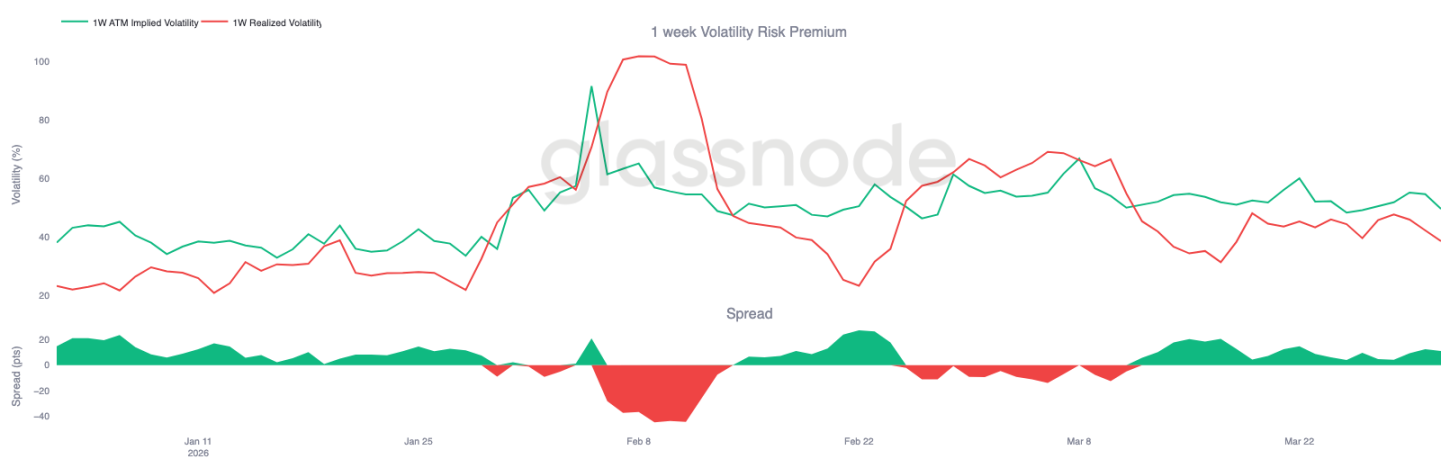
What makes the current situation more unstable is that implied volatility continues to stay above realized volatility. In the front end, the 1-week realized volatility is at 38%, while the 1-week implied volatility is at 49%, resulting in an 11 percentage point gap. This gap has persisted for over three weeks, indicating that the pricing of options remains above the actual market volatility levels.
At first glance, this reflects a seemingly stable market, as realized volatility remains under control. However, the persistent premium suggests that despite the lack of actual price directional follow-through, market participants are still pricing for risk, indicating an environment of low market confidence.
When the volatility pricing exceeds realized volatility and gamma is negative, even relatively small selling pressure can amplify price movements. This is because the market can quickly adjust from a compressed pricing base, while the capacity to absorb fund flows is limited.
Conclusion
Bitcoin remains locked in the wide range of 60,000 to 70,000 USD. The market shows initial signs of stabilization, but lacks sufficient momentum for a decisive breakthrough in either direction. On-chain conditions still reflect that the market is in a repair phase: the volume of supply in a loss state is high, and the surrendering behavior of long-term holders has not fully cooled down. Meanwhile, signs of improvement in spot demand suggest that sellers no longer completely dominate the market.
In the off-chain market, conditions also appear balanced. Corporate fund demand has significantly narrowed, perpetual contract leverage has reset, implied volatility has softened, and the stability of market makers' positions has improved. These signals collectively indicate an environment that is no longer under significant pressure, but still in need of stronger market conviction.
At present, Bitcoin seems to be undergoing a redistribution phase rather than breaking out into a clear trend. Until spot demand expands more significantly and the overhead supply accumulation begins to clear, range-bound fluctuations are expected to remain a primary feature of the market.
免责声明:本文章仅代表作者个人观点,不代表本平台的立场和观点。本文章仅供信息分享,不构成对任何人的任何投资建议。用户与作者之间的任何争议,与本平台无关。如网页中刊载的文章或图片涉及侵权,请提供相关的权利证明和身份证明发送邮件到support@aicoin.com,本平台相关工作人员将会进行核查。


