Author: Ray Dalio
Translated by: Shen Chao TechFlow
Shen Chao's introduction: This article has garnered 75 million views and is the second chapter of Ray Dalio's book "Principles: Life and Work," specifically discussing how to allocate investment portfolios within the framework of large cycles.
Dalio reveals a disturbing fact using real historical data: over the past century, wealth in seven out of ten major countries has been nearly wiped out at least once—yet most investors have never studied this history. At a time when global order friction is intensifying, the reference value of this analytical framework far exceeds that of general macro commentary.
The full text is as follows:
Last week, I shared a chapter from the published 2021 book "Principles: Life and Work," detailing the classic signals and evolutionary processes to pay attention to as the geopolitical order disintegrates in what I call "large cycles." This article was very popular, gathering over 75 million views, and many people inquired about what this means for investments.
Due to the high volume of inquiries, I am now forwarding the next chapter from the book—"Investing within Large Cycles." I believe it offers valuable perspectives on investments at this moment. You can read the complete chapter below.
Additionally, since many have shown an interest in my investment principles, I will continue to share them over the coming weeks. If you would like to receive notification of these releases, please subscribe to my newsletter "Principled Perspectives" or sign up for email alerts.
My approach to life and career is to try to understand how the world works, formulate corresponding principles, and then make my arrangements. The research I share in this book is aimed at that purpose.
Naturally, as I reflect on everything involved thus far, I think about how to apply it to investments. To be sure I’m doing well, I need to understand how my methods would perform historically. If I cannot confidently explain what has happened in the past, or at least have a strategy to deal with uncertainties, I consider that a dangerous oversight.
As my research on the past 500 years has revealed, there exist cycles of significant accumulation and great loss of wealth and power throughout history, with the most significant factors being debt and capital market cycles. From an investor’s perspective, this can be termed as the "larger investment cycle." I believe it is essential to thoroughly understand these cycles in order to tactically shift or diversify investments to hedge against them or to profit from them. By grasping these cycles and ideally judging where countries stand within their cycles, I can achieve this.
Over approximately 50 years of global macro investing, I have discovered many universal truths that transcend time and geography, forming the basis of my investment principles. While I won’t delve into all these principles here, much of them will be discussed in my next book "Principles: Economics and Investing," but I want to convey one important principle.
All markets are primarily driven by four factors: growth, inflation, risk premium, and discount rate.
This is because all investments are essentially an exchange between today’s one-time payment and future payments. Future cash payments are decided by growth and inflation; relative to holding cash, how much risk investors are willing to take is the risk premium; and how much those future payments are worth today, or "present value," is determined by the discount rate.
The changes in these four determinants drive changes in investment returns. Tell me how each of these four factors will evolve, and I can tell you how investments will perform. Understanding this allows me to connect what is happening in the world with what is happening in the markets, and vice versa. It also shows me how to balance my investments so that the portfolio does not lean towards any particular environment, which is precisely the method for achieving good diversification.
Governments influence these factors through fiscal and monetary policy. Therefore, the interaction between what the government expects to happen and what actually happens is the driving force behind cycles. For example, when growth and inflation are too low, central banks create more money and credit growth, generating purchasing power, initially triggering a boost in economic growth, then inflation rises as well (with a lag). When central banks restrict money and credit growth, the opposite occurs: economic growth and inflation both slow down.
What central governments and central banks do to drive market returns and economic conditions is distinct. Central governments decide where their funds come from and where they go because they can tax and spend but cannot create money and credit. The central bank, on the other hand, can create money and credit but cannot decide in which sectors this money and credit will enter the real economy. The actions of both central governments and central banks affect the buying and selling of goods, services, and investment assets, driving their prices up or down.
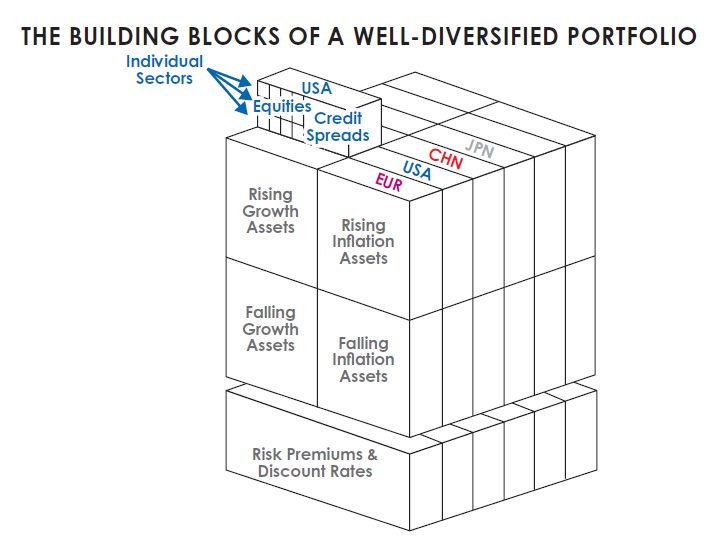
For me, each investment asset reflects these driving factors in its own way, corresponding with the logic regarding its impact on future cash flows. Each investment asset is a component module of the portfolio, and the challenge is to rationally combine the portfolio given these factors.
For instance, when growth is stronger than expected, holding other conditions constant, stock prices may rise; when growth and inflation are higher than expected, bond prices may fall.
My goal is to assemble these modules into a well-diversified portfolio that is tactically tilted according to world events that are impacting these four driving factors. These modules can be segmented by countries, by environmental preferences, all the way down to industries and individual companies. When this concept is applied to a balanced portfolio, the effects are illustrated as shown below. I view historical events, market history, and portfolio behavior through this lens.
I know my methods differ from most investors for two reasons. First, most investors do not look for analogous periods in history because they believe history and past investment returns are largely irrelevant to them. Second, they do not view investment returns from the perspective I just described. I believe these perspectives provide me and Bridgewater with a competitive advantage, but whether or not to adopt them is up to you.
Most investors set their expectations based on their lifetime experiences, and only a few diligent ones will look back in history to see how their decision rules would perform in the 1950s or 1960s. Not a single investor I know, nor one senior economic policymaker I know—of whom I know many, even some of the best—has an outstanding grasp of what has happened in the past and why. Most investors who refer to long-term returns view those of the United States and the United Kingdom (countries that won the First and Second World Wars) as representative data.
This is because not many stock and bond markets have survived since World War II. But these countries and periods are not representative due to survivor bias. To look at the returns of the United States and the United Kingdom is to look at countries that were uniquely fortunate during the best times of the larger cycles. Not looking at what occurred in other countries and prior periods can lead to a distorted perspective.
Starting with the known knowledge of large cycles and reasoning logically, when we extend our vision forward several decades, examining what occurs in different places, we come to a shockingly different perspective. I will demonstrate this because I believe you should understand it.
In the 35 years leading up to 1945, almost all wealth in most countries was destroyed or confiscated, and in some countries, many capitalists were killed or imprisoned when capital markets and capitalism collapsed along with other aspects of the old order, due to anger against them.
If we look back over the past few centuries, we see such extreme cycles of prosperity/decline occurring regularly—after periods of capital and capitalism booms (like the Second Industrial Revolution and the Gilded Age at the end of the 19th century and beginning of the 20th century), there followed transition periods (like the intensifying internal conflicts and the escalation of international wealth and power struggles in the 1900s-1910s), leading to periods of great conflict and economic depression (similar to those that occurred from 1910 to 1945).
We can also see that the causal relationships behind those periods of prosperity and decline today align more closely with the decline and restructuring phases at the end of cycles rather than with the early phases of prosperity and building.
My goal is simply to see and understand what has happened in the past, and then to do my best to show it to you. This is what I am now trying to do. I will start from the year 1350, although the story began long before that.
The Large Cycle of Capitalism and Markets
Before about 1350, charging interest on loans was prohibited by Christianity and Islam—this was also prohibited within the Jewish community in Judaism—because it caused serious problems: human nature led people to borrow debt beyond their capacity to repay, creating tensions between borrowers and lenders, often leading to violence. Without loans, money was "hard currency" (gold and silver). About a century later, during the Age of Exploration, explorers traveled the world collecting gold, silver, and other hard assets to accumulate wealth. This was the way to accumulate the greatest wealth of that time. Explorers and their financiers shared profits, establishing an effective incentive-based system for wealth accumulation.
The alchemy of lending we know today was first created around 1350 in Italy. The rules of lending changed, with the creation of a new type of currency: cash deposits, bonds, and stocks, which are very similar in form to what we know today. Wealth became promises to pay in currency—I call this "financial wealth."
Think of the impact the invention and development of bond and stock markets had. Prior to this, all wealth was tangible. Consider how much more "financial wealth" was created by the establishment of these markets. To imagine this difference, consider: if your cash deposits and bonds and stocks did not exist for future payments, how much "wealth" would you have now? You would have almost nothing, you would feel bankrupt, and you would behave differently—for example, you would accumulate more savings in tangible wealth. This was probably the state of things before cash deposits, bonds, and stocks were created.
With the invention and growth of financial wealth, money was no longer tied to gold and silver. With less constraint on money and credit, as well as purchasing power, it became common practice for entrepreneurs to come up with good ideas and establish businesses, taking loans and/or selling company shares to obtain the needed funds. They were able to do this because promises to pay became represented by entries in the accounting books.
Around 1350, those who could do this—most famously the Medici family from Florence—could create money. If you can create credit—like five times the actual money (which banks can do)—you can generate a lot of purchasing power, so you no longer need as much of other types of money (gold and silver). The creation of this new currency was historically, and continues to be, a form of alchemy. Those who were able to create and use it—bankers, entrepreneurs, and capitalists—became very wealthy and powerful.
This process of expanding financial wealth has continued to this day, and financial wealth has grown so large that hard currency (gold and silver) and other tangible assets (like real estate) have become relatively unimportant. But, of course, the more promises of financial wealth exist, the greater the risk that those promises cannot be fulfilled. This is the cause of the classic large debt/money/economic cycle. Think about how much financial wealth there is relative to actual wealth today, imagine you and others holding financial wealth trying to convert it into real wealth—by selling it and buying something. It would be like a bank run. It cannot happen. The value of bonds and stocks is too high compared to what they can actually buy. But remember, within a fiat currency system, the central bank can print money, providing the necessary currency to meet demand. This is a universal truth across time and geography.
Also remember that paper money and financial assets (like stocks and bonds), which are essentially promises to pay, are not very useful themselves; what is useful is what they can buy.
As discussed in Chapter 3, when credit is created, purchasing power is created along with the promises to pay, thus it has a stimulating effect in the short term and a restraining effect in the long term. This creates cycles. Throughout history, the desire for acquiring currency (either through borrowing or selling stocks) and the desire for storing currency (by investing through borrowing or purchasing stocks) have existed in a symbiotic relationship. This has led to an increase in purchasing power forms, ultimately creating promises to pay greatly exceeding the deliverable quantities, leading to crises of default promises appearing in the forms of debt default depressions and stock market crashes.
At such times, bankers and capitalists were literally and metaphorically hanged, vast wealth and lives were extinguished, and massive quantities of fiat currency (which can be printed and holds no intrinsic value) were printed in attempts to alleviate the crisis.
The Complete Picture of Large Cycles From an Investor's Perspective
While it’s too burdensome for me to walk you through all relevant history from 1350 to now, I will show you what it would look like if you had invested starting in 1900. But before that, I would like to explain how I view risk, as I will emphasize these risks in the next content.
In my view, investment risk is the inability to earn enough money to meet your needs, rather than volatility measured by standard deviation—though the latter is the risk measure almost exclusively used.
For me, the three main risks most investors face are: the portfolio failing to provide the returns needed to meet spending requirements, the portfolio facing destruction, and most of the wealth being confiscated (for example, through high taxes).
While the first two risks may sound similar, they are indeed different because it is possible to have averaged returns exceeding needs while concurrently experiencing one or more catastrophic losses.
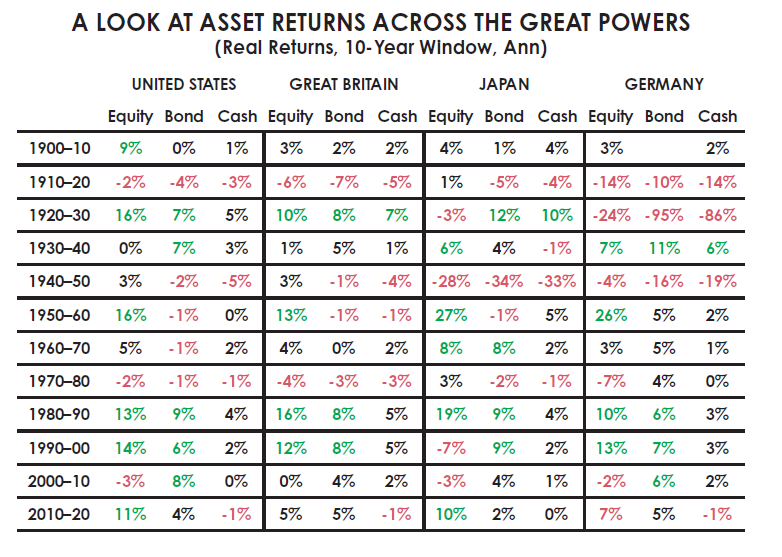
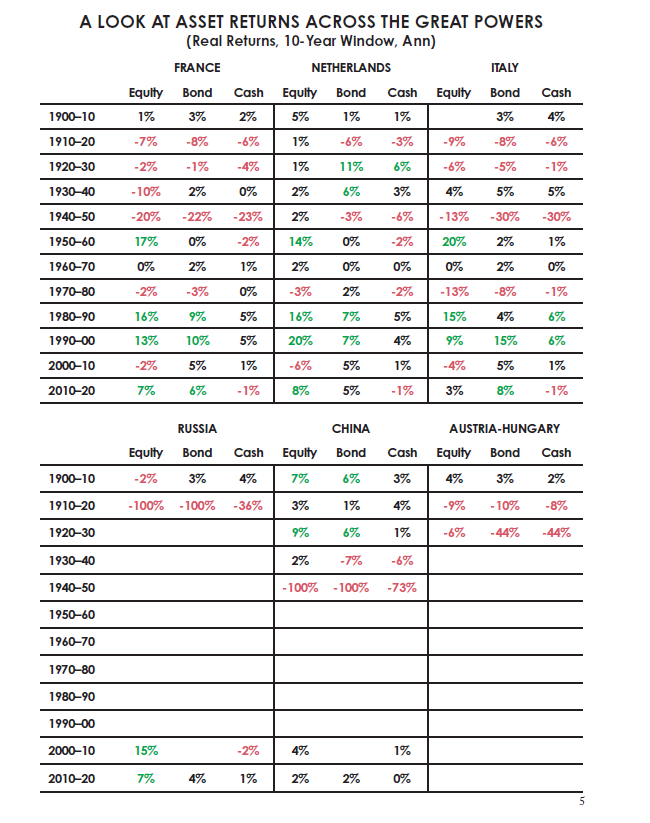
For perspective, I imagine being thrust into 1900, observing my investment situation each decade thereafter. I choose to examine the 10 most powerful countries in 1900, skipping underdeveloped nations where bad outcomes were more likely. In fact, any one of these countries could have been, or could become, a great wealthy empire, making them reasonable places to invest, especially when people aim to own diversified portfolios.
Of the 10 countries, 7 have experienced near-total destruction of wealth at least once, even those nations that did not witness wealth destruction endured decades of terrible asset returns, almost leading them to financial ruin. Two great developed nations—Germany and Japan, which many might easily bet on to become winners—had nearly all their wealth destroyed during the World Wars, and many lives were lost. I see many other countries with similar outcomes. The United States and the United Kingdom (along with a few others) are exceptional cases of success, but even they experienced periods of massive wealth destruction.
If I did not examine returns from that period before the new world order began in 1945, I would not have seen these periods of destruction. If I did not look back over 500 years globally, I wouldn’t recognize that this has recurred almost everywhere.
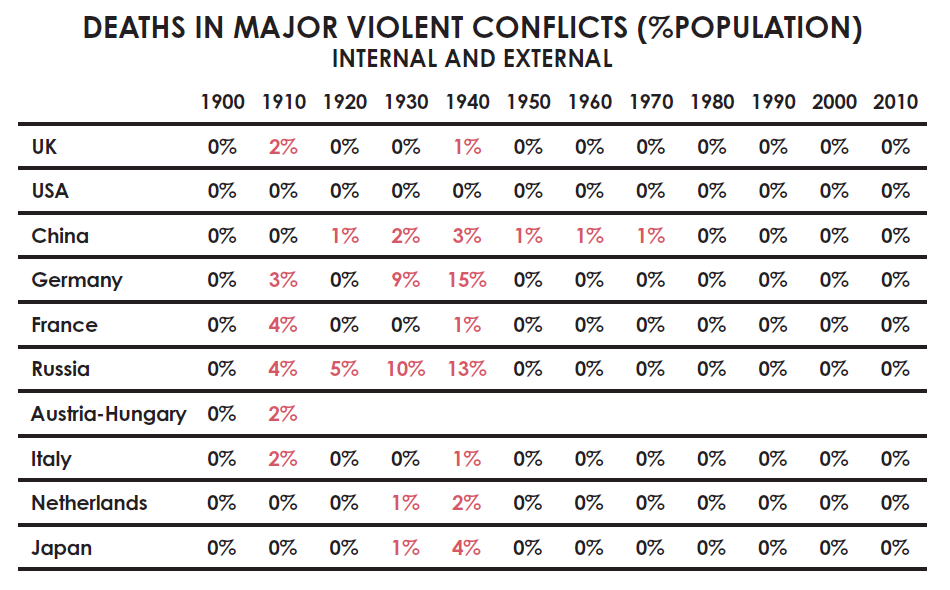
The figures shown in the table below represent the annualized real returns for each decade, which means that losses over the entire decade are approximately eight times the displayed figure, and gains are about fifteen times the displayed figure.
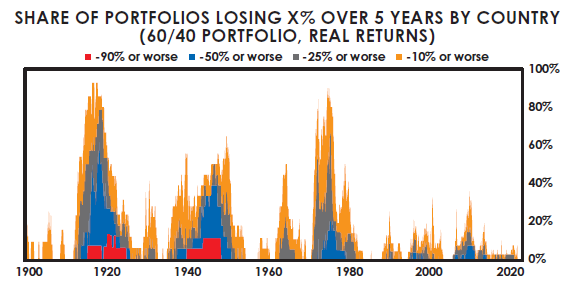
Perhaps the following chart presents a clearer picture, showing the proportion of major countries that suffered losses while holding a 60/40 stock/bond portfolio over a five-year period.
The table below details the worst cases for investments in major countries. You will notice that the United States does not appear on this list, as it is not among the worst cases. The United States, Canada, and Australia are the only countries that did not experience periods of sustained losses.
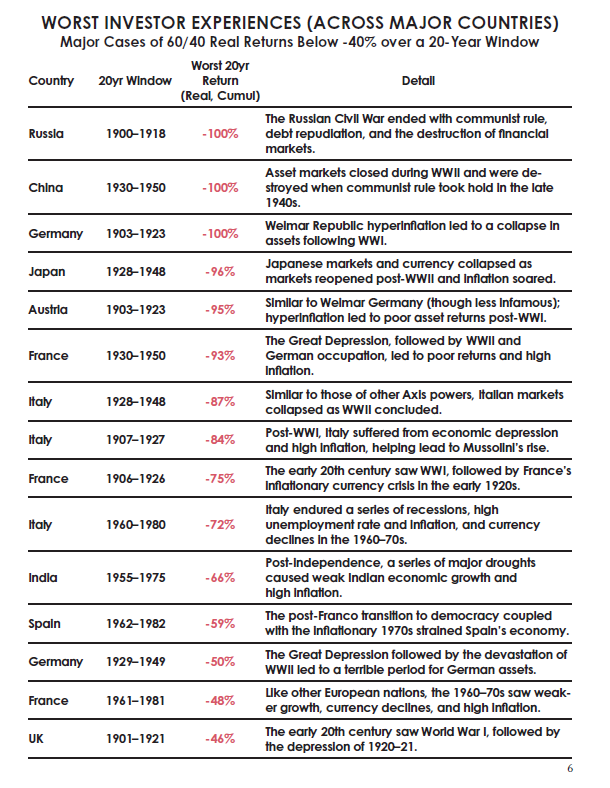
Naturally, I think about how I would respond if I were living through these periods. I can say with certainty that even if I saw signs of the events I relay in this book approaching, I would never be confident of predicting such terrible outcomes—as mentioned, 7 out of 10 countries saw their wealth wiped out. At the dawn of the 20th century, even those reflecting on the previous few decades would never have foreseen this, as there were ample reasons to remain optimistic based on events in the latter half of the 19th century.
Today, people often assume that the First World War should have been easily foreseeable in the years before it, but that was not the case. There had been nearly 50 years of almost no conflict among the major powers of the world before the war broke out. During those 50 years, the world experienced unprecedented levels of innovation and productivity growth, contributing to immense wealth and prosperity.
Globalization reached new heights, with global exports multiplying several times in the 50 years leading up to the First World War. Countries were more interconnected than ever. The United States, France, Germany, Japan, and the Austro-Hungarian Empire were rapidly rising empires experiencing dizzying technological advances. Britain was still the dominant global power. Russia was industrializing rapidly.
Among those nations listed in the worst investor experiences, only China was clearly in recession. The potent alliances between European powers were viewed at the time as a means to maintain peace and preserve power. Coming into 1900, everything looked fine, except that the wealth gap and resentments were worsening, and debt had become excessive. Between 1900 and 1914, these conditions deteriorated, and international tensions escalated. Then came those horrendous periods of returns I just described.
But things were worse than just terrible returns.
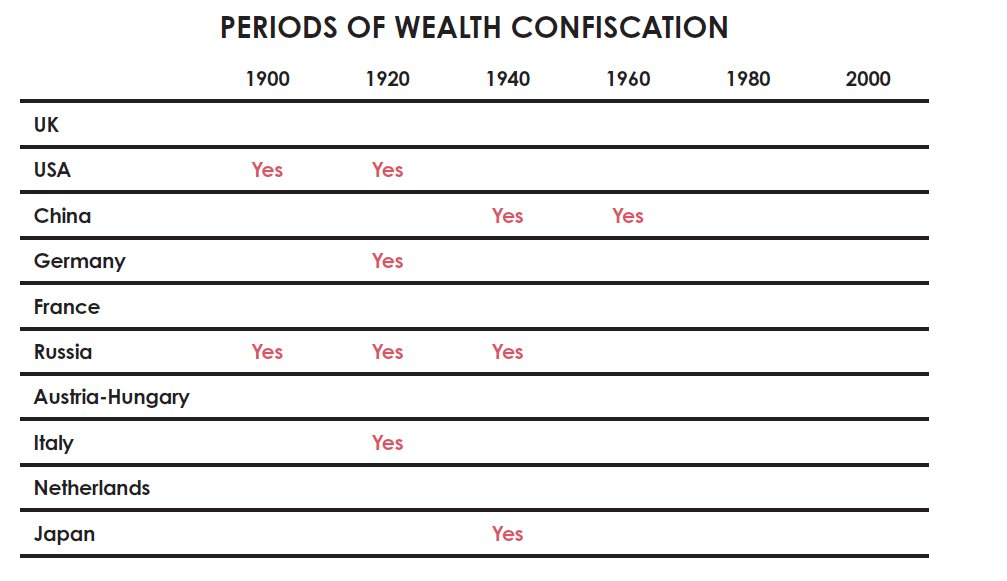
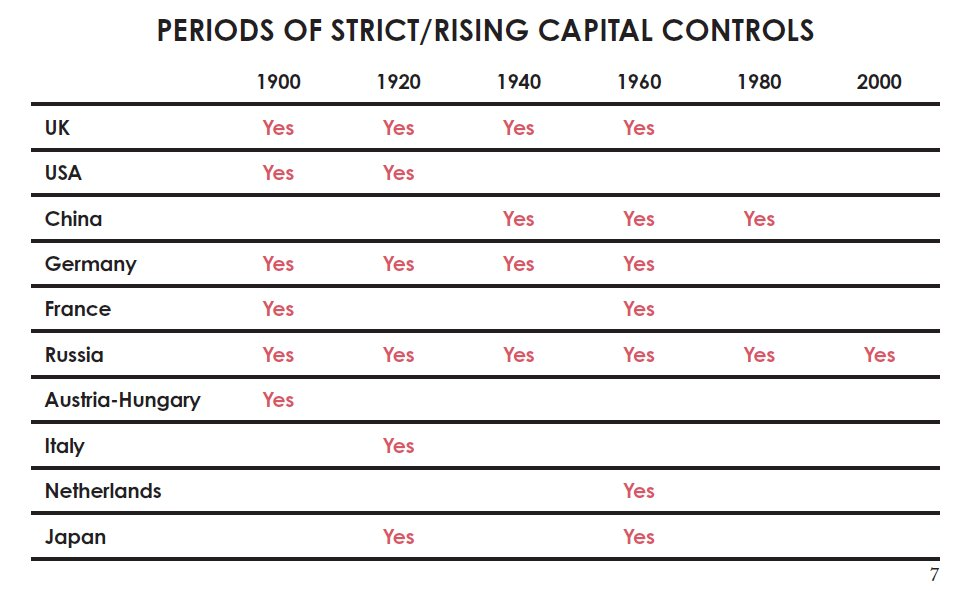
Moreover, the impacts of wealth confiscation, confiscatory taxes, capital controls, and market closures on wealth are enormous. Most investors today are unaware of such things, believing they cannot happen because they do not see these situations reflected in the past few decades. The table below shows in which decades these events occurred. Naturally, the worst cases of wealth confiscation occurred during periods of significant wealth disparity and deteriorating economic conditions, and/or during times of war.
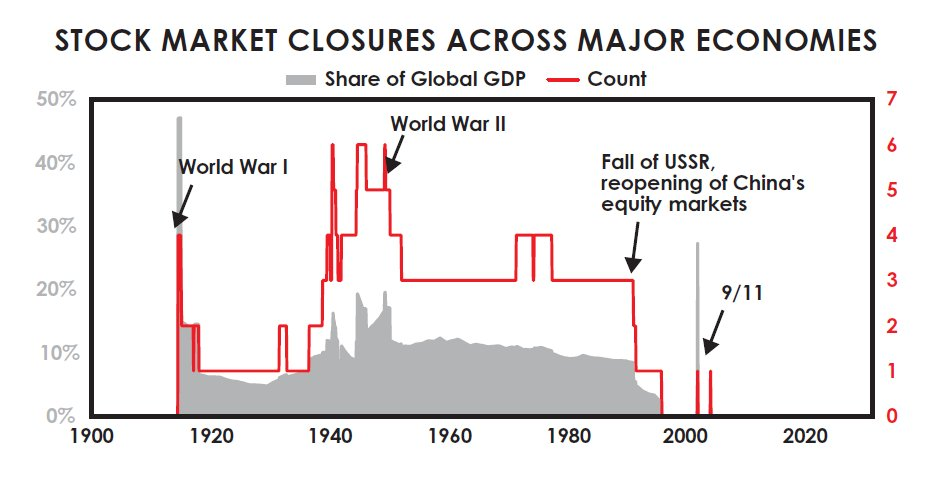
The next chart shows the proportion of major countries' stock markets that were closed over time. It's common for stock markets to close during wartime, and communist nations certainly also closed their stock markets for more than a generation.
The bad parts of all cycles before 1900 were equally bad. Worse yet, these internal and external struggles around wealth and power led to massive deaths.
Even for investors fortunate enough to be in the winning countries (like the United States, which was the biggest winner twice), there are two further impediments: market timing and taxes.
Most investors sell near the lows during bad times because they need money, and they tend to panic; they usually buy near peaks when they have plenty of funds and are attracted by euphoria. This results in their actual returns being worse than the market returns I have shown. A recent study indicated that between 2000 and 2020, U.S. investors underperformed U.S. stocks by about 1.5 percentage points per year.
As for taxes, the table below estimates the average impact of taxes on S&P 500 investors across all 20-year periods (using the average tax rate of the top fifth of earners in today's highest tax brackets). Different columns represent different methods of investing in the U.S. stock market, including tax-deferred retirement accounts (taxed only at the end of the investment) and holding physical stocks in a regular brokerage account with annual reinvestment of dividends.
Although these different implementations have various tax implications (retirement accounts having the least impact), all show significant effects, especially regarding actual returns, where taxes can erode a substantial portion of returns. In any given 20-year period, U.S. investors on average have lost about a quarter of their actual stock returns to taxes.
A Review of the Major Capital Market Cycles
Earlier, I explained how the classic large debt and capital market cycles work. To reiterate: during the ascending phase, debt increases, and financial wealth and obligations rise relative to tangible wealth until these future promises to pay (the value of cash, bonds, and stocks) can no longer be satisfied.
This leads to "bank run" style debt problems and subsequently results in printing money to attempt to alleviate debt defaults and stock market declines, in turn leading to currency devaluation, with financial wealth diminishing relative to actual wealth until the actual (inflation-adjusted) value of financial assets becomes cheap relative to tangible wealth. The cycle then restarts.
This is a very simplified description, but you understand—the actual returns of financial assets are negative relative to actual assets during the descending phase of this cycle, making times difficult. This is the phase of the cycle that is anti-capital, anti-capitalism, lasting until the opposite extreme is reached.
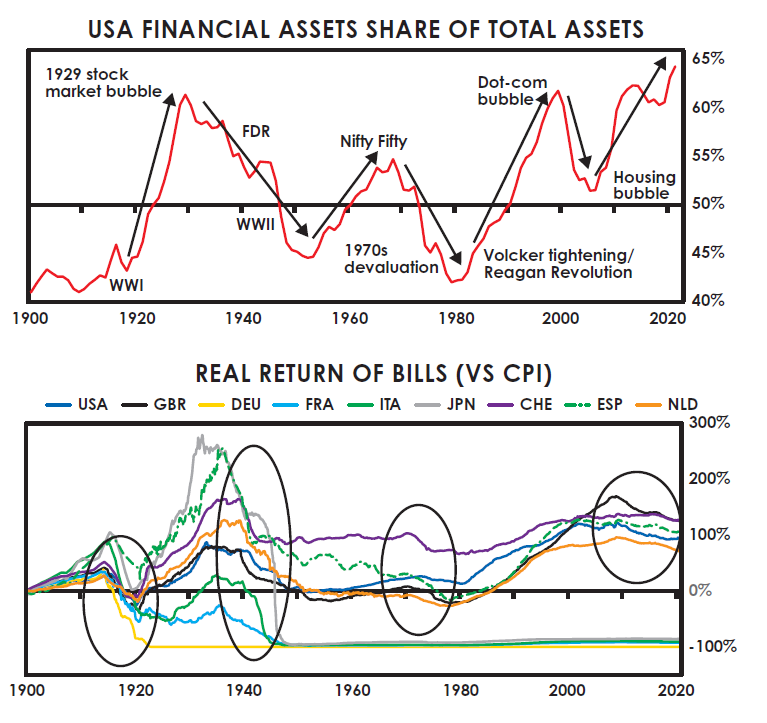
This cycle is reflected in the following two charts. The first shows the total value of financial assets relative to the total value of real assets. The second shows the actual returns of currency (i.e., cash). I use U.S. data rather than global data because they are the most continuous since 1900. As you can see, when the value of financial wealth is high relative to actual wealth, it reverses, leading to poor actual returns for financial wealth (especially cash and debt assets like bonds).
This is because the interest rates and returns for debt holders must remain low and poor to provide relief for heavily indebted borrowers, and to try to stimulate more debt growth to spur economic activity. This is the classic late-stage phase of the long-term debt cycle.
It occurs when more money is printed to lighten the debt burden, and new debt is created to increase purchasing power. This devalues currency relative to other means of storing wealth and to goods and services.
Ultimately, as the value of financial assets decreases until they become cheap relative to actual assets, reaching the opposite extreme and reversing, peace and prosperity return, entering the upward phase of the cycle, where financial assets see excellent actual returns.
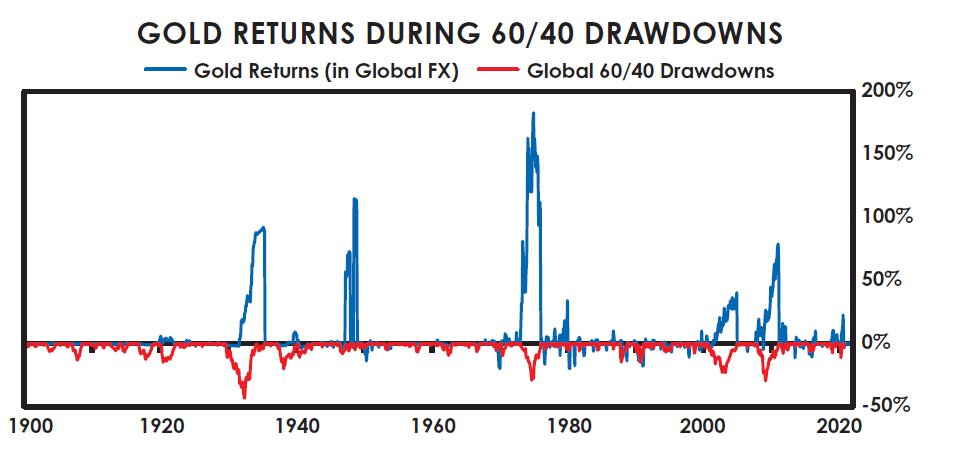
As mentioned earlier, during periods of currency devaluation, the value of hard currencies and hard assets rises relative to cash. For example, the next chart shows that during the periods of decline for the classic 60/40 stock/bond portfolio, it was exactly when gold prices were rising. I am not saying whether gold is a good or bad investment; I am merely describing the economic and market mechanisms, and how they are reflected in past market trends and investment returns, aiming to share my perspective on what has happened, what may happen, and why.
One of the most important questions investors need to regularly ask themselves is: is the interest paid sufficient to compensate for the risk of devaluation they face?
The classic large debt/money/capital market cycles, which have repeated throughout history globally, are illustrated in the charts I just displayed, manifesting as
1) the relative value of physical/tangible currencies and physical/tangible wealth, and
2) the relative value of financial currencies and financial wealth. Financial currencies and financial wealth are valuable only when they can be exchanged for real currencies and real wealth that have intrinsic value.
These cycles operate this way: during the rising phase, the quantity of financial currencies and financial wealth (i.e., created debt and equity assets) increases relative to the quantity of physical currencies and physical wealth they represent.
The increase is due to:
a) Capitalists engaging in creating and selling financial assets find it profitable;
b) Increasing money, credit, and other capital market assets is an effective way for policymakers to create prosperity because it funds demand;
c) When the book value of financial investments rises due to the declining values of currency and debt assets, it creates the illusion of wealth for people. Thus, central governments and central banks have historically created financial claims that far exceed what can be exchanged for real wealth and real currencies.
In the ascending phase of the cycle, as interest rates decrease, stocks, bonds, and other investment assets rise, because lower interest rates, all else being equal, push up asset prices. Simultaneously, injecting more money into the system increases demand for financial assets and reduces risk premiums.
As these investments rise due to declining interest rates and more money within the system, they appear increasingly attractive at the same time as the interest rates on financial assets and their future expected returns decline.
The more unmet claims there are relative to the assets sought, the greater the risk. This should be compensated by higher interest rates, but it often isn't, because conditions appear good at those times, and people's memories of debt and capital market crashes fade.
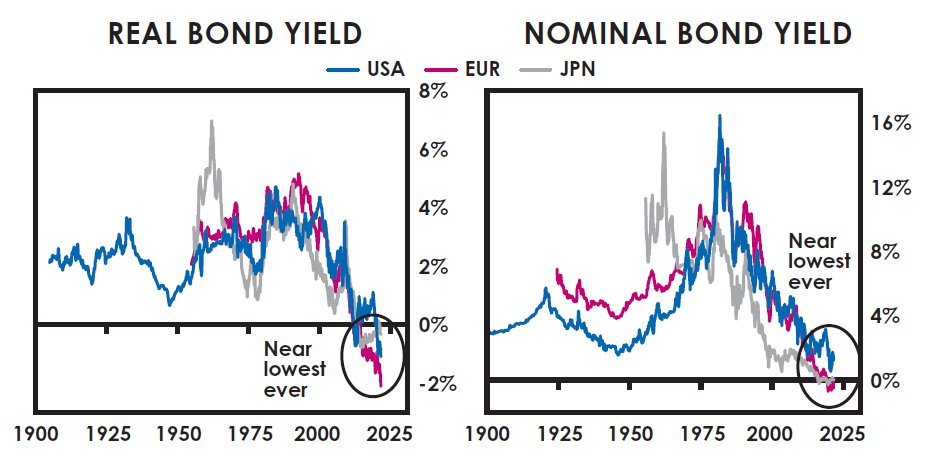
The charts I presented to convey the cycles, without including some interest rate charts, cannot paint a complete picture. Interest rates are shown in the next four charts, which trace back to 1900. (Note: This chapter was first published in 2021, and the following charts contain data only up to that year.)
They show the real (i.e., inflation-adjusted) bond yields in the United States, Europe, and Japan at the time of my writing, the nominal (i.e., unadjusted for inflation) bond yields, and both nominal and real cash interest rates. As you can see, they were much higher in the past and are very low today.
At the time of writing, the real yields on sovereign bonds of reserve currencies are close to the lowest ever recorded, with nominal bond yields around 0%, also near all-time lows. As displayed, real returns on cash are even lower, although they are not as negative as during the massive printing periods of 1930-45 and 1915-20. Nominal cash yields are also close to historical lows.
What does this mean for investments? The purpose of investing is to store money in a means of wealth storage so that it can be converted back into purchasing power later. When people invest, they are exchanging a one-time payment for future payments.
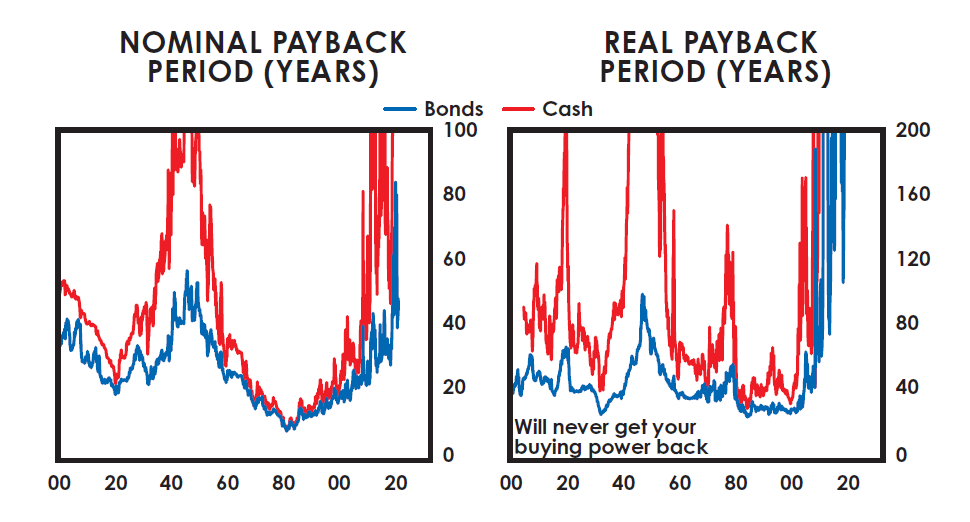
Let’s take a look at what this exchange looks like as of my writing. If you give $100 today, how many years will you need to wait to get your $100 back before beginning to earn a return on the funds you’ve provided? In bonds from the United States, Japan, China, and Europe, you may have to wait approximately 45 years, 150 years, and 30 years to get your money back (likely returning low or zero nominal returns), while in Europe, given the negative nominal interest rate, you likely may never get your money back.
However, since you are attempting to store purchasing power, you must consider inflation. At the time of writing, in the United States and Europe, you may never be able to recoup your purchasing power (in Japan it would take over 250 years). In fact, in those countries with negative real interest rates, you are almost certainly going to have significantly less purchasing power in the future.
Why not buy something—anything—whose value equals or exceeds inflation, rather than receive returns below inflation? I see many investments that I expect to significantly outperform inflation. The chart below shows the recovery period for holding cash and bonds in the United States, represented in both nominal and real terms. As shown, this is the longest ever recorded, clearly a ridiculous period.
Conclusion
What I have shown you here is the large cycles viewed from the investor's perspective since 1900. In looking back over 500 years of global history, as well as 1,400 years of Chinese history, I see the same fundamental cycles repeating for fundamentally the same reasons.
As discussed earlier in the book, the terrible periods in those years before the establishment of the new world order in 1945 are typical late-stage characteristics of the transition phases of the larger cycles, during which revolutionary changes and restructuring were occurring. While they were dreadful, they were far better than the astonishing periods of growth that followed the painful transitions from the old order to the new order. Because these things have happened many times before, and I cannot know what will happen in the future, I cannot invest without taking precautions against these events happening and protecting myself against misjudgment.
Footnotes
[1] The discount rate is the rate used to assess the present value of a future amount of money. It is calculated by comparing how much money invested at that rate (i.e., the discount rate) would equal a specific amount at a certain time in the future.
[2] If the government and its system collapse, non-government-led forces will take over—a story I won’t delve into now.
[3] You can see this alchemy at work in today's digital currencies.
[4] When compounding over a decade, gains outpace losses since you're constantly accumulating based on gains; whereas, when you experience losses and approach zero, future percentage losses impact in dollar terms become progressively smaller. The comparison of annualized gains versus losses represents compounded growth at an average of 10% annual gain and -5% annual loss. During more extreme changes, the multipliers start to change from there.
[5] For China and Russia, the bond data before 1950 uses modeling based on hard currency bond returns, assumed to be hedged back into local currency by domestic investors; stocks and bonds are modeled as completely defaulting during revolutions. Annualized returns assume a complete 10-year period, even if the market closed within that decade.
[6] The poorer asset return cases of smaller countries such as Belgium, Greece, New Zealand, Norway, Sweden, Switzerland, and emerging markets are not included here. Note that, for brevity's sake, what is displayed is the worst 20-year window for each country/period (i.e., including Germany from 1903-23 would exclude Germany from 1915-35). For our 60/40 portfolio, we assume monthly rebalancing within the 20-year window.
[7] While this chart is not exhaustive, I’ve listed instances where clear evidence can be found for every event occurring within the 20-year period. In this analysis, wealth confiscation is defined as large-scale confiscation of private assets, including non-market-based forced sales conducted at scale by the government (or revolutionaries in revolutionary contexts). Related capital controls are defined as meaningful restrictions on investors moving capital in or out of other countries and assets (this does not include targeted measures aimed solely at a single country, such as sanctions).
[8] The tax impact of the 401(k) method is calculated at the end of each 20-year investment period (tax-free investment growth) using a 26% income tax rate (from the Congressional Budget Office's 2017 average effective federal tax rate for the top fifth). The brokerage account method taxes dividends separately (also at a 26% income tax rate) and taxes all capital gains on principal and reinvested dividends at the end of each 20-year investment period at 20% tax rate, offsetting any gains with losses.
[9] Based on the nominal bond yield levels in 2021 from 30-year bonds (viewed as perpetual annuities).
免责声明:本文章仅代表作者个人观点,不代表本平台的立场和观点。本文章仅供信息分享,不构成对任何人的任何投资建议。用户与作者之间的任何争议,与本平台无关。如网页中刊载的文章或图片涉及侵权,请提供相关的权利证明和身份证明发送邮件到support@aicoin.com,本平台相关工作人员将会进行核查。


