Source: Jianwei Zhizhu Chat
J.P. Morgan Global Market Strategy: What Signals Are Commodities Sending Us? February 5, 2026
The chaotic start to February raises a question: Is the volatility in the commodity markets a harbinger of future trends, or merely an adjustment?
We believe this is a healthy adjustment rather than a trend reversal, providing a buying opportunity for metals, while we expect further declines in the energy sector.
Despite a recovering global growth and a shift in manufacturing activity supporting demand, the divergence between energy and metals primarily stems from different supply dynamics.
From gold and silver to copper and Bitcoin, all commodity prices plummeted last Friday, marking the most significant market turmoil since last November. Gold experienced its most severe single-day drop since 1983, falling over 9%, while silver crashed 26%, setting a record for the largest single-day decline. Grain and livestock futures also collapsed due to the turmoil in the precious metals market.
The sell-off continued into Monday, putting pressure on the energy market: global natural gas prices collapsed, and oil prices recorded their largest drop in six months. Following increased margin requirements on exchanges in the U.S. and China, the sell-off in precious metals accelerated, compounded by a wave of seasonal selling ahead of the Lunar New Year.
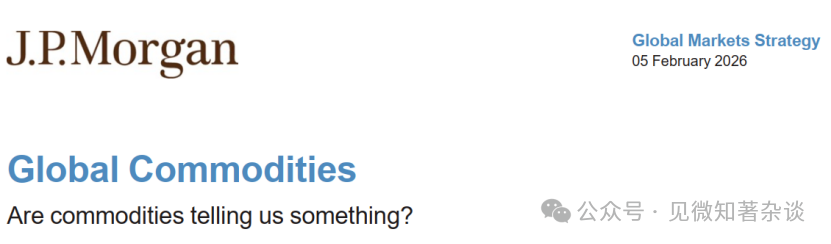
Overall, commodities lost nearly 8% in a brutal three-day plunge, with U.S. natural gas prices plummeting 57%, silver down 33%, gold down 13%, and both copper and oil down 7%. This extreme volatility persisted into midweek, with prices falling again after a rebound due to choppy trading (Figures 1 and 2). The decline in commodities dragged U.S. stock index futures lower, while Asian markets faced their worst two-day drop since last April.
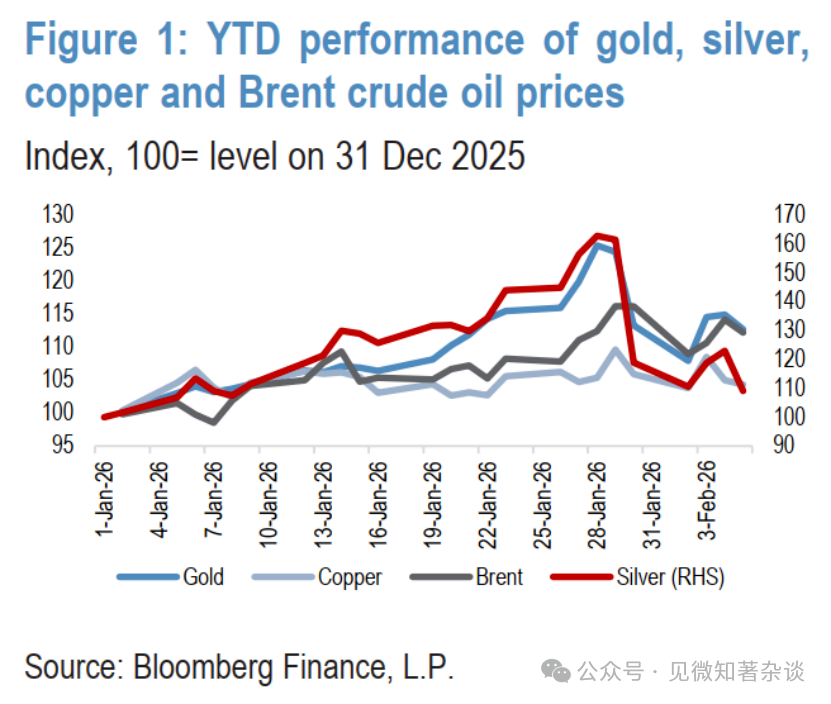
Figure 1: Year-to-date performance of gold, silver, Shanghai copper, and Brent crude oil prices
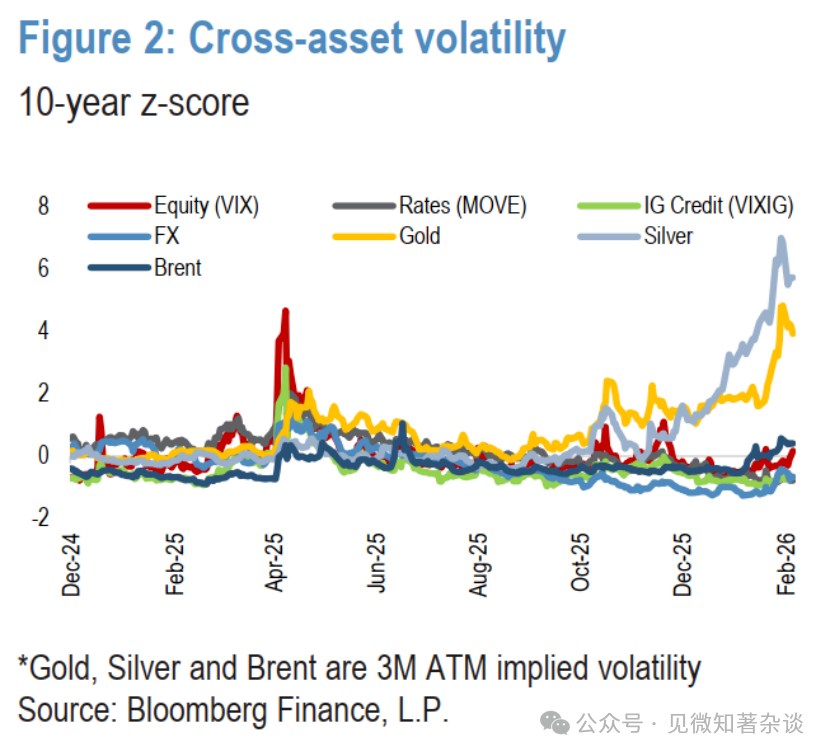
Figure 2: Cross-asset volatility 10-year z-score
This week's chaotic start raises a question: Is the sell-off in commodities a harbinger of future trends, or merely an adjustment?
We believe this is not a turning point but a healthy adjustment, presenting a buying opportunity for metals, while energy will see more selling.
1. The First Argument Centers on Global Growth Recovery
Since the fourth quarter of last year, there has been a noticeable pro-cyclical rotation in global markets, reflected in metals, stocks, and foreign exchange markets. This recovery is a direct result of the following factors:
Less restrictive monetary policy in developed countries (Figure 3)
Expansionary fiscal policies in most major economies. In the U.S., the Congressional Budget Office predicts that legislative measures like the "Bundle of Good Bills" will boost U.S. growth by 0.9%. Expansionary fiscal policy is not unique to the U.S. The International Monetary Fund estimates that fiscal measures will drive growth in Germany by 1% and in Japan by 0.5% in 2026. Ultimately, fiscal policy in the G3 economies will be highly expansionary in the coming quarters.
With the headwinds from trade wars and immigration restrictions fading, there are significant upward catalysts for U.S. growth and inflation. Strong spending on artificial intelligence and data centers, along with high AI stock prices, is boosting consumer wealth effects. Additional tailwinds include a weaker dollar and (until recently) falling oil prices, as well as economic stimulus from hosting the World Cup and events related to the 250th anniversary of the founding of the United States.
The "Bundle of Good Bills" further supports the outlook by cutting overtime and consumption taxes, increasing child tax credits, and extending full expensing for equipment and plants, which are increasing household tax refunds and driving a capital spending boom (Figure 4).
Figure 3: Official policy rates in developed countries
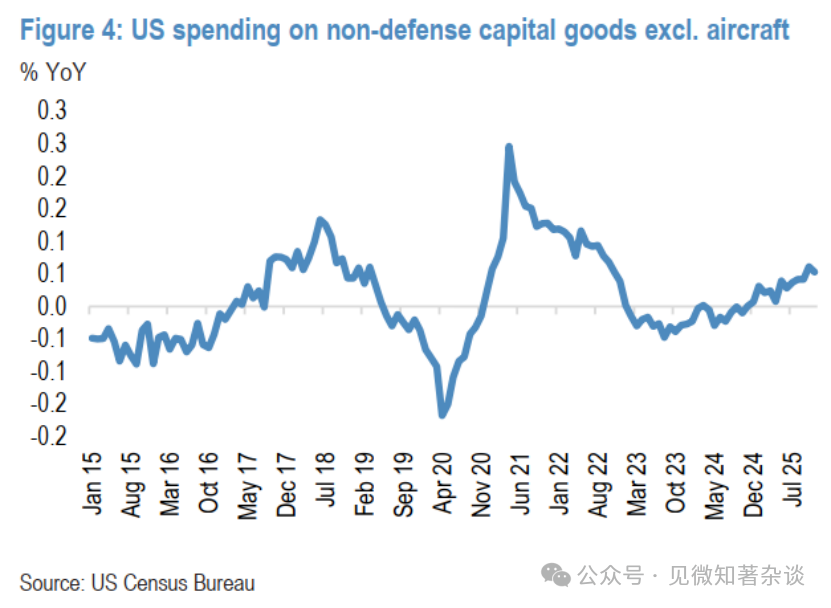
Figure 4: U.S. non-defense capital goods (excluding aircraft) spending
2. Global Manufacturing Activity is Shifting
Recent PMI data confirms that, supported by global monetary easing and a surge in technology investment, a rebound in global growth is underway and expanding, with an encouraging increase in the number of economies reporting higher output. In developed markets, the U.S. recorded its strongest ISM manufacturing data since August 2022, Japan showed significant improvement, and Western Europe also strengthened noticeably. While China's output PMI remained largely unchanged, emerging Asia, excluding China, saw a substantial increase. Overall, the global PMI is running at a solid, above-trend pace, with an increase in new orders providing constructive signals for the sustainability of the recovery.
3. Given the Reassessment of Global Growth, the Re-inflation Trade for 2026 Has Begun, with Commodities, Materials, and Industrial Stocks Performing Well
Based on the historical relationship between copper prices and global manufacturing PMI over the past fifteen years, the recent rise in copper prices suggests PMI readings close to 53—well above the latest figure of about 50.5, and more optimistic than any other cyclical sensitive market we track. While the year-on-year performance of copper may exaggerate the market's pro-cyclical optimism, there is also a clear degree of optimism in other markets. For example, a simulated basket of semiconductor stocks (which has shown similar explanatory power during the same period, with an R-squared of about 0.42) suggests that PMI will rise to around 52 by the end of Q1 2026. The sustained bullish trend of this stock basket after breaking out of a multi-year range indicates that, despite the recent short-term reversal in metals, the pro-cyclical component of the market trend remains strong (Figures 5 and 6).
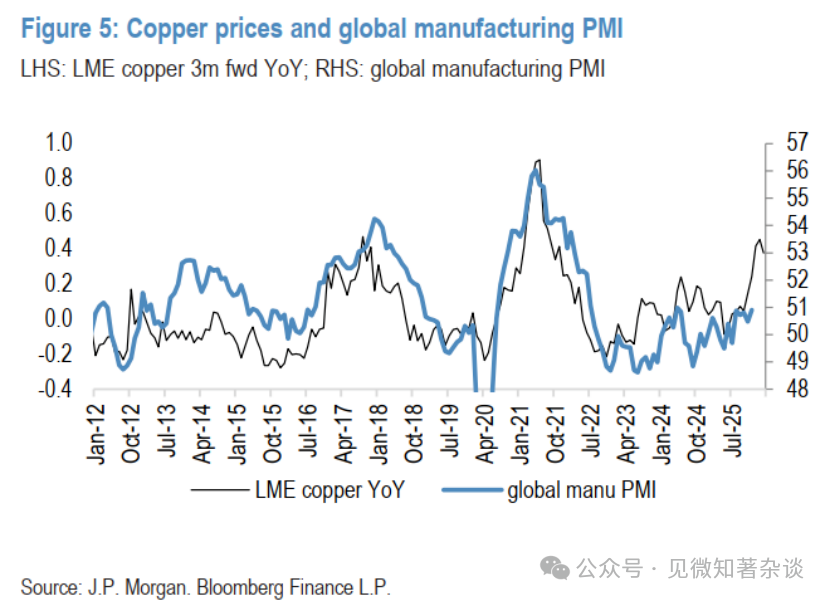
Figure 5: Copper prices vs. global manufacturing PMI
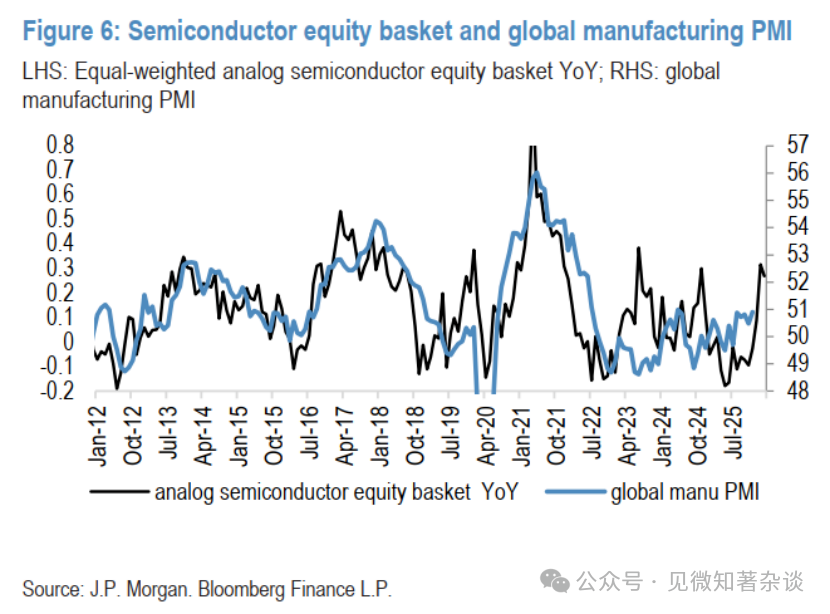
Figure 6: Semiconductor stock basket vs. global manufacturing PMI
4. However, the Similarities Within Commodities End Here
The sharp correction in precious metal prices last week was triggered by a rebound in the dollar (following Kevin Warsh's nomination as the next Federal Reserve Chair), but the severity of the pullback was more due to the rapid liquidation of large long positions that had been quickly built up after the unsustainable acceleration and overextension of prices in the previous two weeks. In short, prices had moved too far, too fast, and short-term momentum indicators surged to rare levels in the precious metals market.
In contrast, the 11% rise in Bloomberg energy prices since the beginning of the year has been driven by temporary factors such as weather and geopolitical escalations. Massive winter storms and freezing temperatures in parts of the U.S. led to production disruptions and boosted demand for heating fuels, while cold weather in Europe disrupted oil loading and depleted natural gas inventories. However, the most significant impact on oil prices has been the escalation of tensions with Iran, and given that this year is a midterm election year in the U.S., we expect this impact to be short-lived.
Through the current volatility, we remain bullish on gold and copper while maintaining a bearish outlook on energy prices—this divergence is primarily driven by different supply dynamics.
5. Maintain a Bullish Outlook on Gold; The Fundamental Peak for Copper is Still Ahead
We maintain a bullish outlook on gold. As we have seen over the past six months, this long-term rise in gold is not linear, and the future will not be linear either; we still view such pullbacks as healthy and necessary, not a challenge to our structural bullish view. In fact, as gold remains a dynamic, multifaceted portfolio hedge with a clear structural story, we have already seen physical buying on dips.
In addition to recent support from retail investors, we continue to expect central banks to remain steadfast, becoming significant buyers on dips. We now forecast that official net purchases will reach 800 tons of gold this year, still 70% higher than levels before 2022 (Figure 7).
Overall, we continue to see room for the diversification trend in gold, as we expect that in an environment where physical assets continue to outperform paper assets, demand from central banks and investors this year will be sufficient to ultimately drive gold prices to $6,300 per ounce by the end of 2026 (Figure 8).
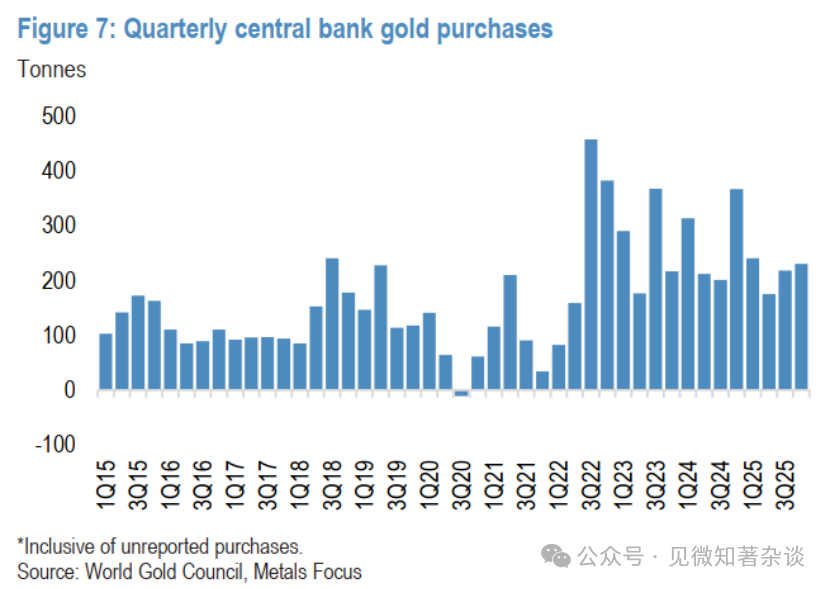
Figure 7: Quarterly gold purchases by central banks
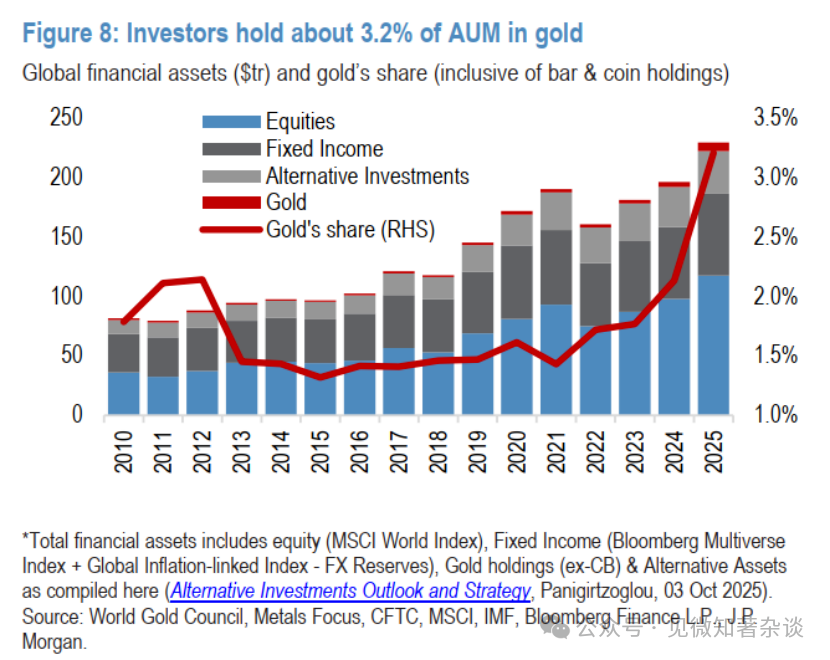
Figure 8: Investors hold about 3.2% of AUM in gold
We are more cautious on silver due to the short-term risk of two-way over-adjustment.
Silver is a smaller, more volatile market than gold and lacks central banks as structural buyers on dips, raising our concerns about the potential for deeper washouts in the short term. Thursday's price action (with silver down about 10% on the day at the time of writing) clearly illustrates this risk. While we do not believe that gold and silver prices will completely decouple or de-correlate in the medium term, we do believe that the currently relatively high valuation of silver compared to gold faces a greater risk of correction on days when the precious metals sector is under pressure.
Nevertheless, while we believe that re-entering silver requires more caution compared to the clearer picture with gold, we still see a high bottom for silver in the short term (around $75-80 per ounce in the coming quarters), and prices are expected to eventually rise to an average of about $90 per ounce by early next year, as silver is unlikely to completely give up its gains and decouple from its sister metal, even after previously overshooting in its chase of gold.
Buying on dips currently supports copper prices; the fundamental peak is still brewing.
Copper has also been caught up in the recent metal frenzy, briefly breaking above $14,000 per ton last week before retreating along with other commodities in the sector. While the current weak fundamentals do not support the previous surge, we still believe there is significant potential for a widening dislocation in the copper market, leading to a more bullish outlook in the coming months (Figure 9).
We still believe that the Trump administration is most likely to implement phased tariffs on refined copper imports, with intentions announced around mid-year and tariffs taking effect in January 2027. This, in turn, will reopen the COMEX/LME arbitrage window, attracting a significant amount of copper imports back to the U.S.
Additionally, we believe that the weakness in Chinese demand over the past few months is primarily due to demand delays (waiting for prices to fall) rather than a more concerning structural slowdown in China's end consumption. We anticipate a scenario where Chinese consumers may ultimately need to accept higher prices later this year to attract the required copper back domestically.
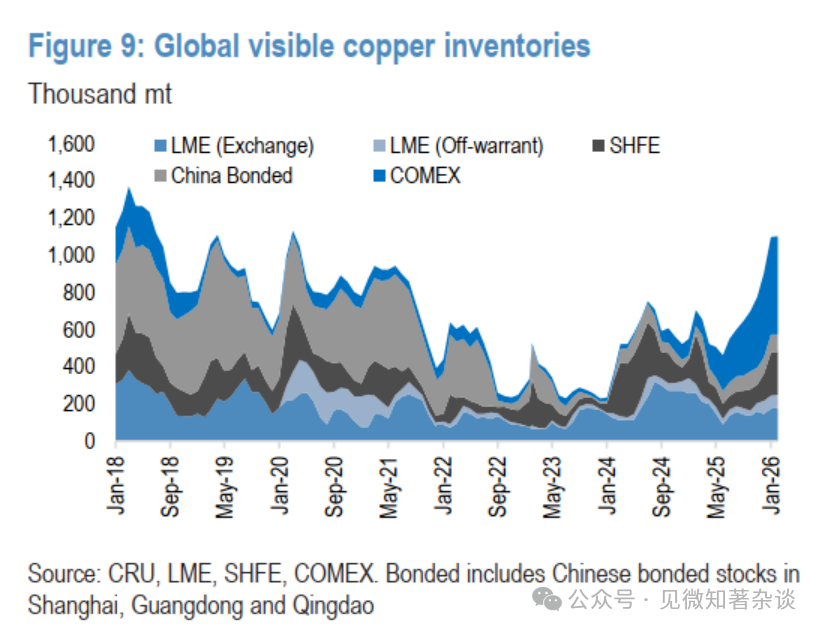
Figure 9: Global Visible Copper Inventory

Figure 10: Weekly Returns of LME Three-Month Copper Under Different LME Registered Warehouse Environments
The joint demand potential from the U.S. and China around mid-year continues to tilt the risk towards LME copper inventories dropping to extremely low levels later this year, which could drive spot prices sharply higher, far exceeding our baseline quarterly average price of $12,500 per ton in Q2 2025, and potentially moving towards $15,000 per ton and above as the LME curve enters deep spot premiums (Figure 10).
Meanwhile, given this risk, heightened concerns over supply security, and the necessity of copper and other key minerals for supply chains, as well as a broader pro-cyclical investor preference, the willingness to buy copper on dips remains substantial, currently establishing a floor around $12,500 per ton.
6. Oil Prices Include a $7 Geopolitical Premium and Should Revert to Fair Value
Severe weather has reduced supply and increased oil demand, adding about $2 per barrel to oil prices in the last week of January. Production in Kazakhstan and the U.S. can now fully recover within days, and Russian export volumes are also nearing normal levels. However, oil prices remain about $7 per barrel above fair value, a premium almost entirely attributed to the escalation of tensions between Washington and Tehran (January 29, 2026) (Figure 11).
After weeks of confrontation (including the U.S. military shooting down an Iranian drone near a U.S. aircraft carrier and Iranian naval harassment of commercial vessels), both sides agreed to resume indirect talks in Oman on Friday. Iran insists that discussions should be strictly limited to nuclear issues, while the U.S. pushes for a broader agenda involving restrictions on Tehran's ballistic missile arsenal, ending its support for regional proxies, and addressing its treatment of its people.
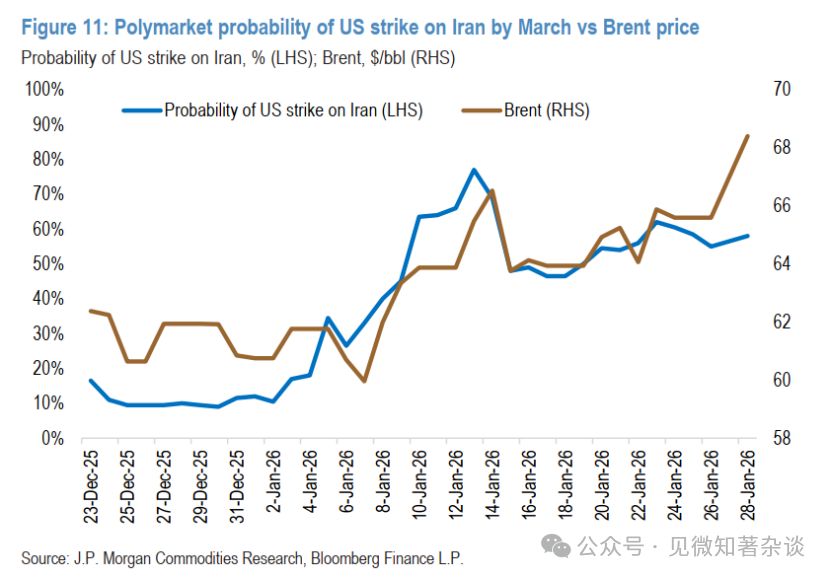
Figure 11: Polymarket's Probability of U.S. Strikes on Iran Before March vs. Brent Oil Prices
President Trump has issued a blunt warning to Iranian leadership and deployed significant U.S. forces to the region, raising concerns about escalation, although Gulf states and other regional powers urge diplomacy and warn against war. Iranian leadership is grappling with severe domestic economic and social crises and appears willing to engage in "fair and just" negotiations, but core differences remain.
Considering high U.S. inflation and this year's midterm elections, we expect this confrontation will not lead to lasting oil supply disruptions. If military action does occur, we anticipate it will be targeted, avoiding Iran's oil production and export infrastructure. Given the region's proximity to major energy transport chokepoints, a brief geopolitical-driven spike in crude oil prices may persist, but these should ultimately fade, leaving a weak underlying global market fundamental.
We forecast strong demand growth this year, but expect global supply growth to be three times that of demand, with half of the supply growth coming from non-OPEC+ producers—driven by robust offshore development and ongoing momentum in global shale gas.
7. Natural Gas—It’s a Cold Winter (and Position Adjustments)
In January, a perfect storm hit the global natural gas market, causing gas prices to go on a rollercoaster ride. The month was characterized by rapidly changing weather forecasts, coupled with historically low inventory levels and position adjustments by European investors, further accelerating price volatility. The February TTF contract settled at €40.1 per megawatt-hour—up 40% from January and nearly 50% from a recent low on December 16, 2025. Meanwhile, the February Henry Hub contract settled at $7.46 per million British thermal units, more than doubling in just seven trading days to reach levels not seen since 2022.
European gas prices surged to a one-year high, a result of cold weather, depleted inventories, and market positioning. TTF prices had previously hit a recent low in mid-December, as the market anticipated another warmer-than-normal winter, and optimism about new LNG supplies in 2026 led to what we believe was a complacent market sentiment. This sentiment was reflected in investor behavior: positions turned net short for the first time since March 2024, with short positions increasing throughout December to -93 million megawatt-hours, the lowest level since 2020.
However, as weather patterns became unstable, the anticipated heating degree days for January began to rise from the second week of the month, shifting the narrative (Figure 12). TTF prices surged sharply due to extremely low inventories and rising demand for gas for heating and power generation (see "Baby, It’s (Still) Cold Outside," January 13, 2026). Prices stabilized around €40 per megawatt-hour, supported by prolonged cold waves in the U.S. and concerns over U.S. LNG supply disruptions due to freezing shutdowns, surging domestic demand, and severe storms. As weather outlooks across the Atlantic returned to normal, the March TTF contract fell from €39.3 per megawatt-hour on January 30 to about €33 per megawatt-hour on February 3 (Figure 13).
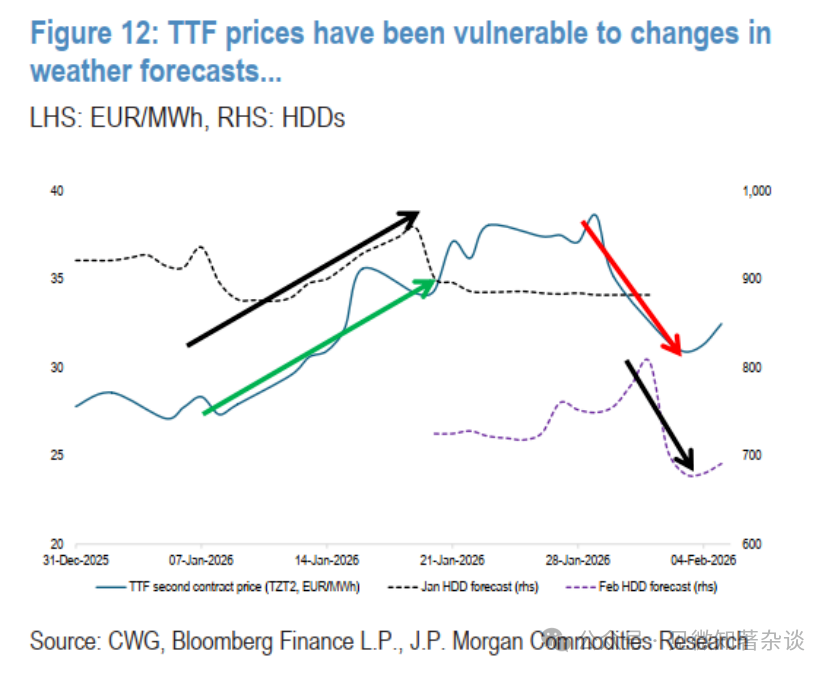
Figure 12: TTF Prices Are Sensitive to Changes in Weather Forecasts…
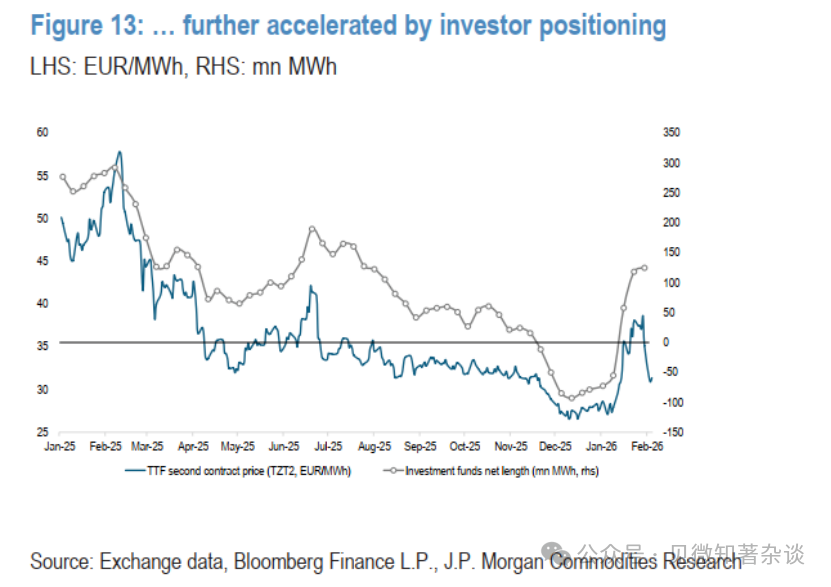
Figure 13: …and Accelerated by Investor Position Adjustments
U.S. natural gas joined the upward trend later in the month as cold waves swept across the country. Prices were relatively low at the beginning of the year, with February contracts trading below $4 per million British thermal units, and hitting $3.10 on January 16, before surging sharply to settle at $7.46 on January 28. During this period, January HDD forecasts rose significantly from about 900 HDDs to 985 HDDs, exceeding the 10-year average of 891 HDDs and the 30-year average of 933 HDDs. Cold weather expectations also extended into February, with forecasts rising from 771 HDDs on January 19 to a peak of 840 HDDs on January 30.
However, this week, weather forecasts changed significantly, shifting towards warmer conditions. In response, prices sharply corrected lower, with March contracts falling from $4.03 per million British thermal units on January 30 to $3.25 per million British thermal units at the time of writing (Figure 14).
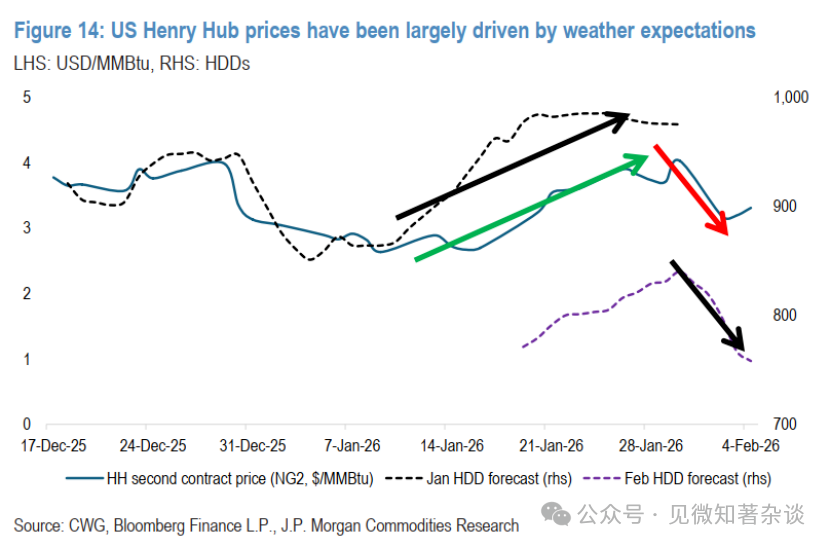
Figure 14: U.S. Henry Hub Prices Driven Mainly by Weather Expectations
免责声明:本文章仅代表作者个人观点,不代表本平台的立场和观点。本文章仅供信息分享,不构成对任何人的任何投资建议。用户与作者之间的任何争议,与本平台无关。如网页中刊载的文章或图片涉及侵权,请提供相关的权利证明和身份证明发送邮件到support@aicoin.com,本平台相关工作人员将会进行核查。


