1. Overall Trend of Bitcoin
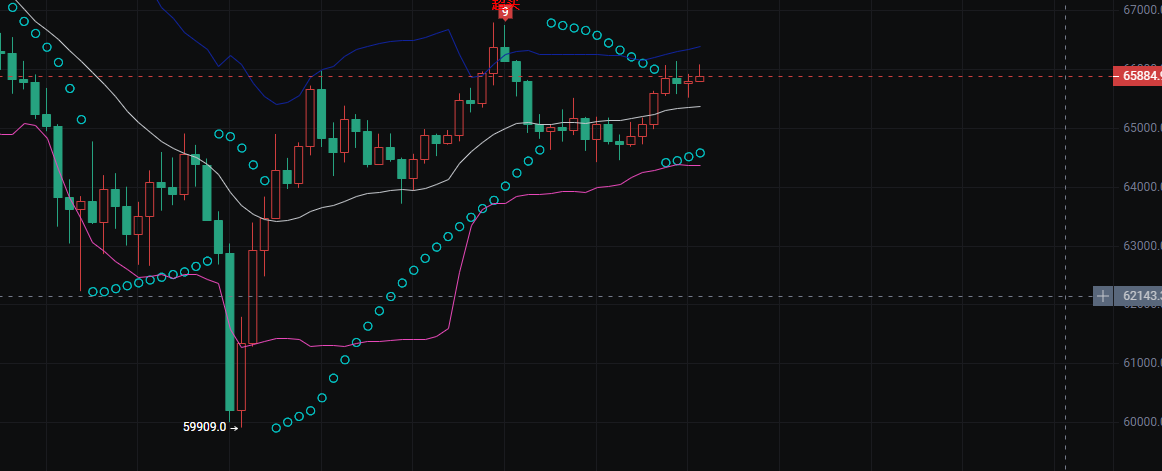
This is a bottom rebound followed by a consolidation phase.
The price has quickly risen from the lowest point of 59909.0, breaking away from the downtrend.
Currently, it is oscillating within the range of 65000~66500, with a temporary balance between bullish and bearish forces.
2. Key Indicator Interpretation
Bollinger Bands:
The price is currently running between the middle band (white line) and the upper band (blue line), indicating a short-term strong zone.
The Bollinger Bands have narrowed after the previous rebound, suggesting a decrease in market volatility and entering a consolidation phase.
Support and Resistance:
Lower support: The middle band of the Bollinger Bands (around 65000) and the previous low of the consolidation phase are key short-term support levels.
Upper resistance: The previous high of the rebound (around 66500) and the upper band of the Bollinger Bands are recent resistance levels.
K-line Patterns:
Recent K-lines show alternating small bearish and bullish candles, with no clear directional breakout signal.
This pattern typically indicates a phase of market consolidation before choosing a direction.
3. Future Trend Projection
Upward Breakout: If the price can stabilize above 66500 and break the previous high with volume, it is likely to initiate a new round of upward movement, targeting the extension of the upper band.
Downward Pullback: If it breaks below the middle band support (65000), it may retest the lower trend support line (pink line), and the strength of the support needs to be monitored.
Continued Oscillation: Before a breakout, the price is likely to continue operating within the current range, allowing for high selling and low buying based on support and resistance.
🔹 Upper Resistance Zone (66500~66700)
This is the previous high of the rebound and the resistance position of the upper band.
If the price breaks above 66500 with volume, a long position can be taken, with the first target around 67000.
If the breakout lacks volume, be cautious of a false breakout; it is best to wait for a retest to confirm support before entering.
🔹 Core Oscillation Zone (65800~66500)
The price is currently consolidating within this range.
When close to the upper edge of the range (66500), a light short position can be attempted; when close to the lower edge (65800), a light long position can be attempted.
The oscillation phase is suitable for quick entries and exits; do not use heavy positions. Once the price breaks the range, be prompt in stopping losses or taking profits.
🔹 Lower Support Zone (65000~65200)
This is a dual support position of the middle band and the previous low of the consolidation phase.
If it pulls back to this range and finds support, a long position can be taken with a stop loss set below 64800 for safety.
If it effectively breaks below 65000, the short-term trend may weaken, and it is advisable to exit and observe for feedback from the next support level (pink trend line).
- 1. Overall Trend of Ethereum
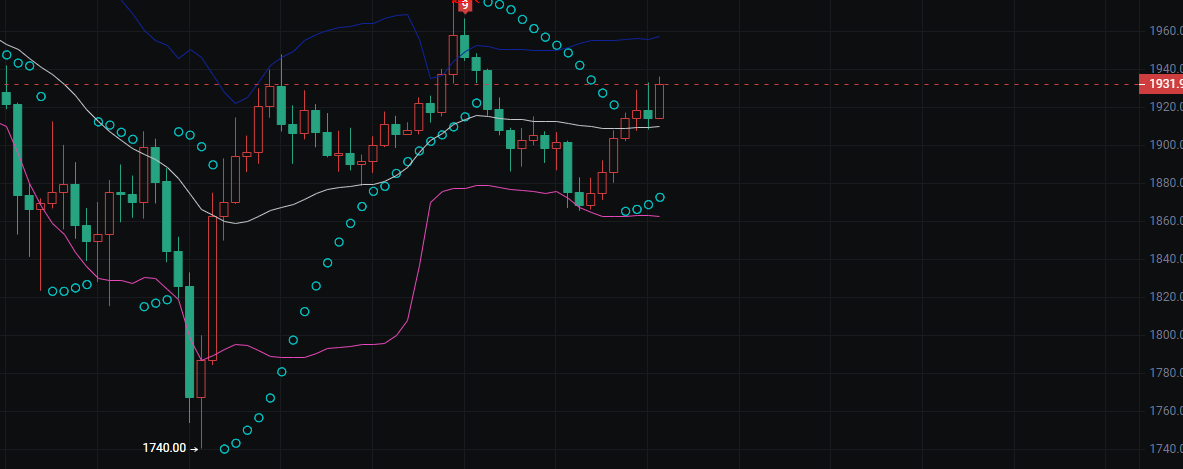
After hitting a low of 1740.0, the price experienced a rapid rebound and then entered a high-level consolidation phase. Currently, the price is fluctuating within the range of 1880~1960, with a temporary balance between bullish and bearish forces.
2. Key Indicator Interpretation
Bollinger Bands: The price is currently operating near the middle band (white line), with the upper band (blue line) forming resistance around 1960 and the lower band (pink line) providing support around 1860. The narrowing of the Bollinger Bands indicates a decrease in market volatility.
Support and Resistance:
Upper resistance: The previous high around 1960 is a strong resistance level and also the area of pressure from the upper band.
Lower support: The middle band (around 1900) and the previous low of 1880 are key supports, with the pink trend line (around 1860) below.
K-line Patterns: Recent K-lines show alternating small bearish and bullish candles, with narrowing amplitude, which is a typical consolidation pattern indicating the market is waiting for a directional choice.
3. Future Trend Projection
Upward Breakout: If the price breaks the 1960 resistance level with volume, it is likely to open up new upward space, allowing for a long position with targets towards the extension of the upper band.
Downward Pullback: If it breaks below the 1900 support, it may retest the 1880 or even 1860 support levels; if 1860 is also lost, the short-term trend may weaken.
Continued Oscillation: Before a clear direction is established, the price is likely to continue operating within the current range, allowing for high selling and low buying based on support and resistance, with attention to quick entries and exits.
🔹 Upper Resistance Zone (1950~1960)
This is the previous high of the rebound and the resistance position of the upper band, serving as an important dividing line for bulls and bears in the short term.
If the price breaks above 1960 with volume, a long position can be taken, with the first target around 1980~2000.
If the breakout lacks volume, be cautious of a false breakout; it is advisable to wait for a retest to confirm support before entering.
🔹 Core Oscillation Zone (1900~1950)
The price is currently consolidating within this range.
When close to the upper edge (1950), a light short position can be attempted; when close to the lower edge (1900), a light long position can be attempted.
The oscillation phase is suitable for quick entries and exits; do not use heavy positions. Once the price breaks the range, be prompt in stopping losses or taking profits.
🔹 Lower Support Zone (1860~1900)
1900 is the support of the middle band, and 1860 is a dual support of the pink trend line and the previous low, serving as an important defensive position in the short term.
If it pulls back to around 1900 and finds support, a long position can be taken with a stop loss set below 1880 for safety.
If it effectively breaks below 1860, the short-term trend may weaken; it is advisable to exit and observe for feedback from the next support level.

Note: 📣 Due to the limited timeliness and depth of information on public platforms, the market is ever-changing. Key turning points, precise operational strategies, and sudden risk alerts need to be synchronized in real-time on the official account. Here, you can receive: real-time strategy updates, in-depth analysis support, interactive Q&A, and risk warnings and optimization suggestions tailored to individual positions. 🚨 Remember: The market always rewards those who act faster and have more accurate information! Be a winner among the minority.)
免责声明:本文章仅代表作者个人观点,不代表本平台的立场和观点。本文章仅供信息分享,不构成对任何人的任何投资建议。用户与作者之间的任何争议,与本平台无关。如网页中刊载的文章或图片涉及侵权,请提供相关的权利证明和身份证明发送邮件到support@aicoin.com,本平台相关工作人员将会进行核查。