当前加密货币市场的状况可以称为“有趣”,因为我们目睹了各种ETF的显著资金流出和下降的交易量,这暗示着积累周期的结束。
柴犬币的最大机会
柴犬币显示出可能是几个月以来最重要的看涨信号,而这个信号是基于交易量而非单纯的价格行为。长期反转通常建立在价格下跌与交易量上升之间的差异不断扩大之上,尽管SHIB的整体市场结构仍然明显看跌。在为时已晚之前,大多数投资者往往会忽视这个信号,认为它并没有立即反映在价格上。
随着50日、100日和200日移动平均线作为持久的阻力,SHIB仍然被困在所有主要日移动平均线之下。从结构角度来看,趋势仍然向下,最近的上涨尝试未能产生持续的动能而失败。
热门故事 比特币矿工正在投降 加密市场回顾:柴犬币确认最大看涨信号,XRP微型死亡交叉形成,以太坊(ETH)是否被超卖?Weiss Crypto:比特币将超越黄金早间加密报告:新的-1820万美元XRP震荡比你想象的更大,“100万美元比特币”倡导者用10倍预测打破两个最大神话,狗狗币(DOGE)创始人用一个词描述比特币价格崩溃
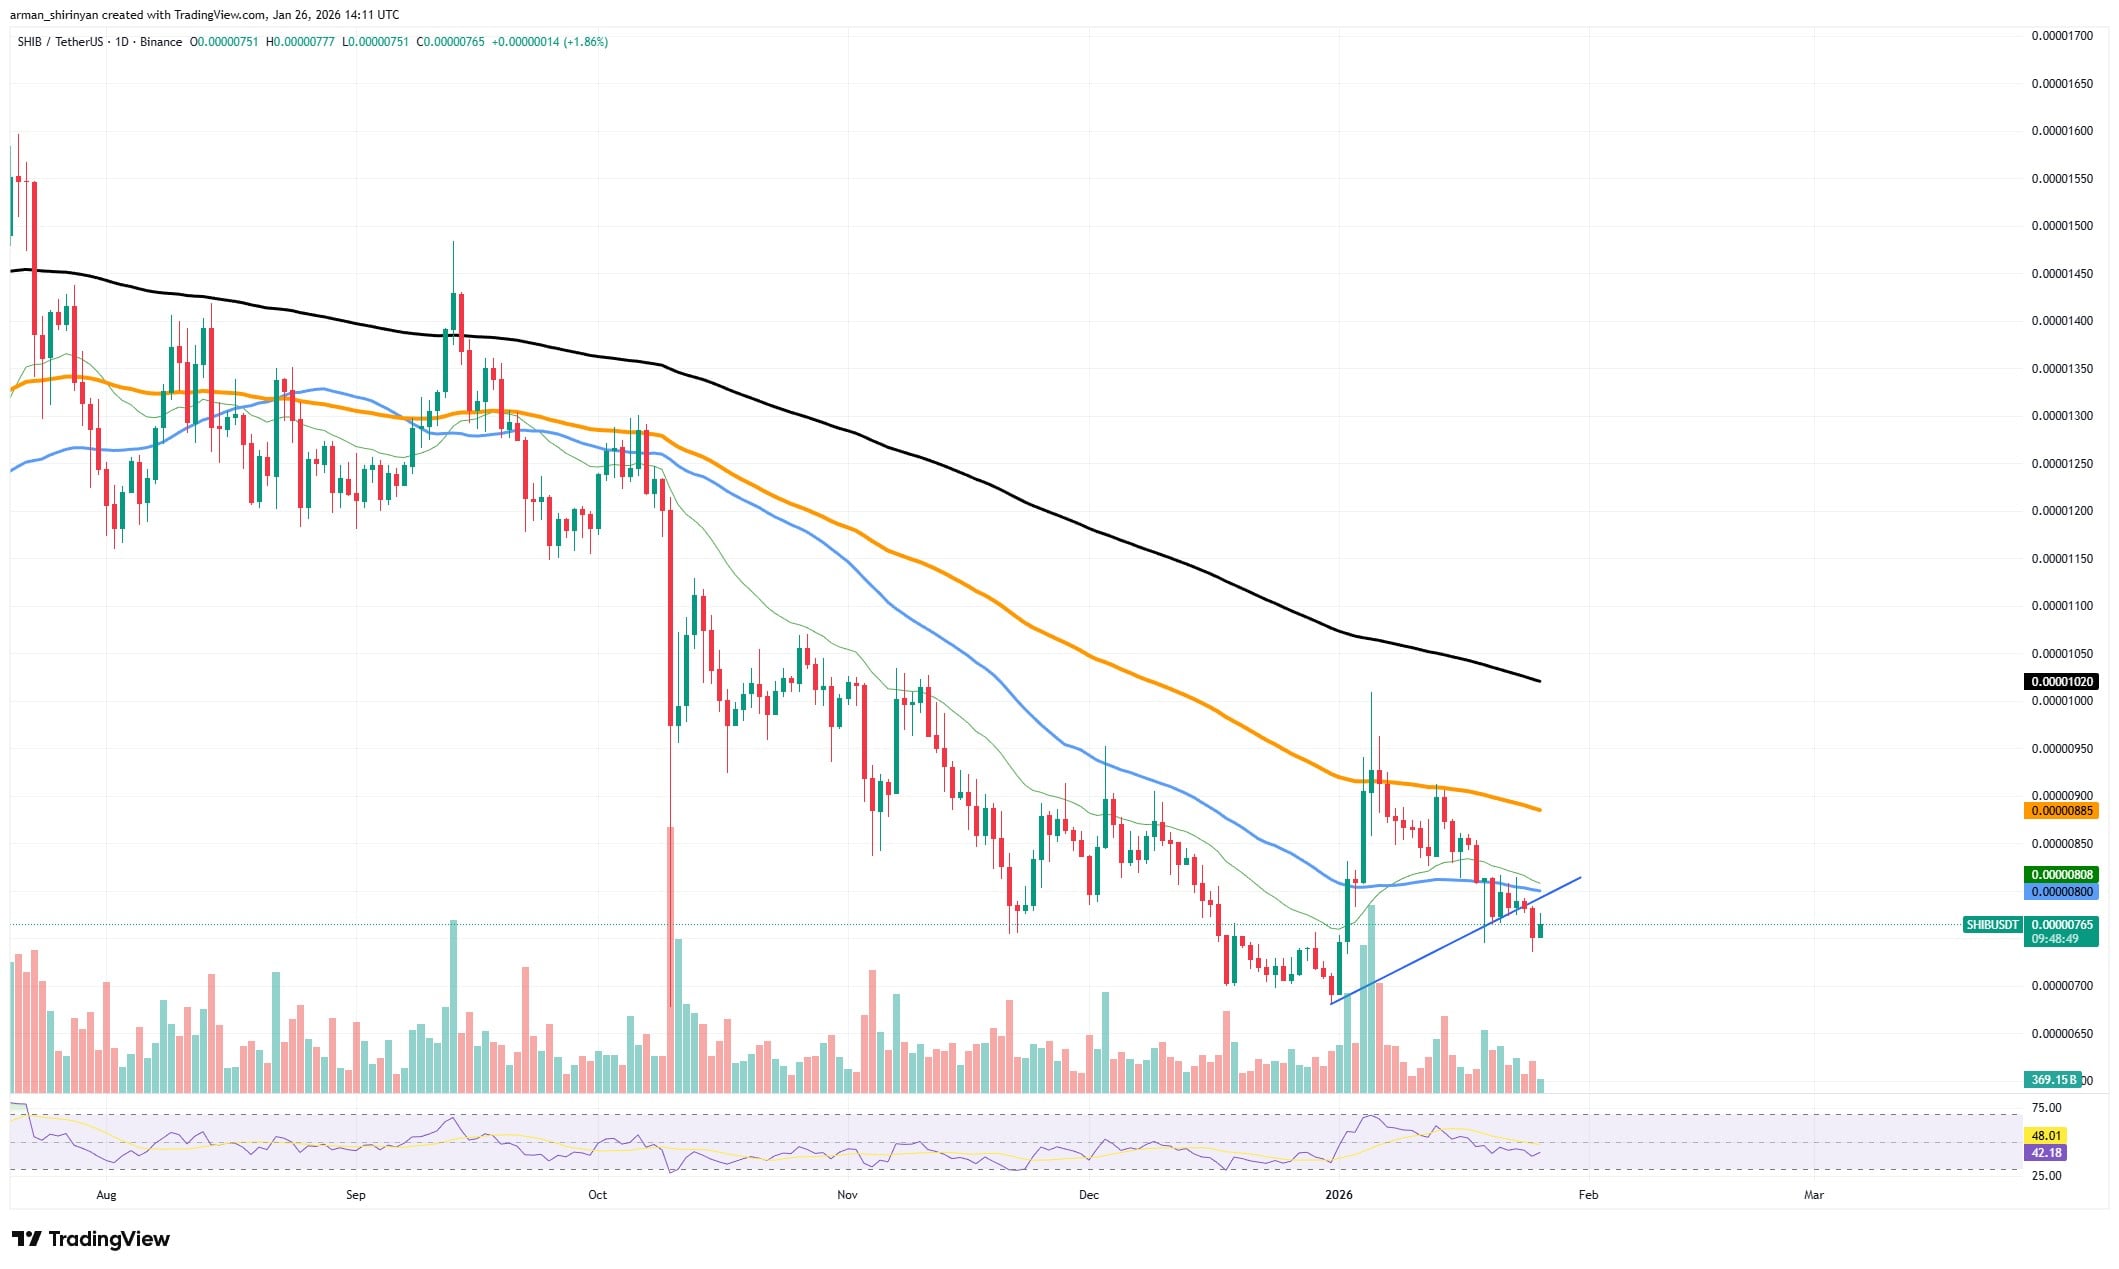
SHIB/USDT图表由TradingView提供
交易量的故事则有所不同,通常在反转已经开始后才被人们注意到。在最近的抛售和整合期间,向下的交易量并没有显著增加,这表明卖方缺乏紧迫感。
价格仍然受到空头的压制,但他们的信心似乎在每次尝试中都在减弱。这一观点得到了最近上升结构的支持,尽管存在更大、明显的下行趋势。
你可能也会喜欢
周四, 2026年1月22日 - 15:35 $6.03亿比特币和以太坊,黑石集团最大出售正在进行中作者戈弗雷·本杰明
即使在SHIB突破其短期楔形模式后,跟进的交易量也不足以确认强烈的看跌延续。强烈的看跌延续并不是这样的,尤其是在卖方自信且积极的市场中。
相反,这种行为暗示供应正在被吸收,而不是被强行抛售,分配正在减缓而不是加速。RSI行为进一步强化了同样的基本故事。
尽管价格持续疲软,但动能已从极度超卖状态中恢复,并且现在在中性区域稳定下来,拒绝强烈回落。这种动能行为更常见于积累阶段,而不是表现出投降。
主要教训很简单:尽管价格仍然疲软,但压力正在减弱。
微型XRP死亡交叉
许多交易者迅速将XRP最近的走势称为死亡交叉,但事实远没有这个短语所暗示的那么戏剧化。这个交叉并不是传统的50日移动平均线跌破200日移动平均线,这在历史上更具权重。
你可能也会喜欢
周一, 2026年1月26日 - 23:26 XRP交易量激增214%,市场抛售清算7.45亿美元作者Tomiwabold Olajide
相反,这是一种短期、低影响的事件,对XRP的长期轨迹几乎没有什么意义,具体来说是26日指数移动平均线跌破50日指数移动平均线。
在经历了数周的持续下行压力后,这个微型死亡交叉形成,作为对价格已经发生的事情的滞后确认,而不是作为领先指标。自未能维持在$2.30-$2.40区间以来,XRP一直处于明显的下行趋势,短期均线也只是跟随价格下跌。
从技术角度来看,XRP仍然低于所有有意义的趋势定义均线。更广泛的看跌结构得到了100日和200日指数移动平均线的强化,这两者仍然向下倾斜,并且位于当前价格之上。
这种解读得到了交易量行为的支持。重要的是,在交叉发生时,卖方交易量并没有增加。无论是看涨还是看跌,任何显著的趋势转变都需要参与,而在这种情况下,交易量仍然低迷。这本身就削弱了将这一走势框架化为决定性突破的任何尝试。
以太坊深入技术分析
以太坊正接近一个技术区域,向下压力似乎正在减弱。经过数周的持续抛售,ETH目前交易接近$2,900,动能指标明显显示出超卖状态。当前的设置表明,以太坊可能更接近恢复阶段,而不是再次下跌,尽管更广泛的市场趋势仍然岌岌可危。
相对强弱指数(RSI)提供了最重要的信号。在日线时间框架上,RSI在已经跌入超卖区域后,努力向下移动。历史上,这种行为标志着卖方开始失去控制的时期,即使完全的趋势反转并不会立即发生。超卖状态并不保证底部,但确实表明启动新空头头寸的风险回报正在恶化。
你可能也会喜欢
周日, 2026年1月25日 - 14:45 以太坊交易量激增1,251.19%,ETH见证重要市场恢复作者Arman Shirinyan
价格结构支持这种解读。以太坊已经失去了所有主要移动平均线,包括50日、100日和200日线,确认了看跌的中期趋势。同时,这也表明已经造成了实质性的技术损害。市场很少以直线方式移动,在经历如此长时间的下跌后,稳定或反弹成为更可能的短期结果。
这并不意味着以太坊开始了新的牛市。任何短期的恢复都可能是修正性的,而不是冲动性的,宏观结构仍然坚定看跌。在$3,200-$3,400区间仍然存在显著的阻力。尽管如此,考虑到超卖的RSI、减弱的下行动能和价格接近历史反应水平,恢复尝试是最现实的预期。
免责声明:本文章仅代表作者个人观点,不代表本平台的立场和观点。本文章仅供信息分享,不构成对任何人的任何投资建议。用户与作者之间的任何争议,与本平台无关。如网页中刊载的文章或图片涉及侵权,请提供相关的权利证明和身份证明发送邮件到support@aicoin.com,本平台相关工作人员将会进行核查。


