原文作者:Garrett
原文编译:佳欢,ChainCatcher
最近,一些分析师一直在将当前的 BTC 价格走势与 2022 年进行对比。 诚然,短期的价格形态可能看起来有些相似。但如果放眼长期大局,这种比较是完全荒谬的。
无论是从:
长期价格形态
宏观经济背景
投资者构成及供应/持有结构
其底层逻辑都存在根本性的差异。
在金融市场的分析与交易中,最大的错误莫过于仅仅死盯着短期的、表象层面的统计学相似性,而忽略了长期的、宏观的以及基本面的驱动因素。
相反的宏观背景
2022 年 3 月,美国正深陷于高通胀和加息周期之中,其驱动因素包括:
新冠疫情期间的流动性过剩
由乌克兰战争爆发所触发的危机,进一步推高了通胀的猛烈程度
当时,无风险利率不断攀升,流动性被系统性地抽离,金融状况日益收紧。 在这种环境下,资本的首要目标是规避风险。 我们当时在BTC上看到的,本质上是一个紧缩周期中的高位派发(出货)结构。
当前,宏观环境则截然相反:
乌克兰冲突正在降温(部分归因于美国降低通胀和利率的努力)
CPI(消费者价格指数)和美国无风险利率正在下降
AI 技术革命极大地增强了经济进入长期“去通胀”周期的可能性。 在大周期上,利率已经进入了降息阶段
央行流动性正被重新注入金融系统
资本的行为模式为“风险偏好上升”
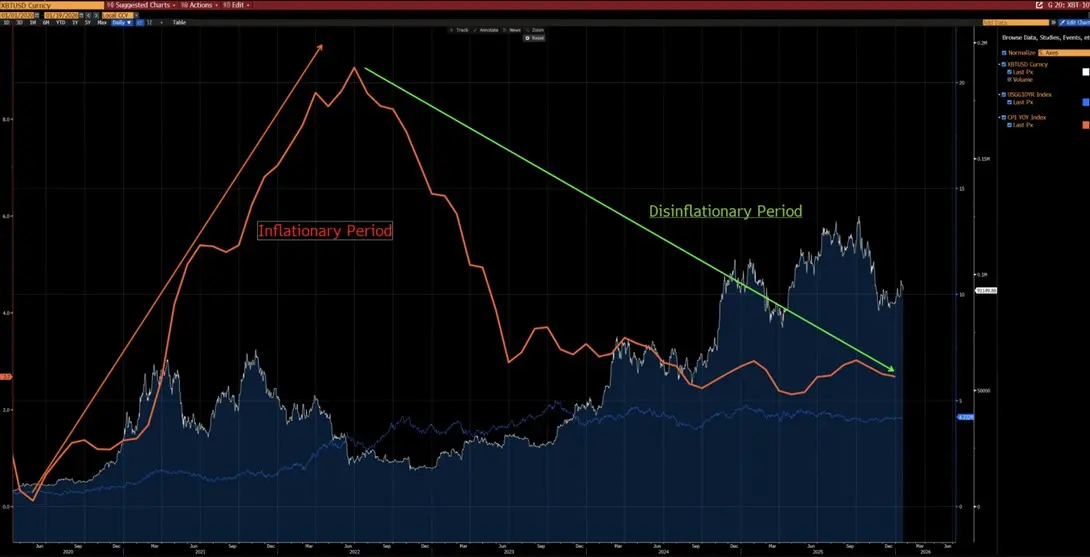
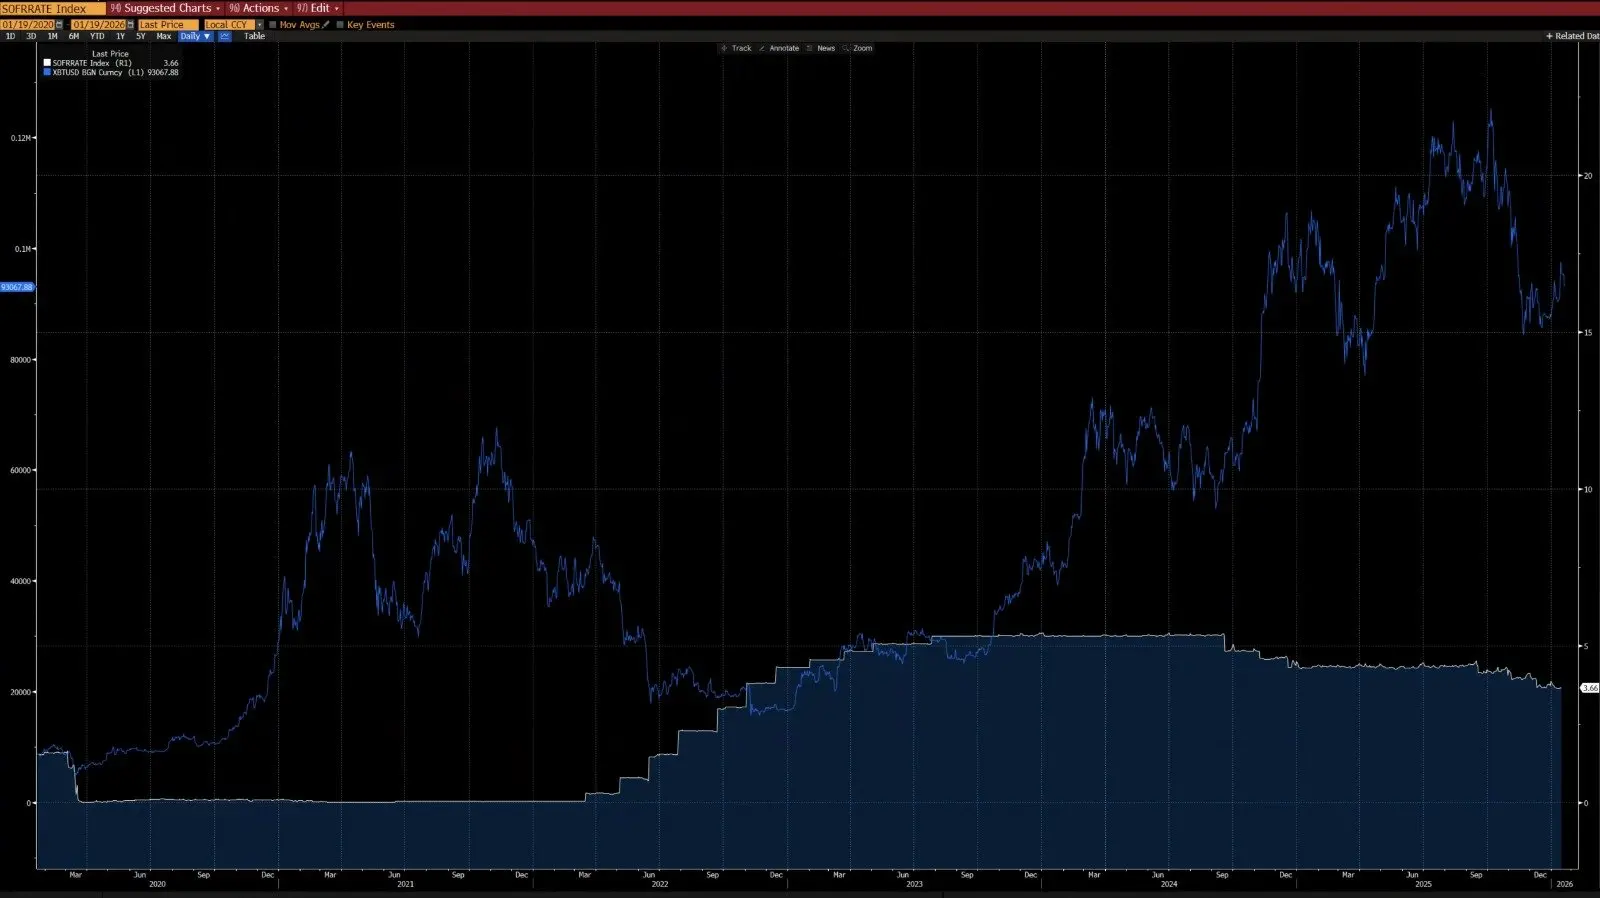
从上图可以看出,自 2020 年以来,BTC 与 CPI 的同比变化呈现出明显的负相关性——BTC 往往在通胀上升周期中下跌,而在去通胀周期中反弹。 在 AI 驱动的技术革命下,长期去通胀是一个大概率事件——马斯克也呼应了这一观点,这进一步印证了我们的论点。
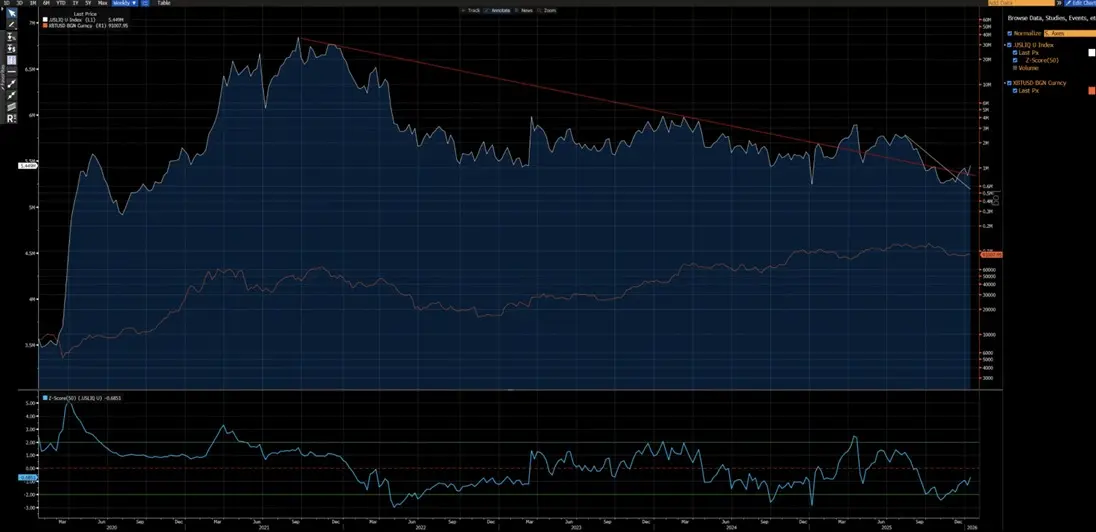
从上图可以看出,自 2020 年以来,BTC 与美国流动性指数显示出极强的相关性(2024 年因 ETF 资金流入造成的失真除外)。目前,美国流动性指数已经突破了其短期(白色)和长期(红色)的下行趋势线,一个新的上升趋势已然在望。
不同的技术结构
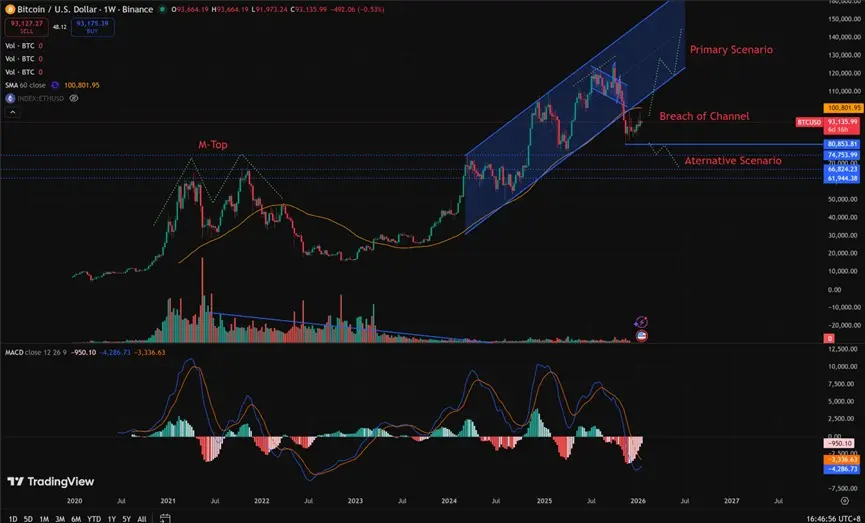
2021–2022年: 周线级别的“ M 顶”结构,这种结构通常与长周期的市场顶部相关,会导致价格受到长期的压制。
2025年: 周线级别跌破上升通道。从概率角度来看,这更像是一个在反弹之前的“空头陷阱”。
是的,我们不能完全排除这会演变成 2022 年式的熊市延续。 然而,关键在于要注意 80,850 / 62,000 这一区域经历了充分的盘整与筹码换手。 这种前期的筹码消化为多头布局提供了极佳的风险回报比: 上行潜力显著大于下行风险。
若要重现 2022 年式的熊市,需要具备哪些条件?
必须要满足几个硬性条件:
- 新一轮的通胀冲击,或规模类似于 2022 年的重大地缘政治危机
- 央行恢复加息或资产负债表缩表
- 价格果断且持续地跌破 80,850
在这些条件满足之前,断言结构性熊市是过早的和投机的,而非基于理性的分析。
不同的投资者
2020–2022年: 散户主导的市场,机构参与度有限,尤其是缺乏长期配置型资金。
2023 年以后: BTC ETF的推出引入了结构性的长期持有者,有效地锁定了供应,大幅降低了交易周转率,并实质性地降低了波动率。
2023 年标志着 BTC 作为一种资产在宏观和量化层面的结构性拐点。 BTC的波动率机制已发生转变:从历史上的 80–150%转变为 30–60%,这是一种根本不同的资产行为模式。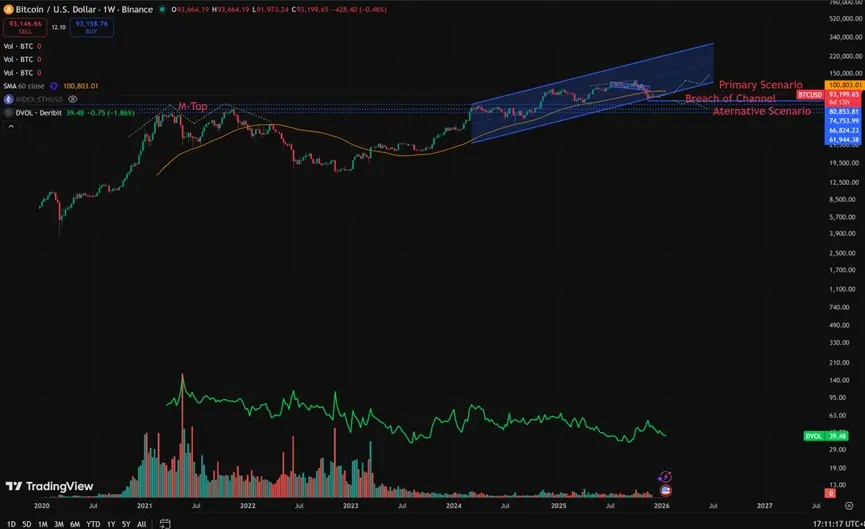
核心结构差异
现在(2026年初)与 2022 年相比,BTC 投资者结构最大的区别在于发生了如下转变:
从 散户主导、高杠杆投机
转向 机构主导、结构性长期持有。
在 2022 年,BTC 经历的是一场经典的“加密原生熊市”,主要由散户的恐慌性抛售和连锁的杠杆清算(爆仓)所驱动。 如今,BTC 运行在一个更加成熟的机构化时代,其特征为:
稳定的底层需求
被锁定的供应量
机构级别的波动率
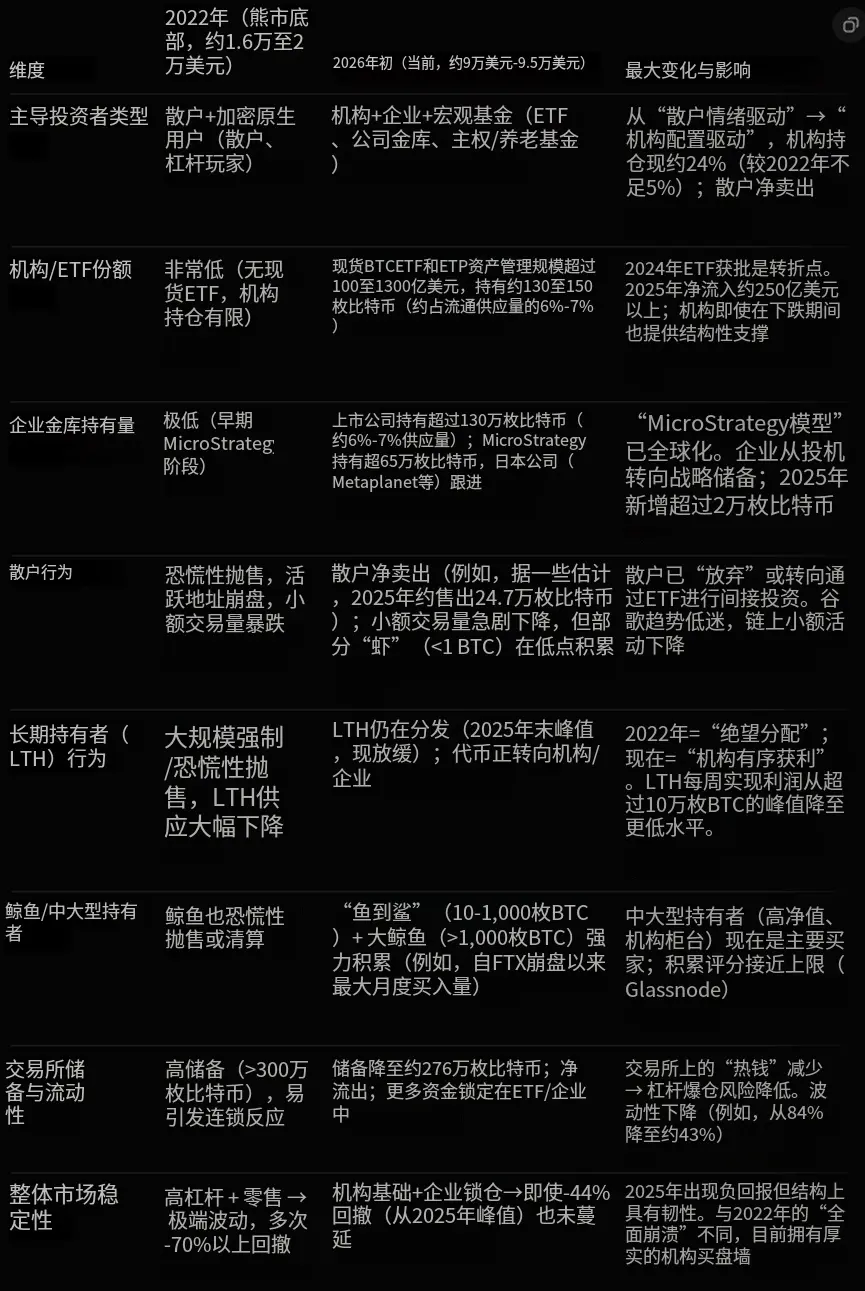
以下是 Grok 基于链上数据(如 Glassnode, Chainalysis)和机构报告(如 Grayscale, Bitwise, State Street)所做的核心对比,数据截至2026年1月中旬(BTC价格约在 $90k–$95k 区间):
免责声明:本文章仅代表作者个人观点,不代表本平台的立场和观点。本文章仅供信息分享,不构成对任何人的任何投资建议。用户与作者之间的任何争议,与本平台无关。如网页中刊载的文章或图片涉及侵权,请提供相关的权利证明和身份证明发送邮件到support@aicoin.com,本平台相关工作人员将会进行核查。


