The daily chart tells the tale of a diva in decline — not dramatically crashing, but definitely dialing back the drama. After a spicy rejection near $94,600, bitcoin has been stringing together lower highs with the commitment of a seasoned soap opera star. The current sideways-to-down drift has carved out a visible range between $86,000 and $90,000.
Despite the cooling momentum and a fading rally, the $85,500–$86,000 support zone has proven to be stickier than a toddler with a lollipop. Resistance, meanwhile, looms at $90,500–$91,000 like an ex who just won’t quit. Bottom line? Consolidation is the name of the game, not collapse.
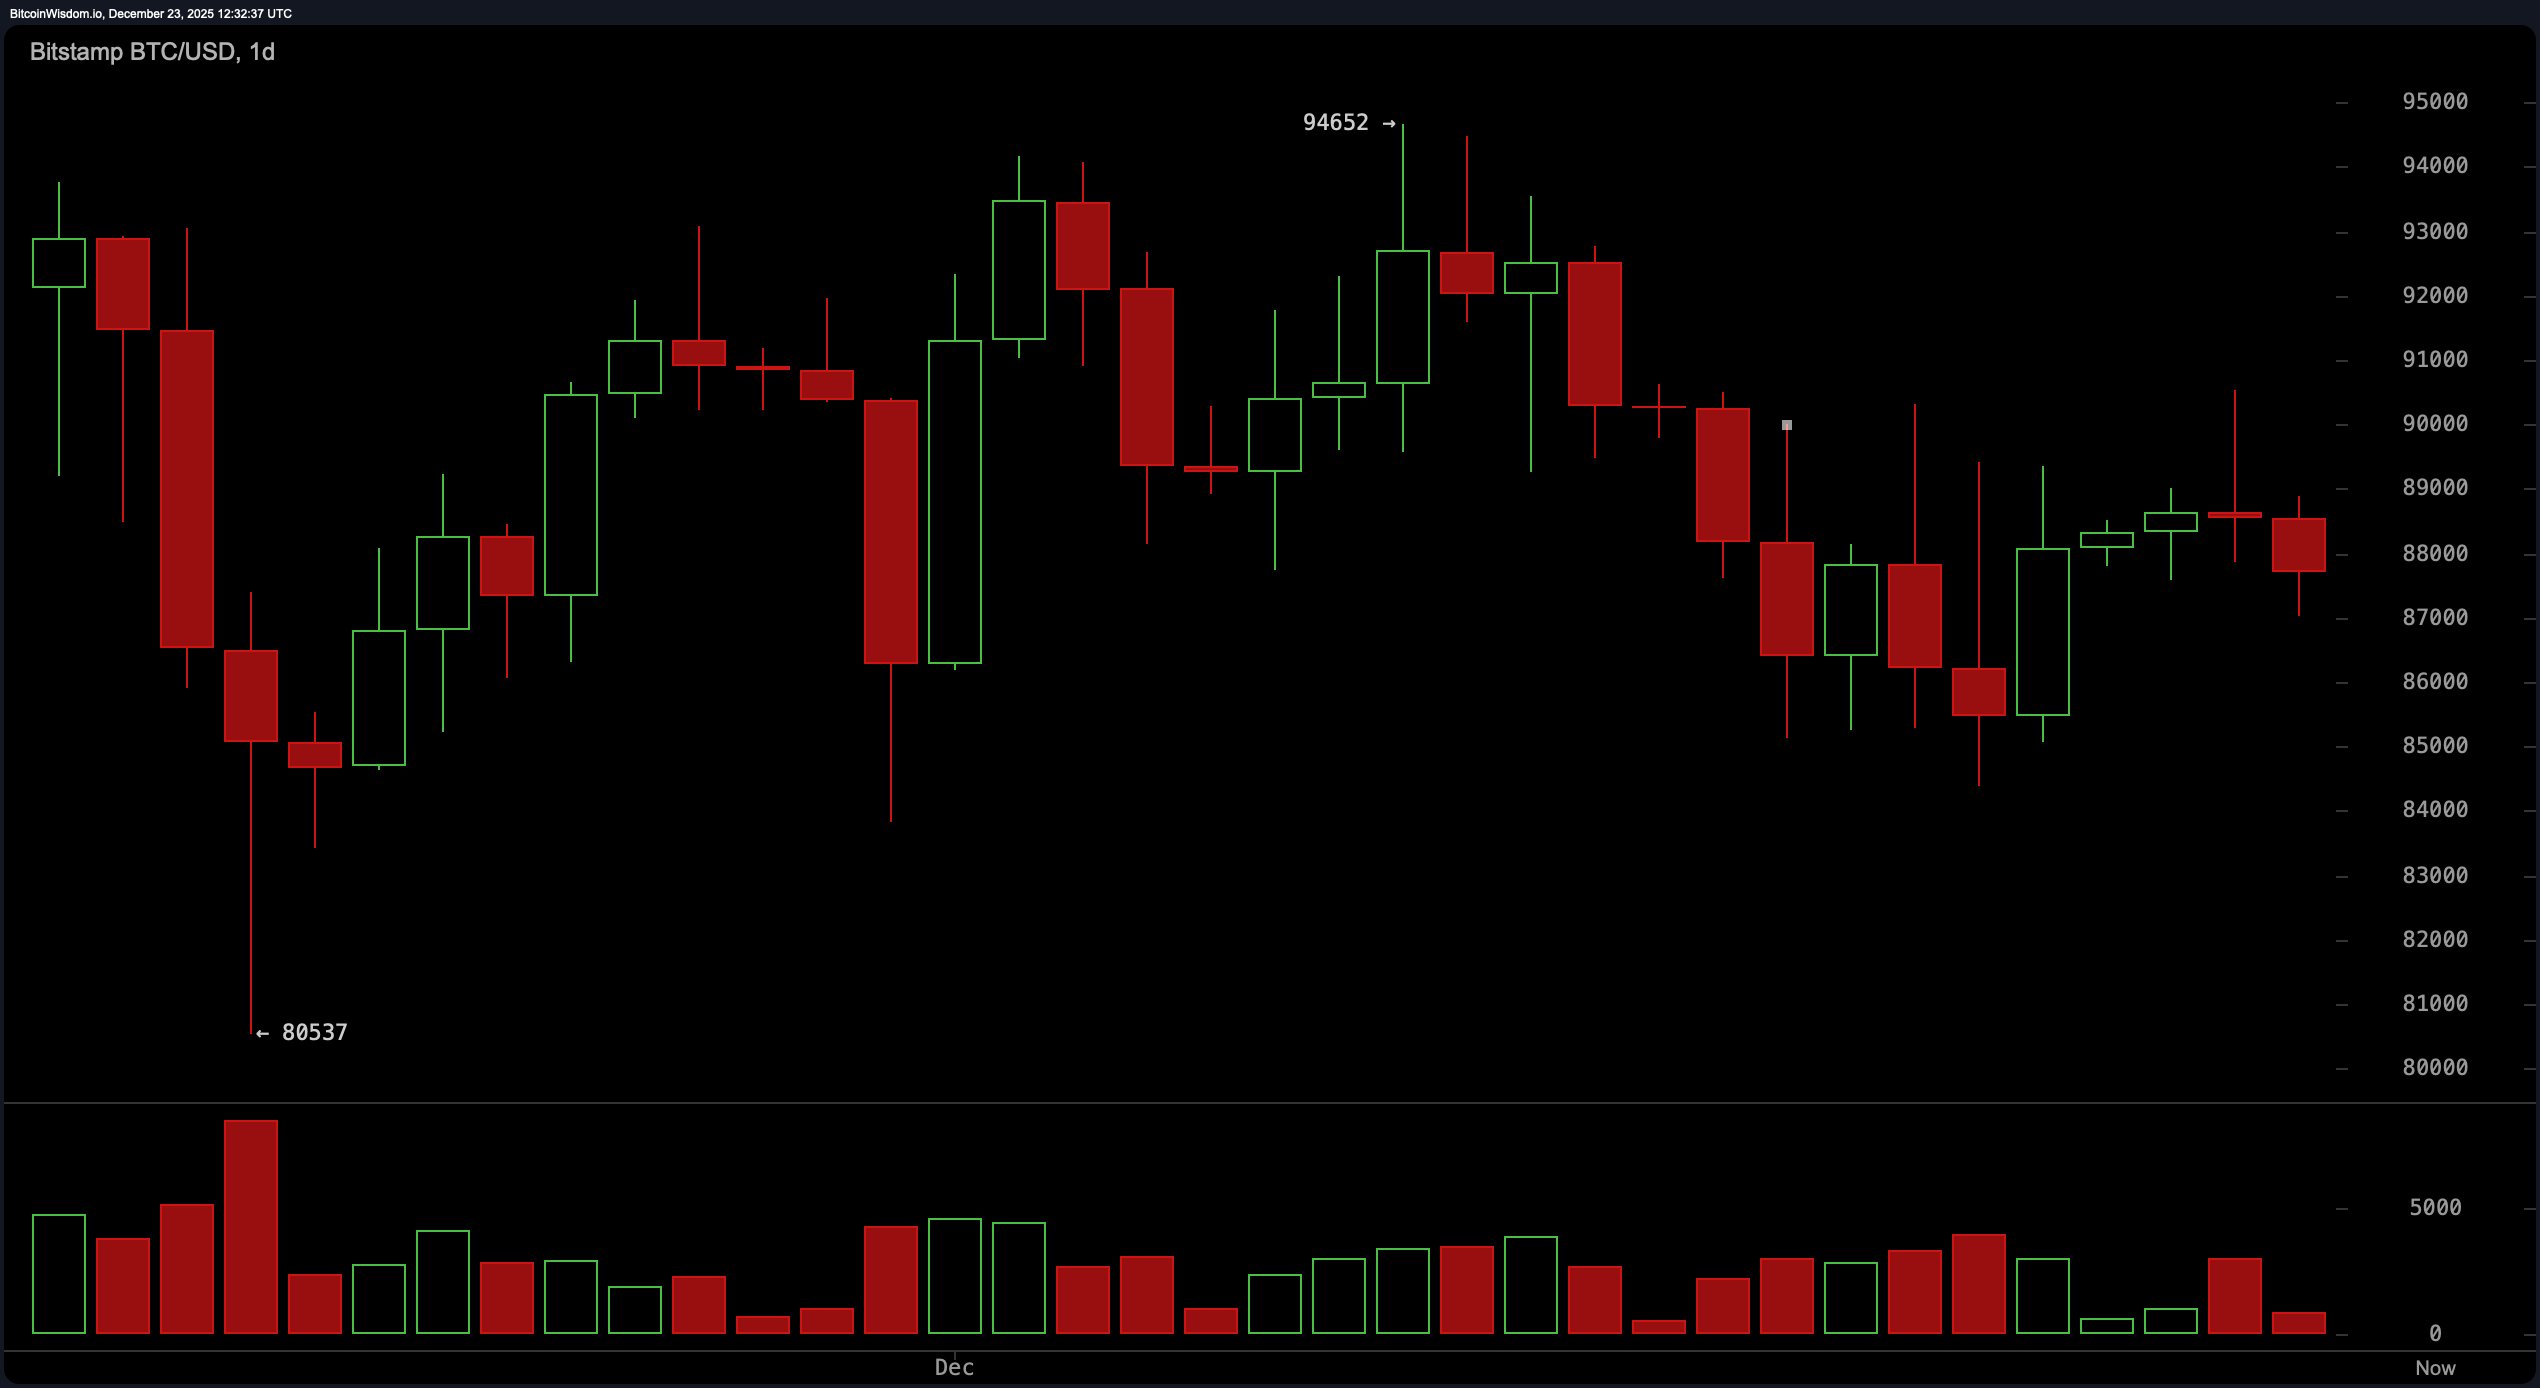
BTC/USD 1-day chart via Bitstamp on Dec. 23, 2025.
On the 4-hour chart, bitcoin’s most recent performance resembles a failed attempt at a breakout followed by a “we tried” pullback. The price peaked at $90,536 and gracefully slid into a series of lower highs and lower lows, shedding enthusiasm but not collapsing in despair. Volume metrics show a burst of sell pressure followed by a tapering off — a classic sign of seller fatigue rather than all-out liquidation. Key support at $87,500–$88,000 is holding firm, and with resistance set at $89,800–$90,500, this setup smells more like a pause than a pivot.
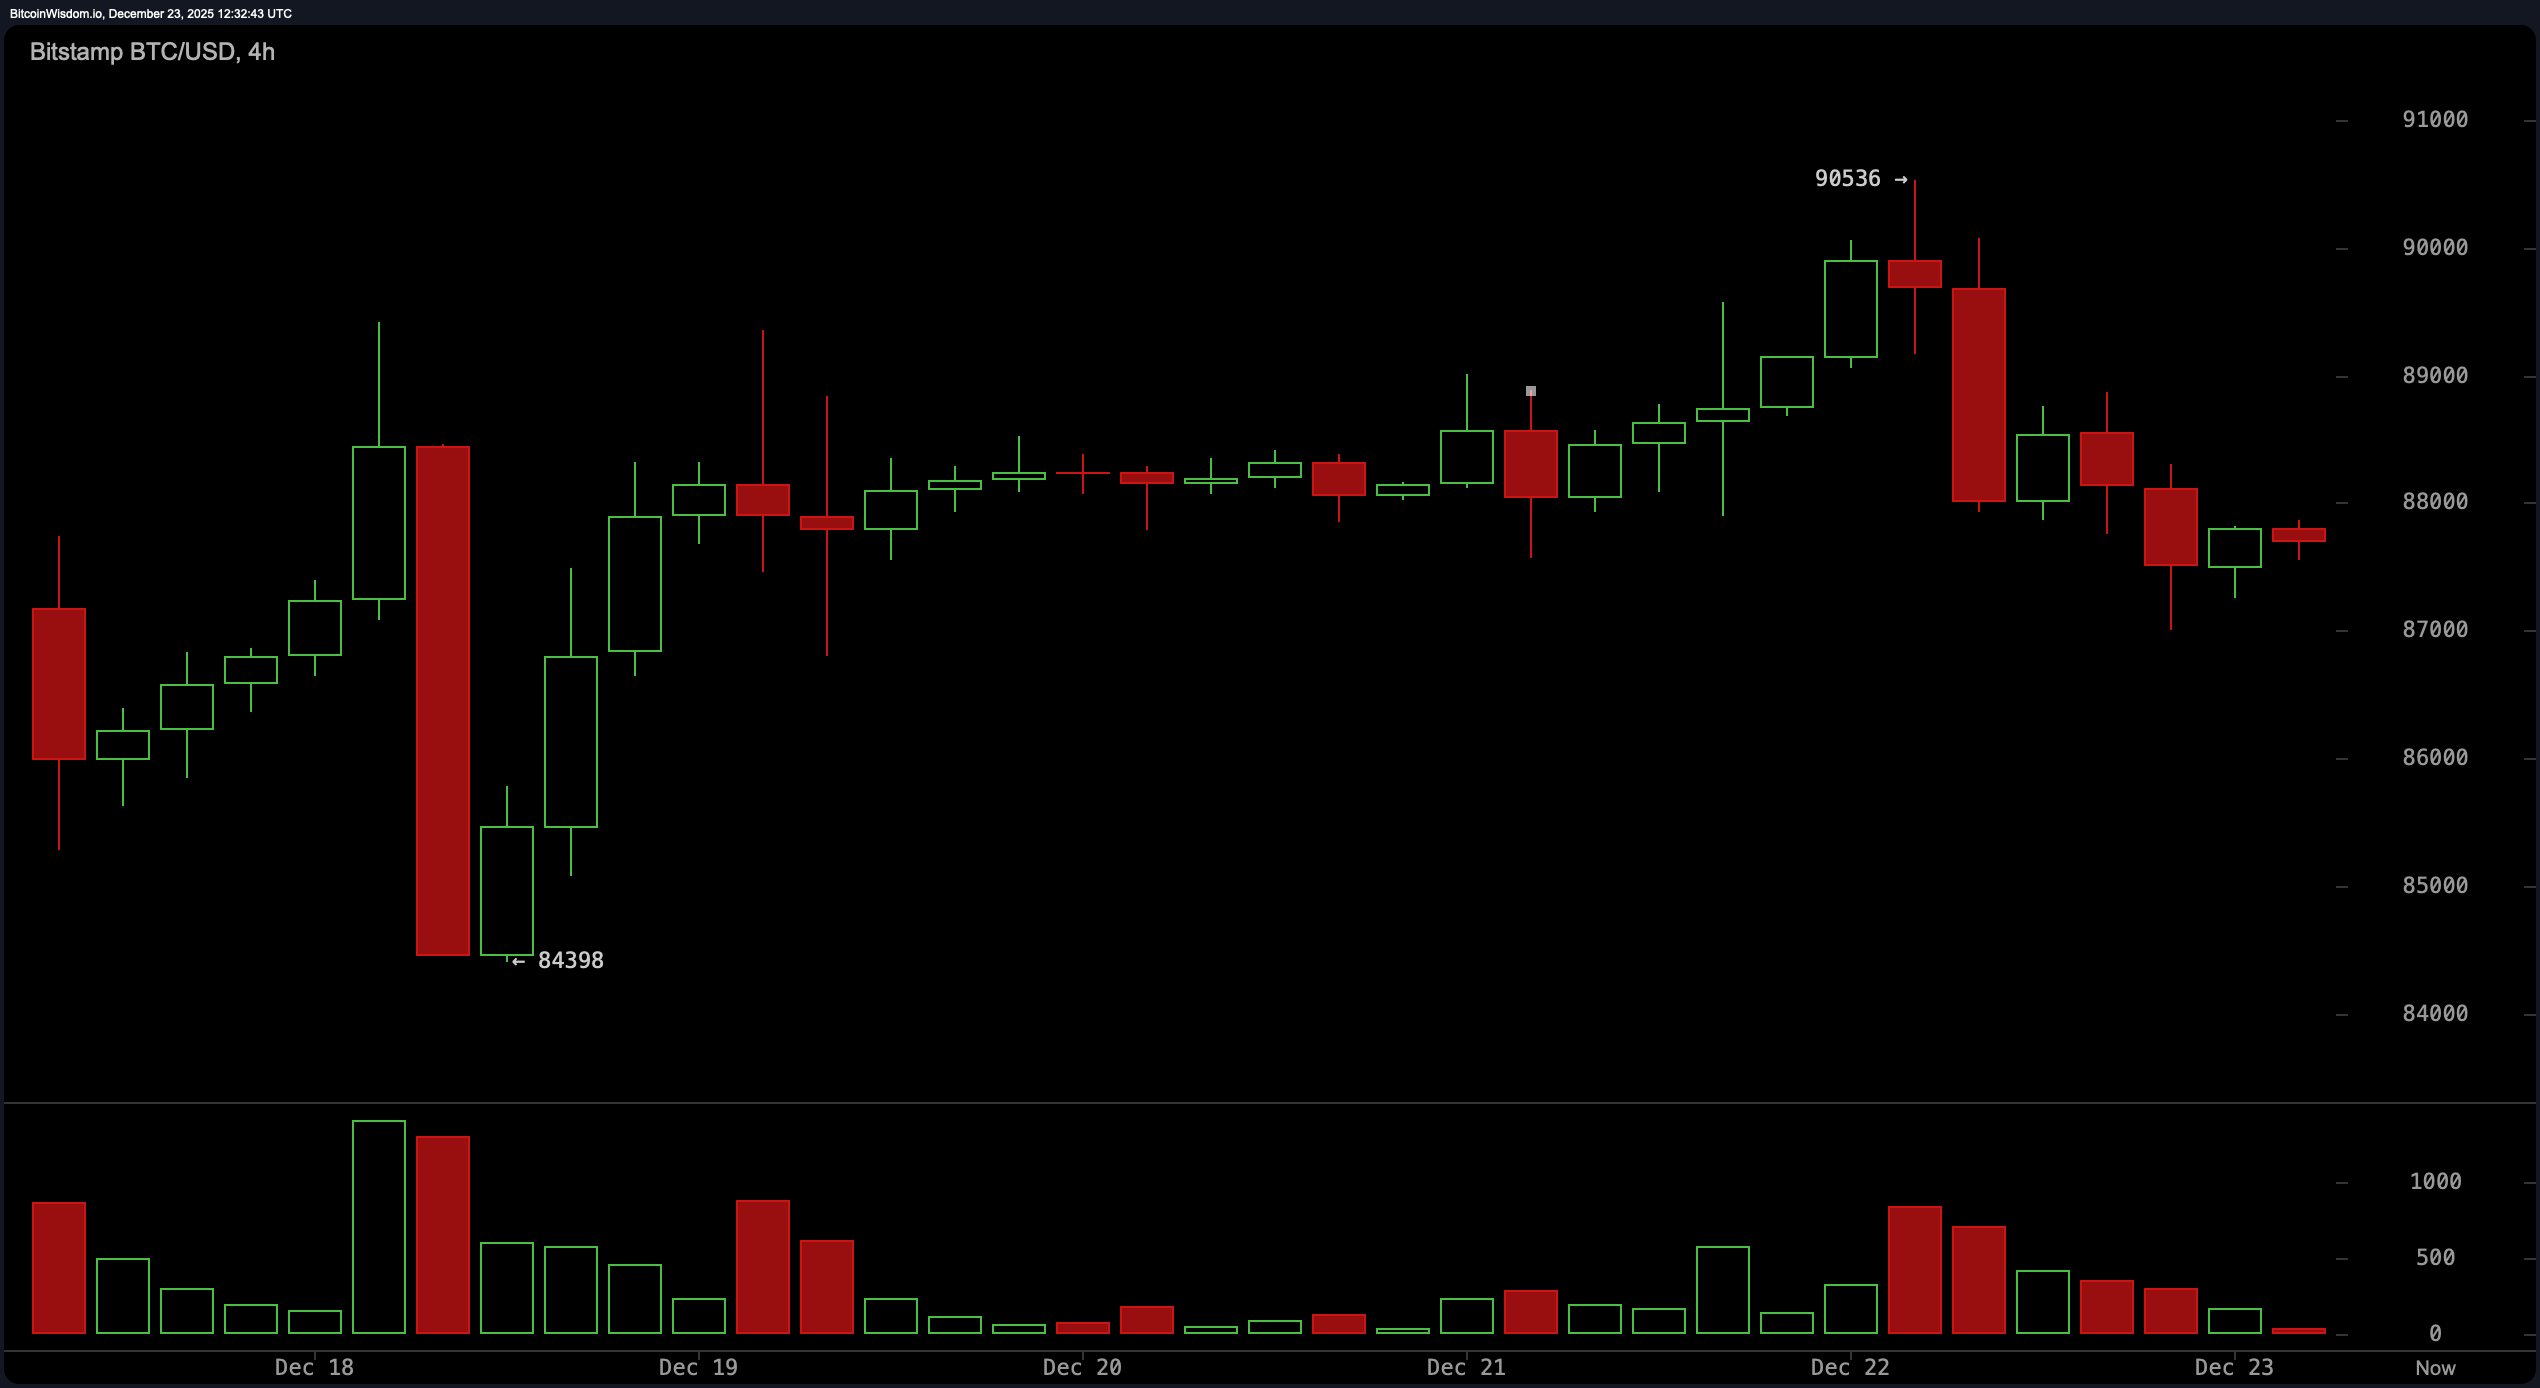
BTC/USD 4-hour chart via Bitstamp on Dec. 23, 2025.
Zooming into the 1-hour chart, signs of life begin to twitch. After bouncing off $87,010, bitcoin has started forming higher lows, hinting at the early stages of a base — but don’t pop the champagne just yet. Momentum remains limp, though improving, as cautious buyers step back in like introverts at a networking event. Immediate support lies between $87,000 and $87,300, with resistance parked at $88,500 and $89,200. This timeframe suggests a short-term recovery attempt, but until bitcoin clears overhead levels with purpose, the bulls remain on probation.
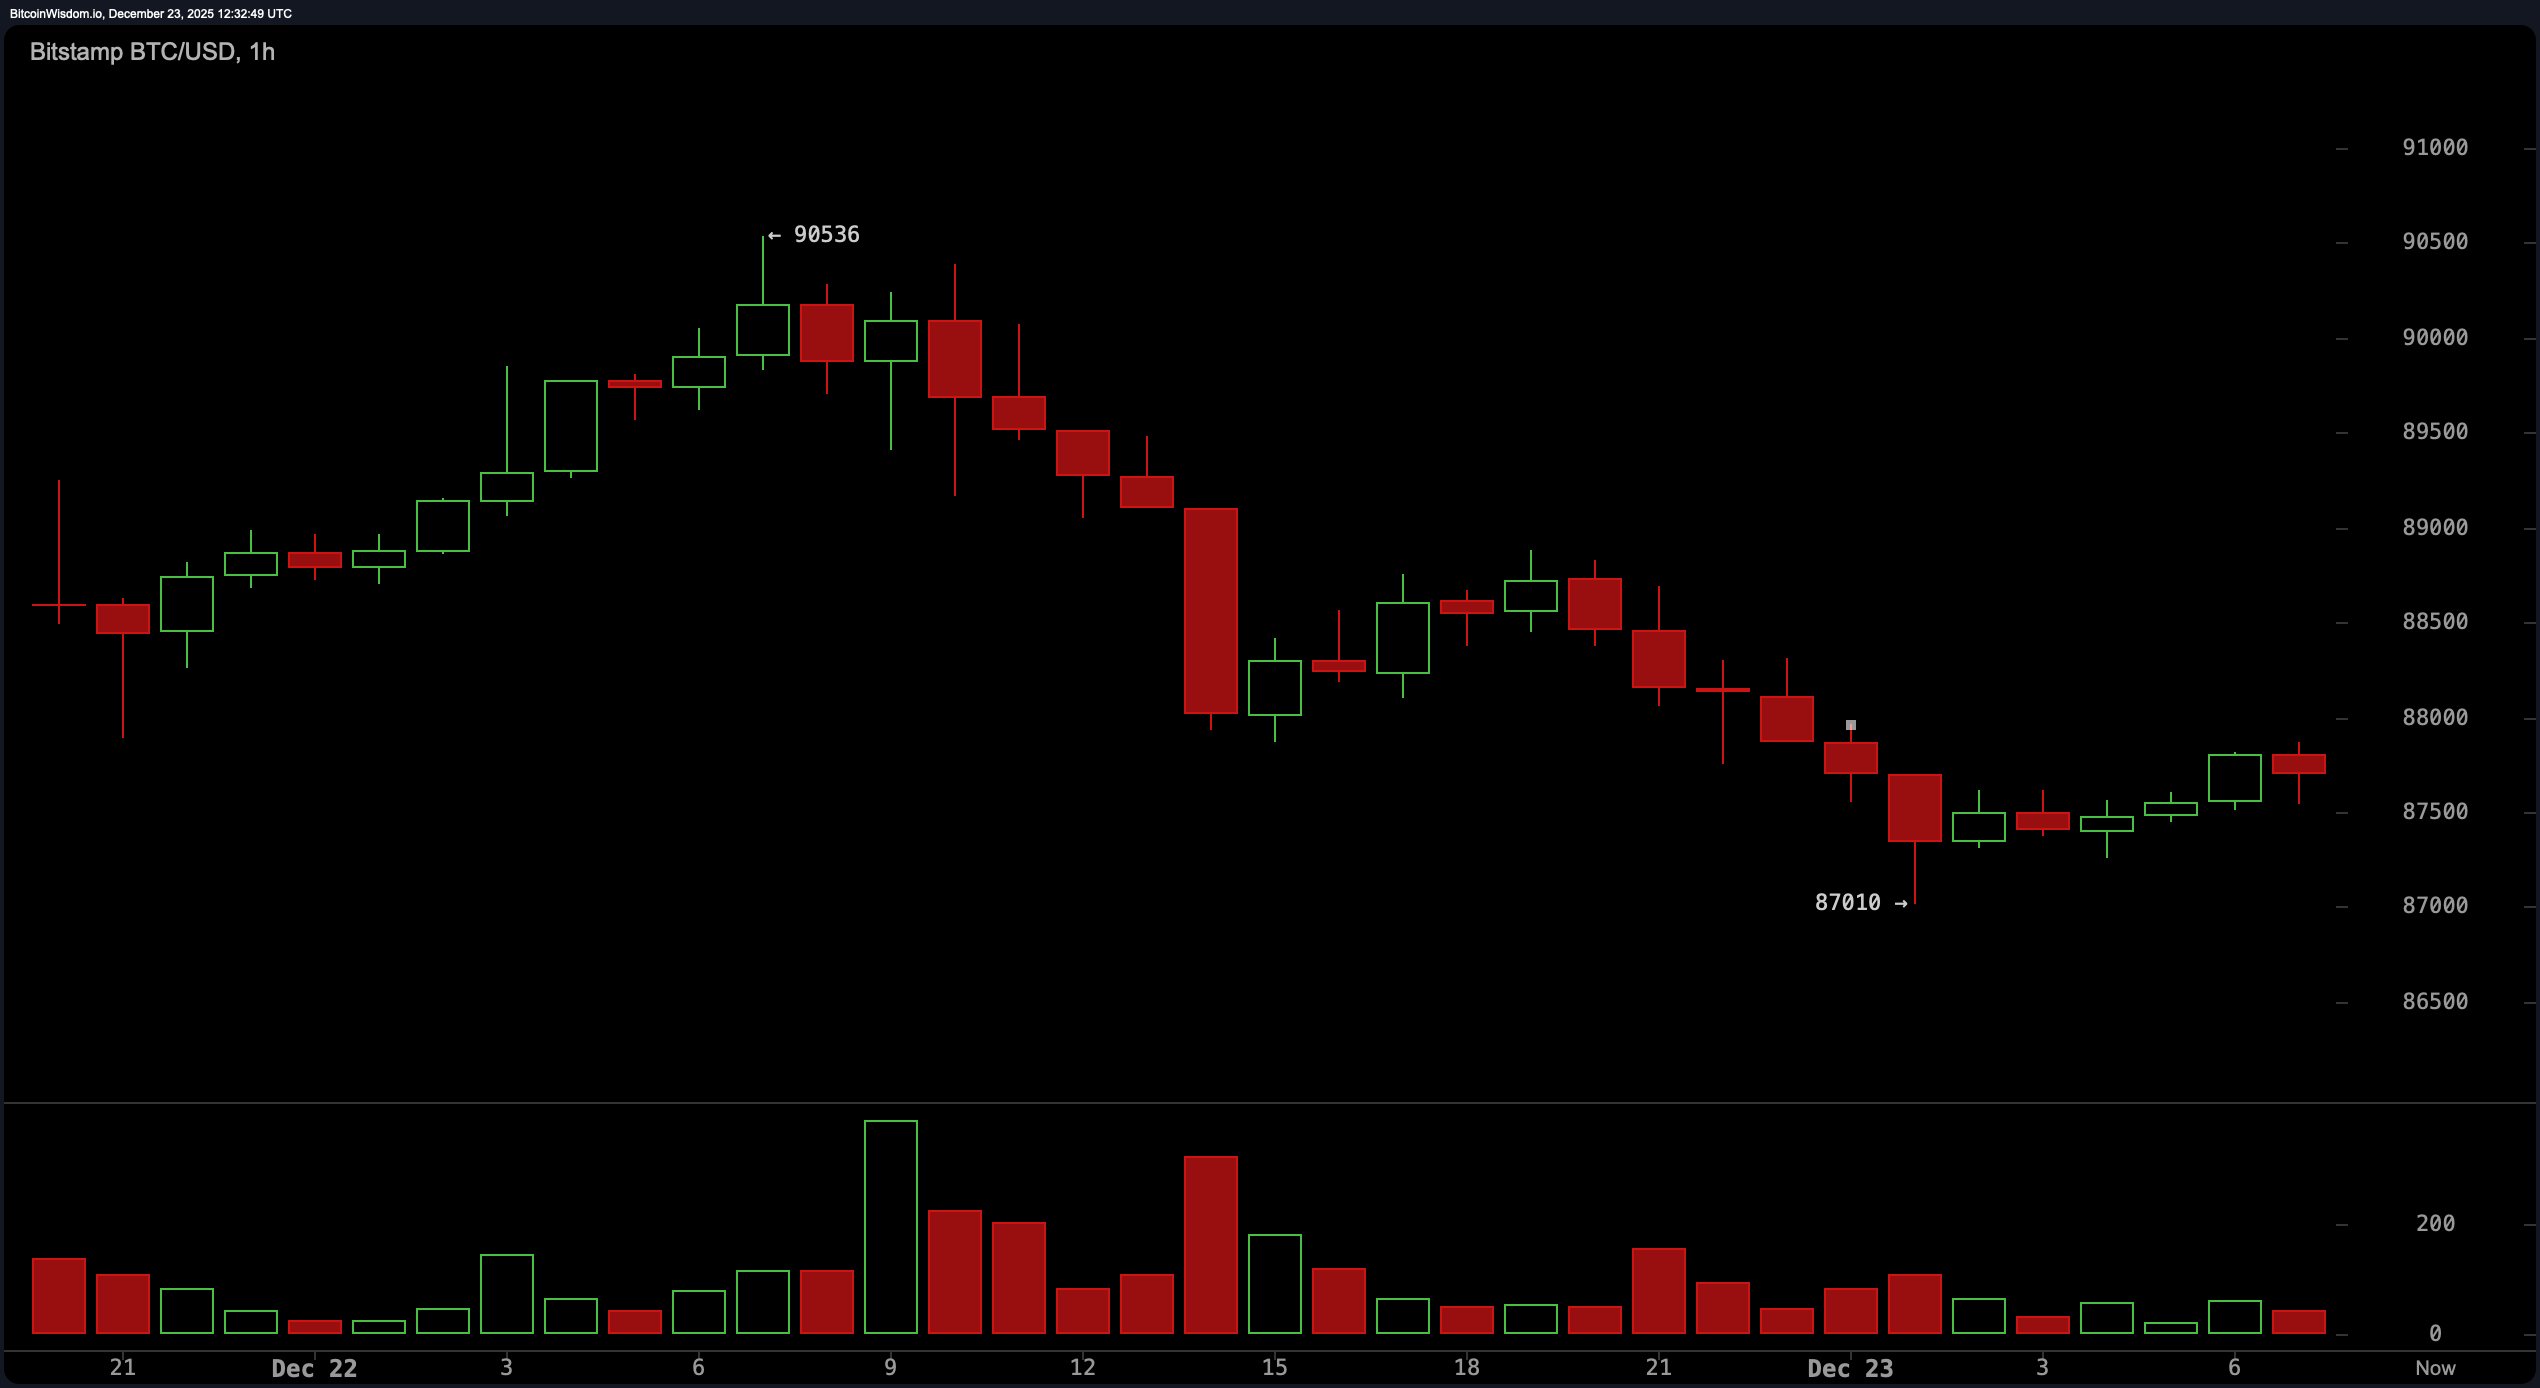
BTC/USD 1-hour chart via Bitstamp on Dec. 23, 2025.
The oscillator readings could make even a caffeinated day trader yawn. The relative strength index ( RSI) is at a neutral 43, the Stochastic is lounging at 38, and the commodity channel index (CCI) is a modest -64. The average directional index (ADX) clocks in at a weak 23, indicating a lack of trend strength. Meanwhile, the Awesome oscillator is humming along at -977, and momentum has dipped to -2,664 — the only clear bearish outlier in the crowd. Even the moving average convergence divergence ( MACD) is playing both sides, showing a slight buy signal at -1,408. In short, the oscillators are caught in a limbo of indifference, with only momentum looking overtly pessimistic.
Moving averages (MAs) are singing a decidedly more melancholic tune. The exponential moving averages (EMAs) for 10 through 200 periods are all leaning bearish, with the 10-period EMA at $88,196 and the 200-period EMA languishing at $101,843. Simple moving averages (SMAs) don’t offer much relief either. While the 10-period SMA is slightly bullish at $87,529 — clinging just above the current price — the rest of the stack from 20 to 200 periods is firmly below water. This suggests that bitcoin’s short-term price action is holding better than its longer-term trajectory, but the broader trend still favors cautious optimism at best.
In summary, bitcoin is in the throes of a range-bound identity crisis — not quite bearish, not quite bullish, but definitely not boring. Until price escapes the $86,000–$90,000 corridor with conviction, this remains a patience play, not a breakout binge.
Bull Verdict:
Buyers are showing quiet strength at the $87,000 level, defending key support zones with textbook precision. If bitcoin clears $89,200 and sustains above $90,500, it could ignite a fresh push toward $92,000 and reattempt the broader range highs. Momentum is improving on the lower timeframes, and the formation of higher lows hints at a potential bottom being carved — but bulls need to act soon or risk losing the narrative.
Bear Verdict:
Despite holding support, bitcoin continues to print lower highs and remains below nearly every significant moving average from short to long-term. Oscillators are largely neutral, but momentum is clearly weak, and the broader structure suggests distribution rather than accumulation. Without a strong reclaim of $90,000+, this remains a bounce inside a downtrend — and a decisive loss of $86,500 on strong volume could accelerate downside quickly.
- What is bitcoin’s current price?
Bitcoin is trading at $87,634 as of Dec. 23, 2025. - Is bitcoin in an uptrend or downtrend right now?
bitcoin is consolidating sideways with a slight downward bias. - What’s the key support level for bitcoin today?
Support is holding between $87,000 and $87,500 on lower timeframes. - Where is bitcoin likely to face resistance?
Major resistance sits between $89,200 and $90,500.
免责声明:本文章仅代表作者个人观点,不代表本平台的立场和观点。本文章仅供信息分享,不构成对任何人的任何投资建议。用户与作者之间的任何争议,与本平台无关。如网页中刊载的文章或图片涉及侵权,请提供相关的权利证明和身份证明发送邮件到support@aicoin.com,本平台相关工作人员将会进行核查。


