从日线图来看,自从跌破3.05美元的阻力位以来,整体趋势持续阴沉下滑。价格行动仍然徘徊在2.30美元附近,蜡烛体逐渐缩小,暗示着犹豫不决,或者更乐观地说,基础形态的悄然酝酿。之前一根红蜡烛的成交量激增,暗示着抛售,但随后的跟进热情却逐渐消退。
技术指标似乎同样不确定,相对强弱指数(RSI)读数为42.4,平均方向指数(ADX)徘徊在31.4,而强势振荡器则低迷在−0.0627——所有这些都指向一个停滞不前的市场。只有动量和移动平均收敛发散(MACD)指标采取了明确的立场,分别显示出进一步下行压力,数值为−0.0801和−0.0672。
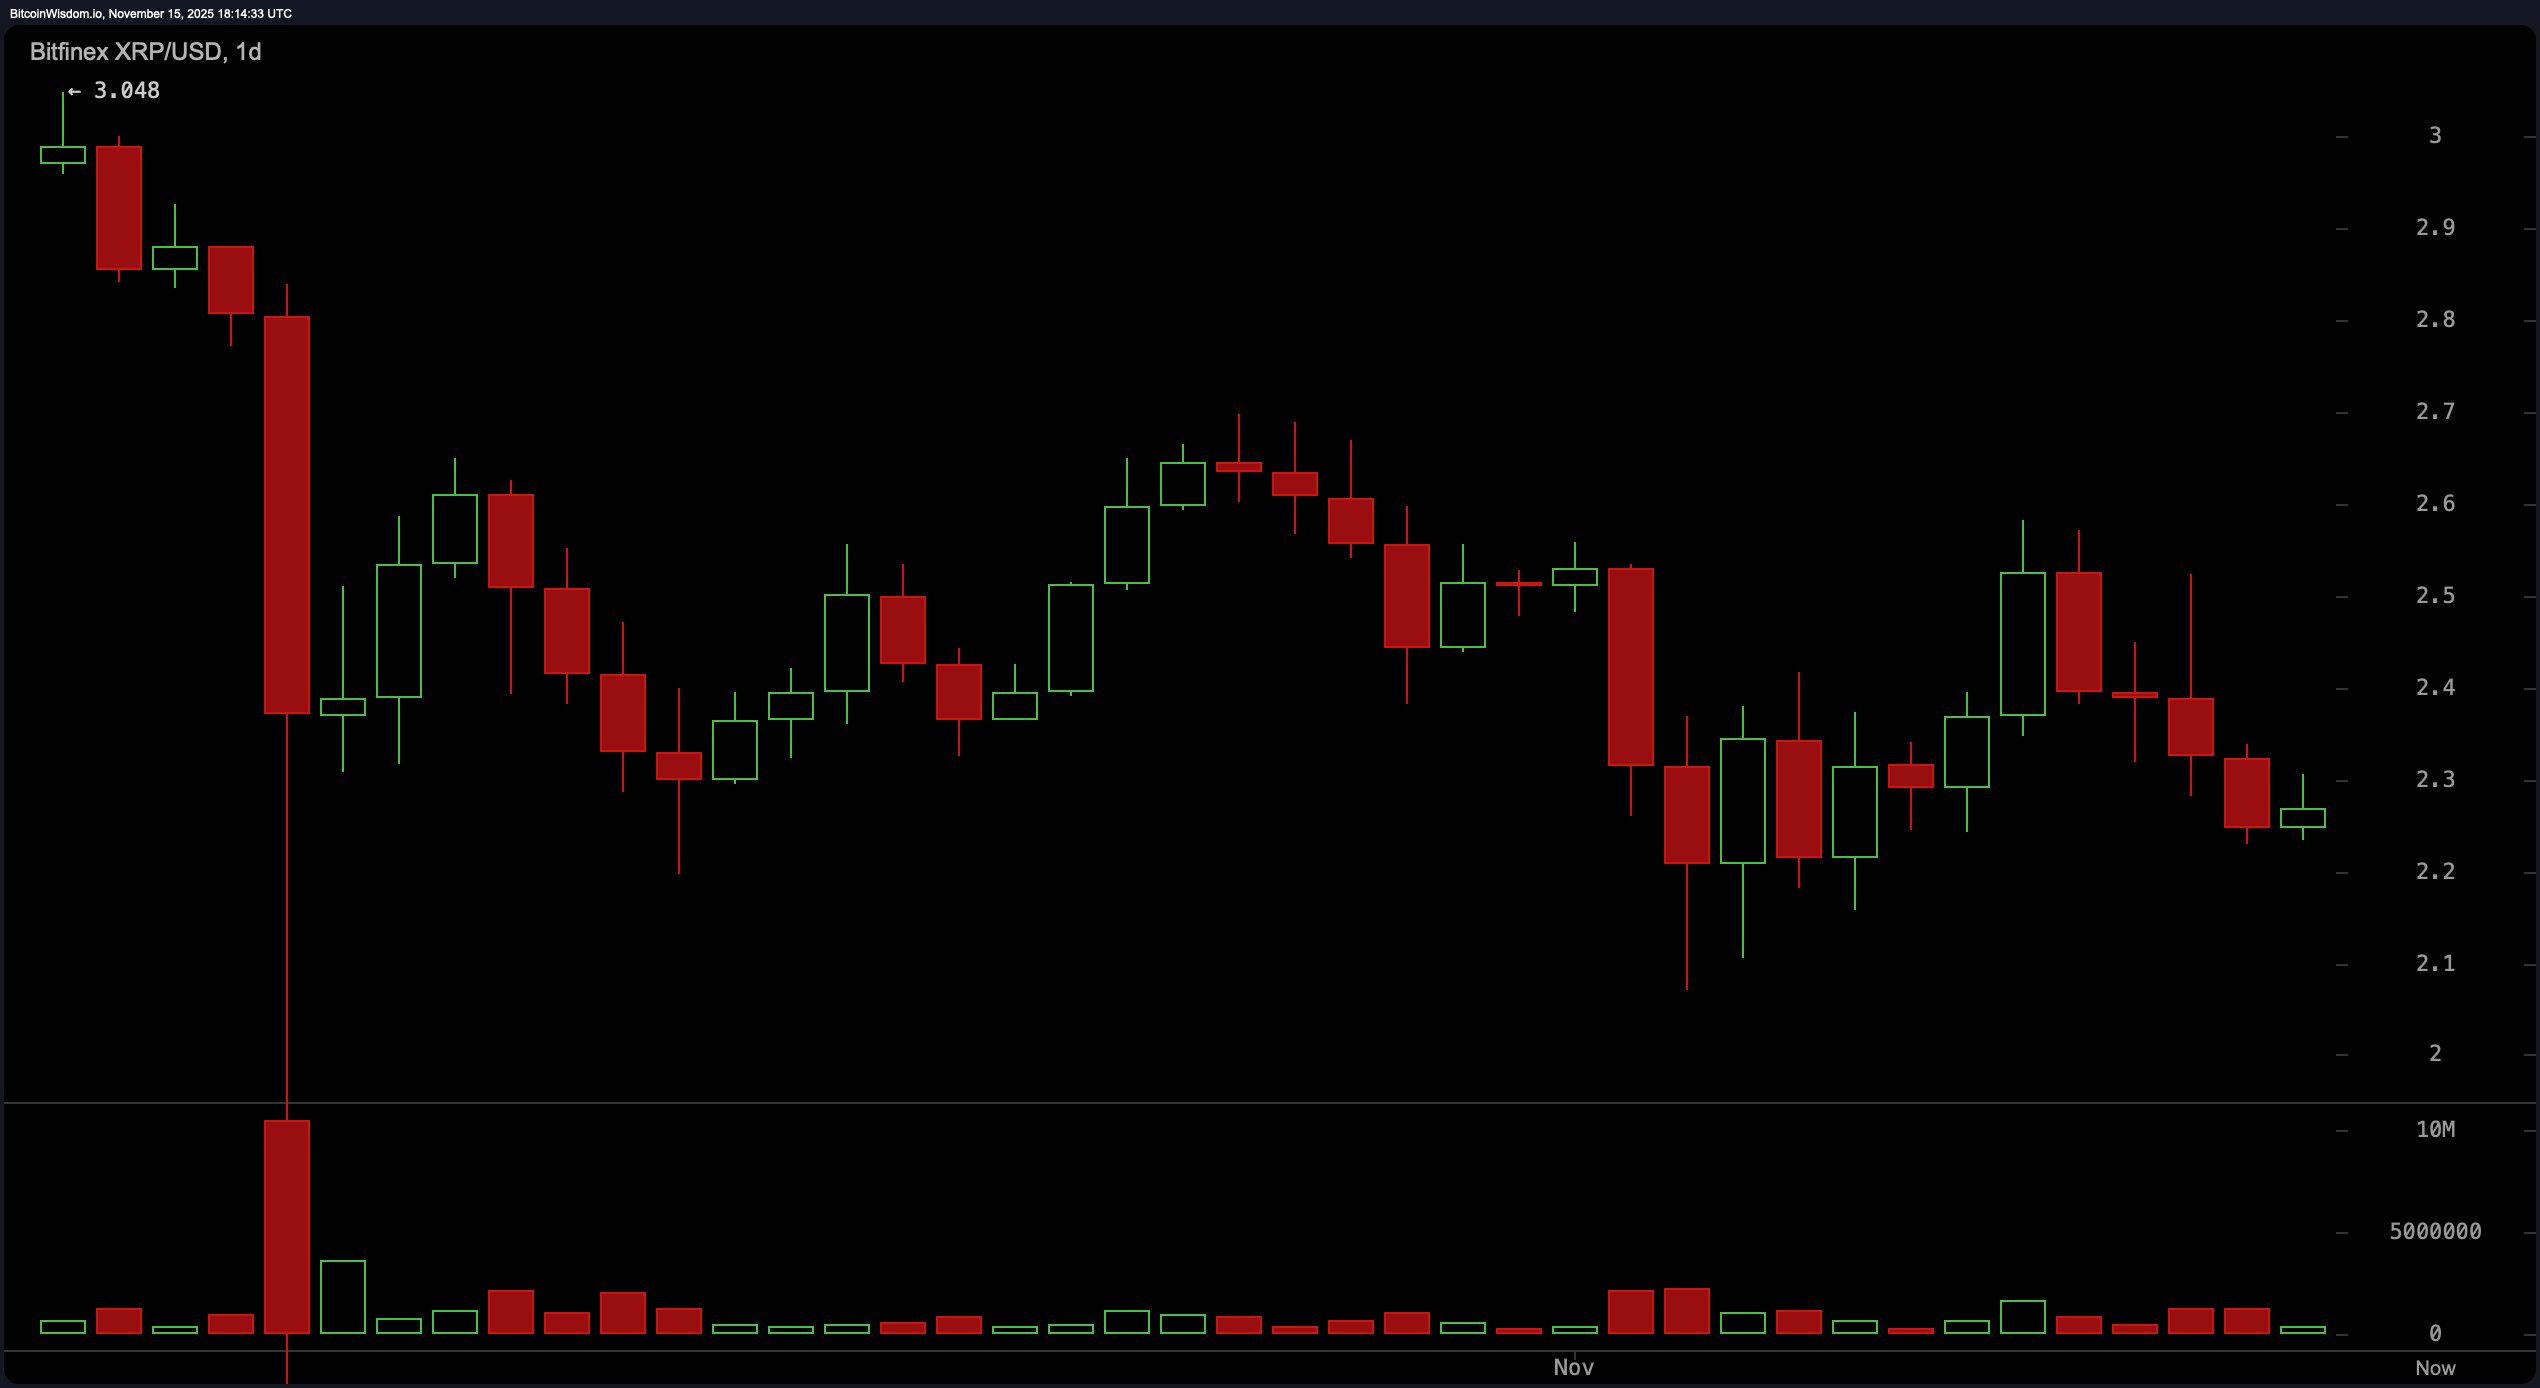
2025年11月15日通过Bitfinex查看的XRP/USD日线图。
将视角转向4小时图,XRP一直在形成一系列更低的高点和更低的低点,但过去几根蜡烛暗示着在2.25美元和2.30美元之间的逐渐压缩。这种挤压通常预示着价格的变动,如果多头感到兴奋,突破2.35美元可能会引发一些行动。从2.229美元的明显反转影线标志着该水平作为微观支撑,在1小时和4小时图上均可见。然而,成交量却在打盹,暗示交易者仍在决定是打哈欠还是大喊。振荡器也发出同样的哈欠:随机指标为40.8,商品通道指数(CCI)为−83.0,均显示中性,未给出强烈的信号。
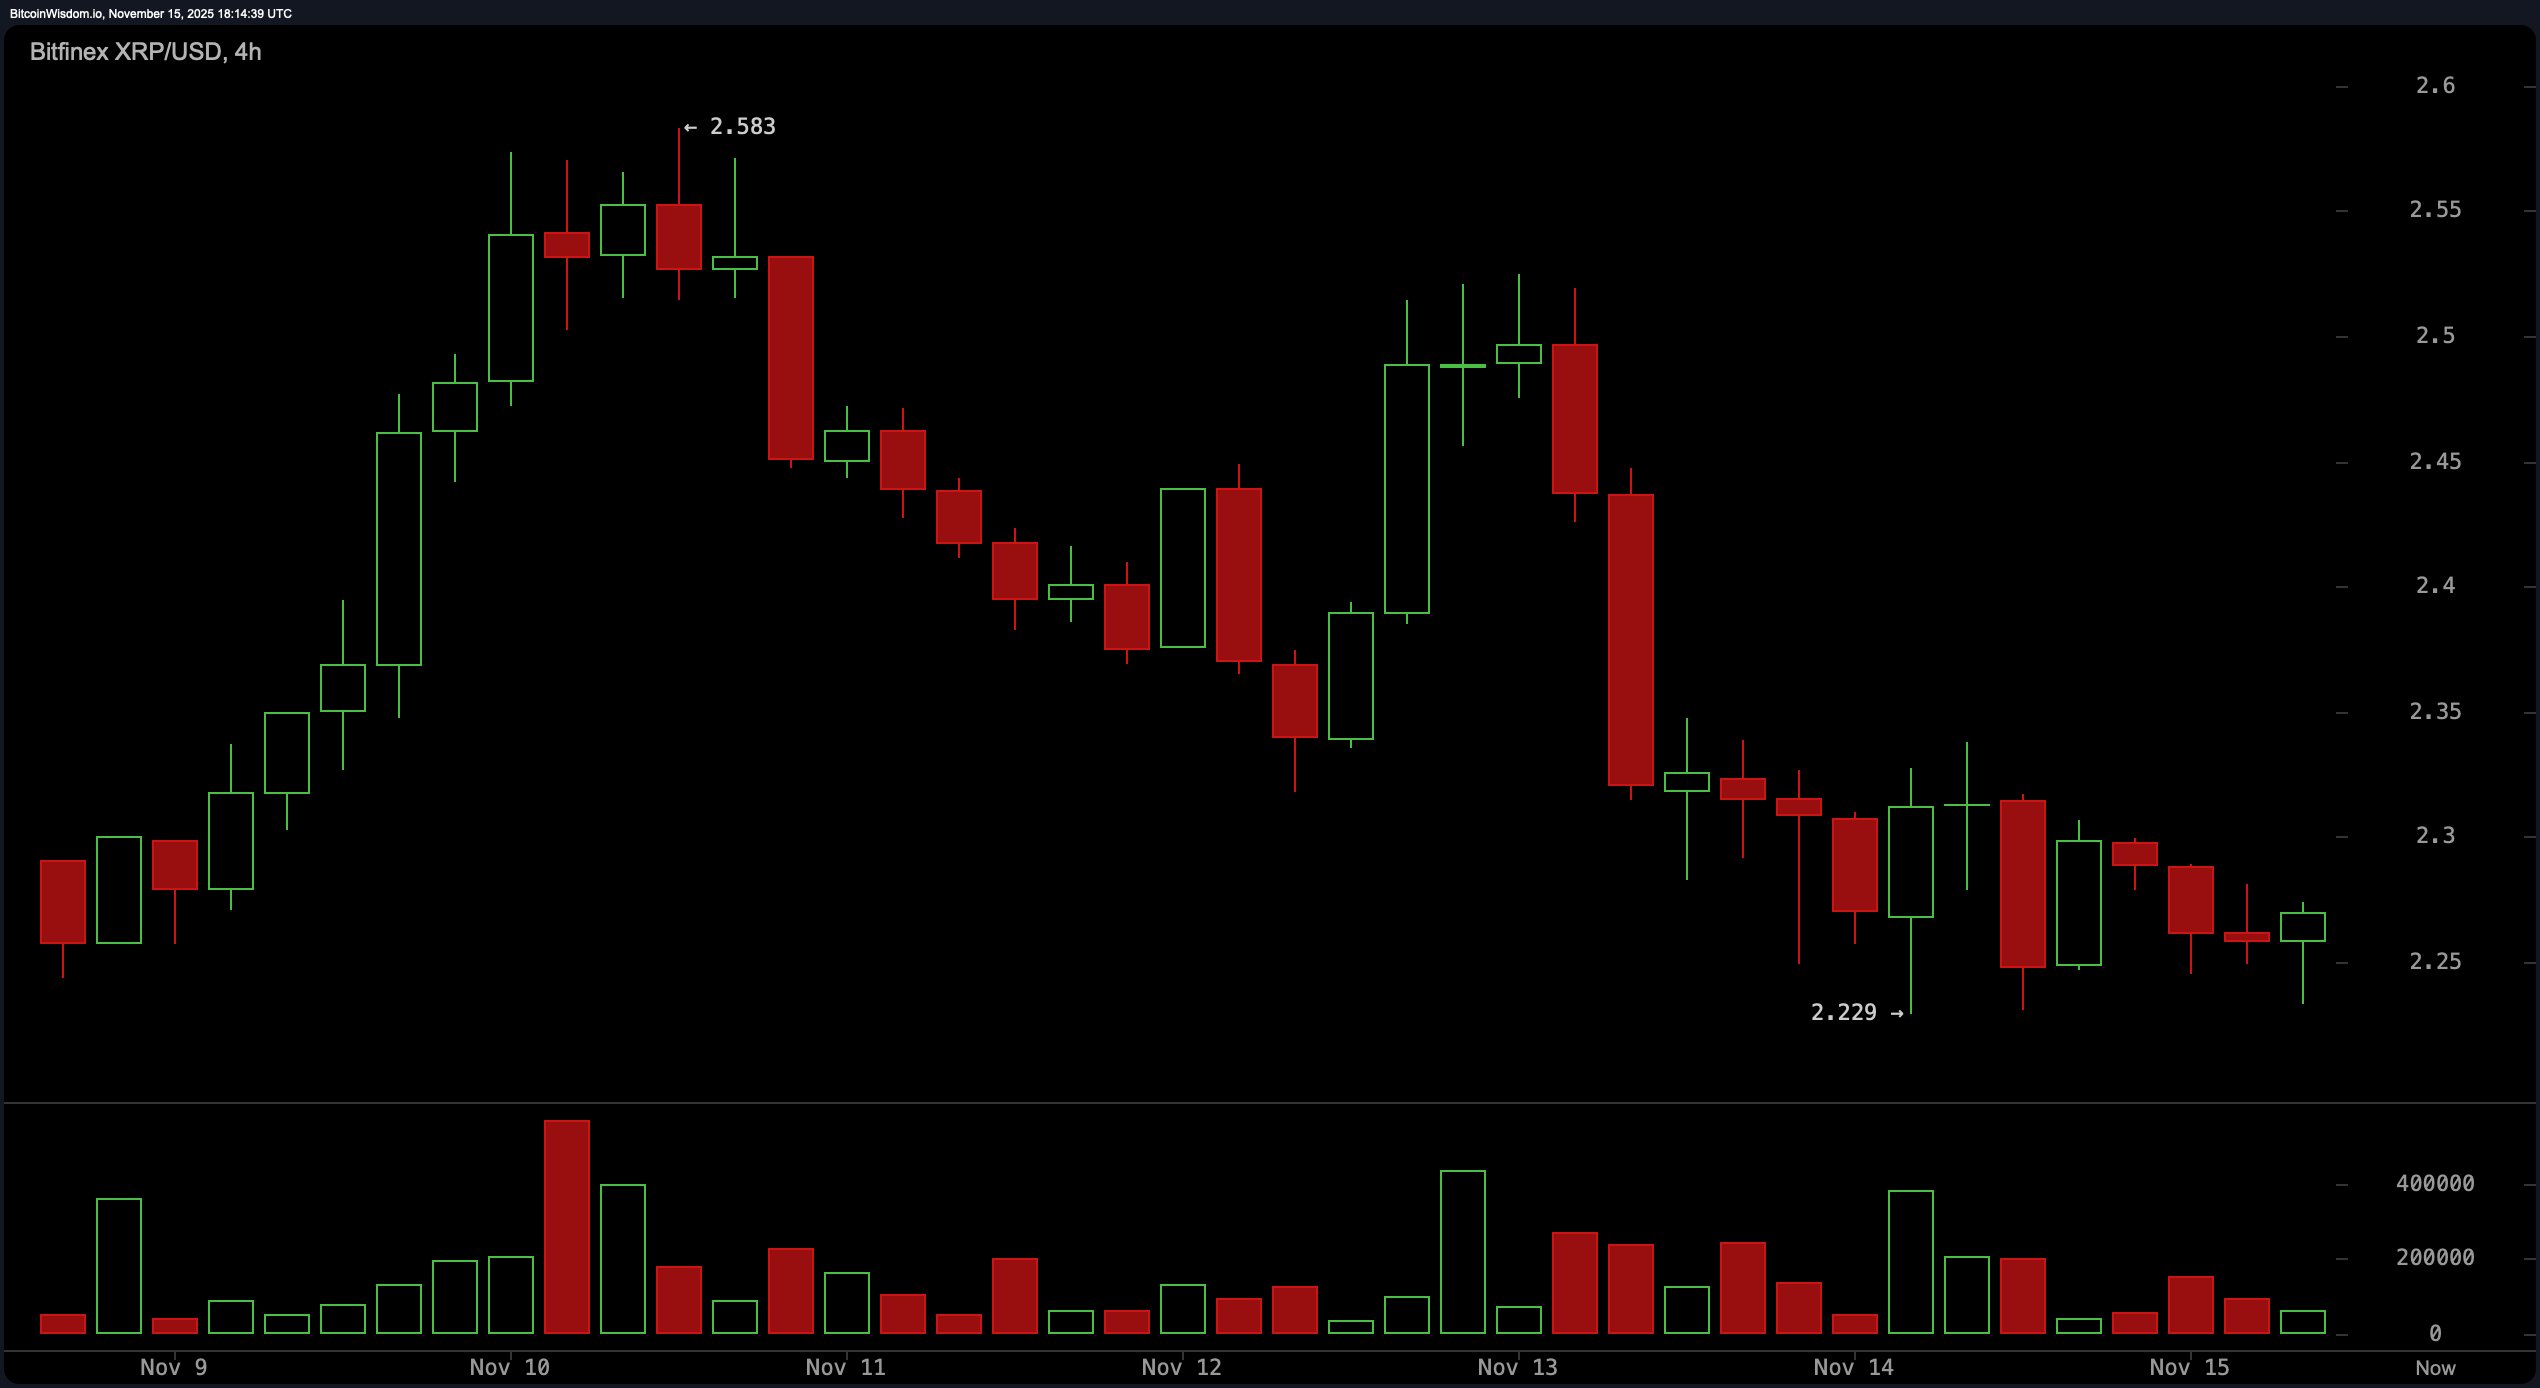
2025年11月15日通过Bitfinex查看的XRP/USD 4小时图。
1小时图增添了一丝戏剧性,可能在2.229美元形成双底——这个水平不容忽视。价格在这个微观结构内紧密盘整在2.26美元和2.28美元之间,成交量分析显示,尽管卖方仍在场,但他们明显感到疲惫。如果价格能够突破低成交量的束缚,这种形态可能有利于向2.33–2.35美元的推进。同样,指标的表现也不尽如人意:中性读数占主导,若没有成交量的激增,这更像是一场等待游戏,而非突破盛宴。对于寻求刺激的人来说,从2.26美元反弹并严格控制风险可能是唯一的选择。

2025年11月15日通过Bitfinex查看的XRP/USD 1小时图。
从移动平均线的角度来看,XRP的图表看起来像是一场下行趋势确认的游行。每一个短期、中期和长期的移动平均线——包括10到200周期的指数移动平均线(EMA)和简单移动平均线(SMA)——都显示出下行偏向。指数移动平均线(10)位于2.3347,而简单移动平均线(10)略低,为2.3307。甚至连最重要的简单移动平均线(200)也高高在上,位于2.6317,远高于当前价格,巩固了看跌的潜流。这是技术市场在说:“我们还没到达那里。”
总之,XRP在缓慢发展的加密戏剧中扮演着不情愿的主角。尽管在当前水平上有技术上的基础构建的低语,但大多数指标尚未对明确的方向性移动做出回应。振荡器大多处于中性,动量指标倾向于负面,移动平均线稳固地向下趋势,市场似乎在等待更响亮的信号。在此之前,XRP可能会继续像鹰一样在2.26美元的高地盘旋,观察下一步行动——谨慎、计算和神秘的安静。
牛市判决:
如果XRP能够在成交量的支持下果断突破2.35–2.38美元区域,多头可能会重新获得短期动能,并目标回归2.50美元甚至2.70美元。2.229美元的双底和所有时间框架内的缩窄区间暗示着潜在的跳板形态。动量背离和卖压减弱为看涨反转提供了足够的吸引力——如果火花点燃。
熊市判决:
随着每个主要移动平均线指向南方,动量指标闪烁着疲弱,熊市的案例在结构上依然完好。未能守住2.22美元将打开通往心理关口2.00美元的陷阱,几乎没有阻力来缓冲下跌。成交量的缺乏和坚实的看跌日线趋势使得多头处于借来的时间,除非出现明确的反转。
- 今天XRP的价格是多少? XRP的交易价格为2.26美元,比历史最高点下跌38%。
- XRP当前的市值是多少? XRP的市值为1360亿美元。
- XRP显示出看涨还是看跌的信号? 技术面目前倾向于看跌,但突破2.35美元可能会改变动能。
- XRP的关键支撑和阻力位是什么? 支撑位接近2.22美元,阻力位在2.35–2.50美元。
免责声明:本文章仅代表作者个人观点,不代表本平台的立场和观点。本文章仅供信息分享,不构成对任何人的任何投资建议。用户与作者之间的任何争议,与本平台无关。如网页中刊载的文章或图片涉及侵权,请提供相关的权利证明和身份证明发送邮件到support@aicoin.com,本平台相关工作人员将会进行核查。


