How the Crypto Market Cycle Shows Investor Psychology Each Month?
How does investor emotions drive the Crypto Market Cycle each month? Recently, Alex Mason, crypto-analyst shared a Wall st. Cheat sheet, explaining the psychology of a market cycle on X post (formerly twitter). Let’s understand the chart in detail.
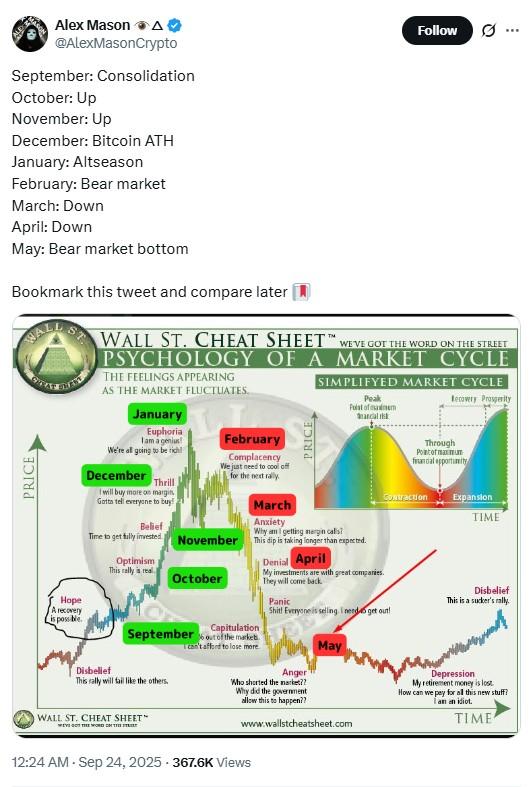
Source: X
September: Stabilization & Hope
September saw Bitcoin prices trading between 109k to 117k and currently it is trading at $111, 871k with a down of 0.62%.
Trading volume averaged $25 billion daily, indicating cautious optimism. Investors used this consolidation period to plan for potential uptrends.
Oct–Nov: Optimism & Rally
The graph predicts that the crypto market will start showing optimism again, as the Bitcoin soars resulting in the surge in prices of other coins like Ethereum, Solana and XRP.
Here you can plan to invest and November gives a belief that it is time to get fully invested, according to the crypto market chart.
December: Bitcoin Surge & Market-Thrill
December is showing Thrill behaviour, means investors can buy more on margin, and as many investors like Michael Saylor, Strategy CEO says every time is the right time to buy Bitcoins, as predictions say the prices are going to roar in the coming-time.
Bitcoin price rising in this month will lead to more buyings by the users and institutions which boosts the market-confidence and also Bitcoin ETFs inflows could also be seen on a regular basis.
January: Euphoria & Altseason
So, according to Wall St. Cheat sheet, it is the peak time when the crypto market will see huge rise and it might happen that Global Investment manager, VanEck’s prediction comes true that is the asset could soar $180k by the year end.
Whereas, Analyst Steven forecast that the coin will rise up to $150k. Crypto watchers are watching it closely, it is still a question whose prediction will come true.
Feb–Mar: Anxiety & Cooling
And after seeing a huge rise the chart predicts that in these months the market again starts cooling, a short dip could be seen in Digital Gold and Altcoins.
The time-might give anxiety and the dip could be for a longer period of time, until the next upward signal is seen.
Apr–May: Capitulation & Market Bottom
Acc. to the graph, at this stage it might happen that investors start selling their Bitcoin again without holding it, it might lose the Investors confidence like September.
Whereas strong Institutional buyings might maintain their trust over it like, Strategy, MARA Holdings, Coinbase and Blackrock. As many see the dips as a sale .
Recovery & Opportunity
Although, the graphs showing a downfall in may, it doesn’t mean that it won’t rise again. The data shows, again the graph will show the same curves as lead towards optimism.
Conclusion
Crypto prices follow a cycle driven by investor emotions—from hope and optimism to euphoria, anxiety, and capitulation. Recognizing these patterns can help investors time their moves and plan strategies.
Disclaimer: This news article is for informational purpose only. Traders are adviced to do their own research before investing and trading on any platforms
免责声明:本文章仅代表作者个人观点,不代表本平台的立场和观点。本文章仅供信息分享,不构成对任何人的任何投资建议。用户与作者之间的任何争议,与本平台无关。如网页中刊载的文章或图片涉及侵权,请提供相关的权利证明和身份证明发送邮件到support@aicoin.com,本平台相关工作人员将会进行核查。


