With Ethereum struggling, Shiba inu and XRP are following the rest of the market. The new descending channel on XRP, the secret triangle formation on ETH and the poor performance of SHIB shapes the negative outlook of the market over the weekend.
Ethereum's secret triangle
Around the $4,530 mark, where a sizable symmetrical triangle has been forming for the past few weeks, Ethereum (ETH) is currently sitting on a crucial price signal. One of technical analysis’s most dependable volatility setups is this consolidation structure, and how it resolves may determine Ethereum’s next significant move.
After a daily decline of -2.9%, ETH is currently trading at about $4,454. The 50-day and 100-day exponential moving averages (EMAs) are serving as strong support layers, as the coin is rising above its key EMAs, which are at $4,322 and $3,800, respectively. Ethereum appears to be neither overbought nor oversold according to the RSI, at about 54, which puts the market in a balanced position for a significant break.
HOT Stories Binance’s CZ Says France Has 'Gone Downhill'XRP Price Prediction: What ETF Means for Third-Largest Cryptocurrency "Dogecoin to the Moon?" Top Meme Coin Trader Reveals $1 DOGE Price PredictionSecret Ethereum (ETH) Price Signal at $4,530, New XRP Price Range to Reveals Next Price, Shiba Inu (SHIB) Losing $0.000013
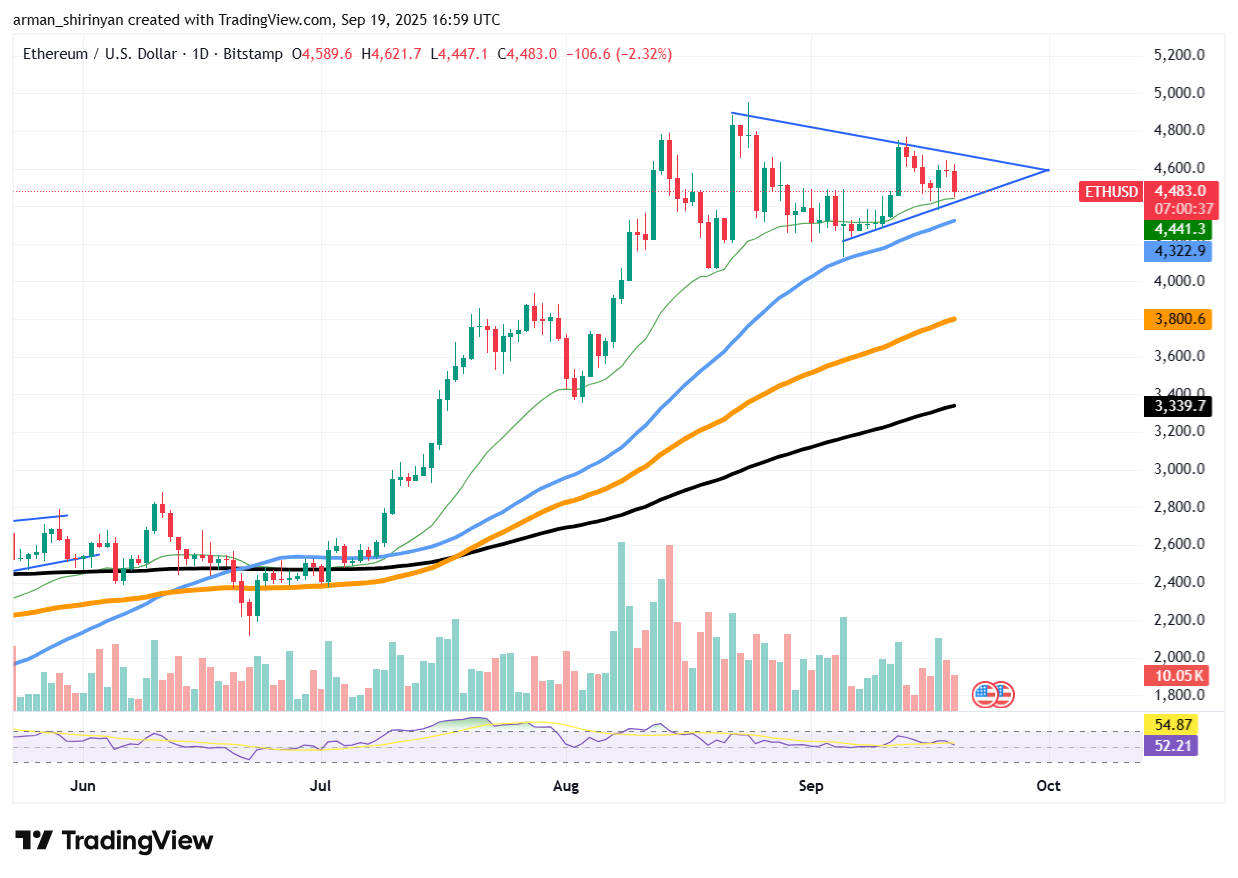
ETH/USDT Chart by TradingView
In the triangle pattern, compressed volatility is highlighted. ETH has historically generated explosive momentum when it coils inside such constricted structures. The $4,530 zone, where the triangle’s upper resistance converges, is the area that traders are keeping a careful eye on. If there is a clear breakout above this level, short liquidations and fresh institutional inflows into ETH-based products could trigger a rapid move toward $5,000 and higher.
Conversely, the inability to maintain the triangle’s lower boundary, around $4,400, might validate a brief downward trend. This situation might push ETH back toward $3,800, the 100-day EMA, which has historically protected against significant corrections.
The timing, rather than the pattern itself, is what makes this setup secret. While Bitcoin has been making headlines, Ethereum has been consolidating. However, the triangle formed by ETH suggests that the altcoin market may be preparing for a volatility implosion, which, if it gains traction, could lead to a wider rally.
XRP's momentum disappears
XRP has failed to maintain momentum above short-term resistance and is currently trading at about $3.00, indicating weakness. There is a distinct descending channel on the chart, which frequently indicates bearish continuation. As XRP consolidates within this smaller range, traders should brace themselves for possible downside volatility.
Two short-term support levels are the 50-day EMA at $2.99 and the 100-day EMA at $2.98. Bulls may be losing control, though, if they are unable to break through the descending trendline resistance. If XRP breaks below these clustered EMAs, the 200-day EMA at $2.83 will be the next target for a decline. If XRP drops sharply below this level, it may signal a more significant correction and move closer to the $2.58 region, which was a good place to accumulate earlier this year.
On the upside, the bearish channel and signal strength would need to be invalidated by a move above $3.20. The RSI is currently between 51 and 53, indicating a lack of strong buying momentum, so the bias is still leaning toward sellers until that time.
Given the bearish channel structure, XRP’s most likely price range in the near future is between $2.83 and $3.20, with a probability bias toward testing lower levels. If sentiment on the market worsens, XRP may fall back into the mid-$2.50s, where long-term buyers might reenter.
To sum up, XRP is stuck in a channel that is getting narrower, which usually happens before a significant move.
Shiba Inu loses key level
The $0.000013 threshold, a crucial psychological and technical level that should be monitored, has been breached once more by Shiba Inu. This breakdown shows how SHIB’s market structure is becoming weaker, which raises the possibility of a more severe decline in the near future.
The most concerning indication, in this case, is that SHIB’s moving averages have not offered any significant support. The 100-day and 50-day EMAs, which frequently serve as stabilizing zones on markets that are consolidating, have not held up. Instead, there appears to be bearish dominance, as price action has been consistently breaking below these averages. There is not much upside momentum left for SHIB to rely on because the 200-day EMA is positioned close to $0.0000138 and serving as a ceiling.
A narrowing triangle structure is also visible on the chart, with SHIB moving toward the lower boundary at about $0.0000128. A quicker sell-off could be triggered if this floor gives way, pulling the token in a longer correction toward $0.0000120 or even the $0.0000110 region. The declining RSI, which is currently hovering slightly above the neutral zone, indicates that buyers are retreating, giving sellers more space to exert control.
The outlook in the near future is still cautious. The market may be viewing $0.000013 as resistance rather than support if it loses that level but is unable to reclaim it decisively. This means that the path of least resistance remains downward until SHIB closes above both $0.000013 and the clustered EMAs.
Right now, the market is entering a weekend trading session on a negative note, which means volatility and liquidity will get even thinner and potentially cause a foundation for a bearish rally on the market.
免责声明:本文章仅代表作者个人观点,不代表本平台的立场和观点。本文章仅供信息分享,不构成对任何人的任何投资建议。用户与作者之间的任何争议,与本平台无关。如网页中刊载的文章或图片涉及侵权,请提供相关的权利证明和身份证明发送邮件到support@aicoin.com,本平台相关工作人员将会进行核查。


