With its price resting on a support trendline, and momentum waning, XRP is approaching a critical phase as technical indicators generate conflicting signals. With an ascending diagonal pattern, and the 50-day EMA defining a key support zone, the asset is currently trading at about $2.87.
The Relative Strength Index provides a different narrative. A bearish divergence has been formed by the RSI’s downward trend over the past month, even though XRP’s price has maintained higher lows. If support fails, this kind of setup frequently portends possible breakdowns and indicates waning buying momentum.
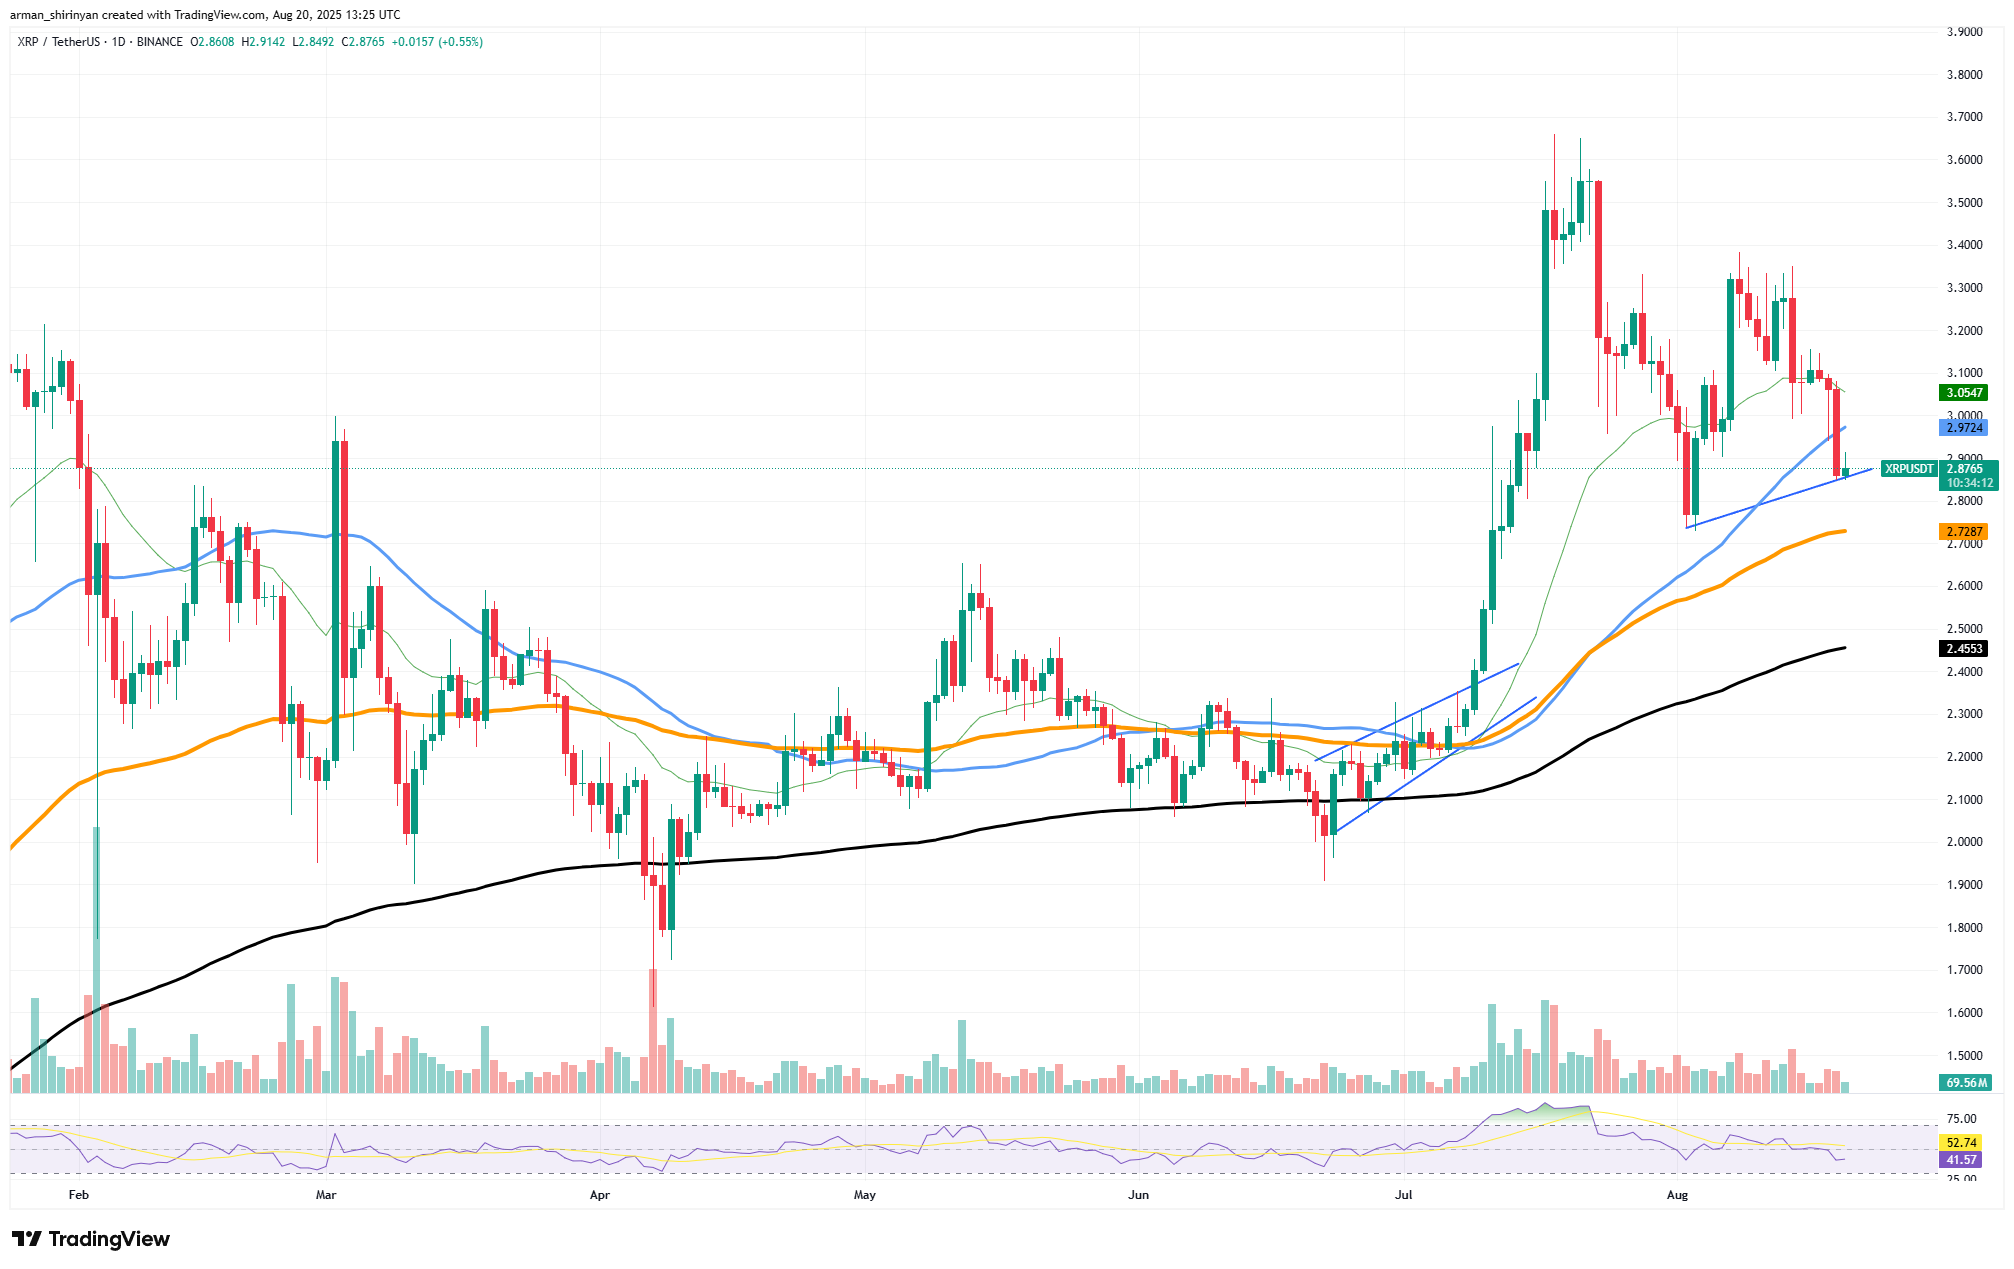
XRP/USDT Chart by TradingView
The RSI, which is close to 41, suggests that XRP is getting close to oversold territory, but if there is not any new volume, the divergence may continue into more significant corrections.
HOT Stories CEO of Largest US Crypto Exchange Stuns with $1 Million Bitcoin Price PredictionXRP Paints Critical Divergence, Dogecoin (DOGE): Last Chance, Explosive Solana (SOL) Rally Now?XRP Golden Cross Flip, Shiba Inu Rockets 699,000% in Liquidation Imbalance, Bitcoin Risks Losing $100,000 — Crypto News DigestScaramucci Compares Crypto to Uber
In addition to the cautious outlook, trading volume has been declining steadily since the peak in July, which was around $3.70. This decline in participation shows that bulls are becoming less confident, which makes XRP susceptible to more aggressive movements should selling pressure pick up speed.
Historically, either breakdowns or sharp rebounds have been preceded by declining volume during consolidation phases; however, given the divergence, the bias is more toward downside risk.
XRP must protect the $2.80-$2.78 range in the near future. A strong decline toward $2.45, the level that the 200-day EMA supports, might be triggered by a clear break below.
Dogecoin rises above
The asset is currently trading at $0.212, just above a support zone intersection that includes the 200-day EMA, and an upward trendline that dates back to July. Although price action indicates waning momentum, and the potential for the final support level to give way soon, this alignment has so far served as a safety net for DOGE.
Every time the ascending trendline has been tested in the last two weeks, lower highs have been produced, indicating a waning of buying pressure. The volume has been decreasing at the same time, indicating that market players are not as dedicated to holding DOGE at these levels.
You Might Also Like
Wed, 08/13/2025 - 20:48 BTC, ETH, and SOL Targets Defined by Top AnalystByAlex Dovbnya
With a neutral-to-weak momentum reading of 46, the Relative Strength Index (RSI) does not exhibit a strong oversold or recovery signal.
A clustering of moving averages below Dogecoin’s price is a risk. Even though EMAs are frequently used as dynamic support, they are more prone to break under pressure if they converge more in a weakening setup.
The next obvious supports are far below, at about $0.20 and $0.18, if DOGE breaks the ascending trendline. With fewer high-volume nodes in the current range to absorb selling, such a break would probably cause a steeper decline.
Conversely, the first upside target is still $0.226, which is followed by $0.24, where DOGE has previously failed to maintain momentum, if it is able to hold this level and produce a bounce.
But unless buyers come back in large numbers, this is probably just a short-term respite rather than the beginning of a long-term rally.
Solana's ascent
Its price is situated directly on an ascending trendline that has been driving its bullish momentum since July. As long as this technical structure holds, there is hope for one more leg upward. Nevertheless, there are some issues with the setup, because volume and momentum indicators present a more cautious picture.
The way that the moving averages interact with Solana’s current chart is one of its main advantages. The major EMAs have converged after months of divergence, offering a robust cluster of dynamic support below the price. This alignment frequently indicates that the trend is structurally stable, providing buyers with a buffer against any short-term weakness.
You Might Also Like
Wed, 08/20/2025 - 13:11 XRP Millionaires Cash out Over $1,000,000,000 as XRP Price Loses $3ByGamza Khanzadaev
SOL is cooling off rather than overheating, as indicated by the RSI’s downward trend. Resetting can create room for a subsequent rally in a bullish environment without running the risk of overextending. As a result, Solana is less susceptible to sudden severe corrections than assets that are deeply overbought.
However, the largest obstacle to the rally narrative is volume. The price remains close to critical support, but recent trading sessions show waning participation and declining bars. If volume is weak, any possible breakout above $190-$200 might not have the conviction required for long-term momentum.
It will be crucial in the upcoming weeks if Solana can hold onto the rising trendline. An explosive rally toward $210-$220 is possible if buyers enter the market with fresh volume. A breakdown below $173 and $170, on the other hand, would render the bullish structure invalid, and probably lead to a more significant correction toward $160.
免责声明:本文章仅代表作者个人观点,不代表本平台的立场和观点。本文章仅供信息分享,不构成对任何人的任何投资建议。用户与作者之间的任何争议,与本平台无关。如网页中刊载的文章或图片涉及侵权,请提供相关的权利证明和身份证明发送邮件到support@aicoin.com,本平台相关工作人员将会进行核查。


