币圈市场的波动犹如汹涌大海中的波涛,让人心惊胆战。但是它的魅力就在于它从不看你过去的成绩单。别总说 “等市场稳定了再入场”,加密世界的机会从来不在 “稳定” 里。真正的红利,永远属于那些在不确定性中敢于布局的人。市场波动不是风险,看不懂趋势才是最大的风险。
大饼现价处于114400美元附近,处于4月以来的上升通道中位。近期从123800美元高点回调后,在111950美元上方企稳,未破坏长期牛市结构。链上数据显示,35.1万枚大饼在112000-114000美元完成换手,夯实底部支撑;但117000-118000美元为关键阻力,未突破前可能回撤。
技术方面来看,近期上方阻力位处于115200美元(EMA集群)与116500美元(斐波那契R3)构成强压制,突破需放量。下方支撑位处于112800美元(流动性密集区)及111950美元(多空分界线),失守则可能测试110000美元。短期还是处于震荡格局,4小时图显示布林带收窄后略微扩张,MACD动能疲软,RSI中性(41.82),需关注突破或回调信号。
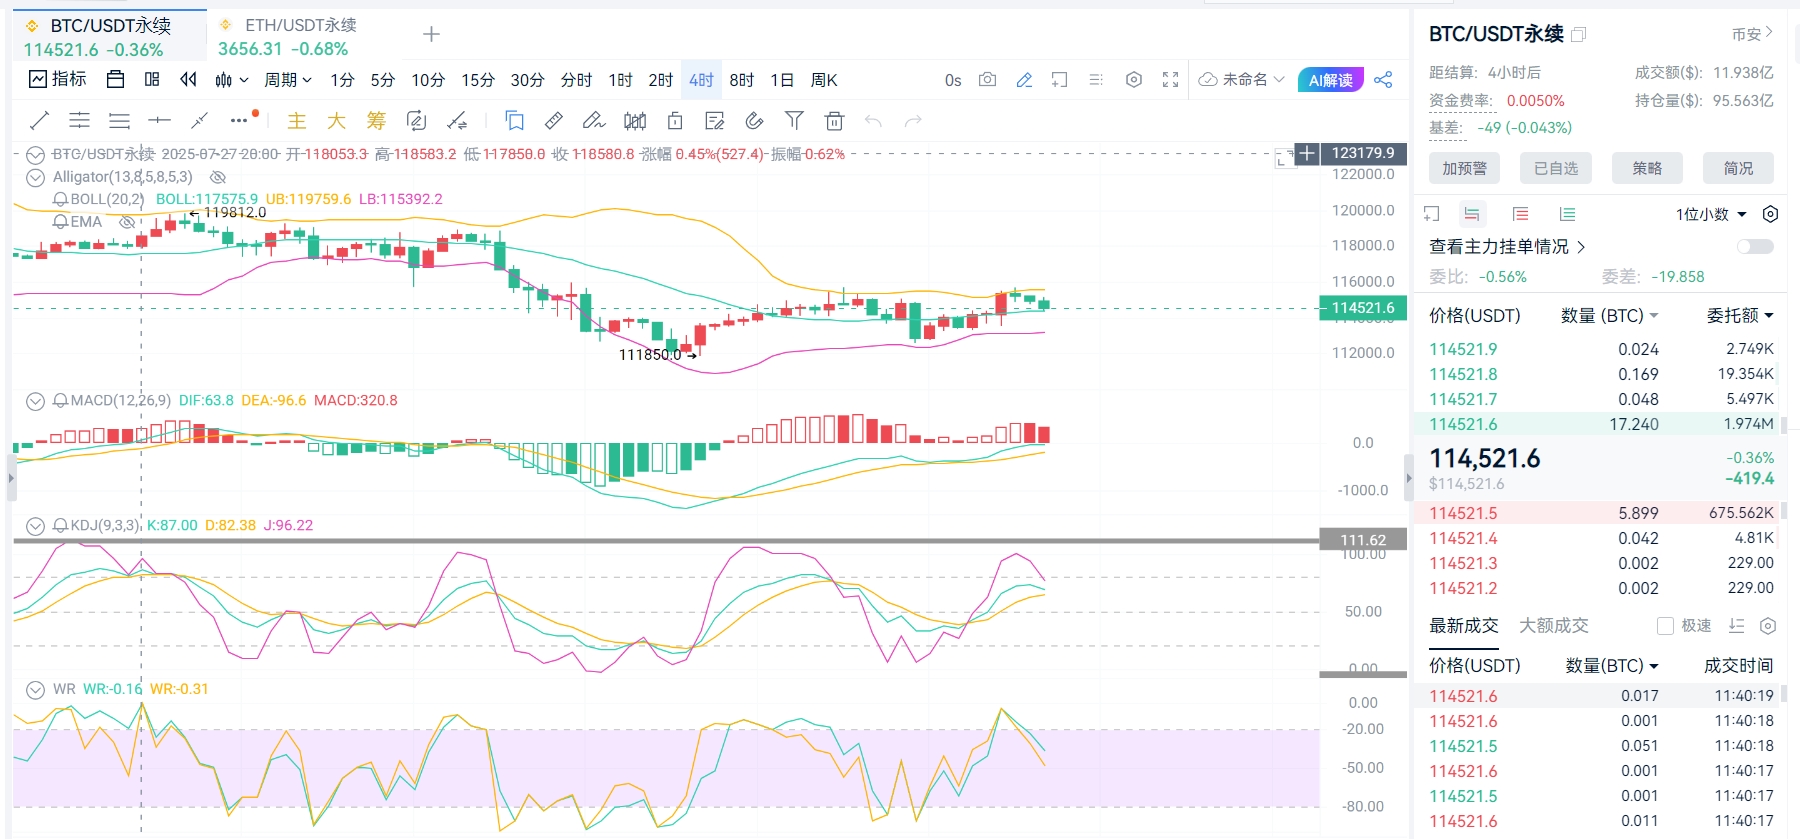
多单操作区间建议:112500-112800美元附近企稳可进场做多,止损111900美元。目标114500-115200美元。
空单操作区间建议:115200-115500美元附近承压可进场做空,止损116500美元,目标113500-114000美元。
姨太当前价格在 3550-3700美元区间波动,现价处于3650美元附近4小时图形成对称三角形(顶点3700美元,支撑3530美元),逼近形态突破临界点。
技术面来看,上方第一阻力位处于3700美元(三角形上轨)与3800(前高),若价格突破3700并且站稳的情况下将打开上行空间。下方第一阻力位置处于3580美元,第二阻力位置处于3450美元,若跌破3550美元支撑,可能回踩3400美元。技术指标显示,4小时图布林带收窄预示波动加剧,MACD无方向,RSI中性,等待催化剂。
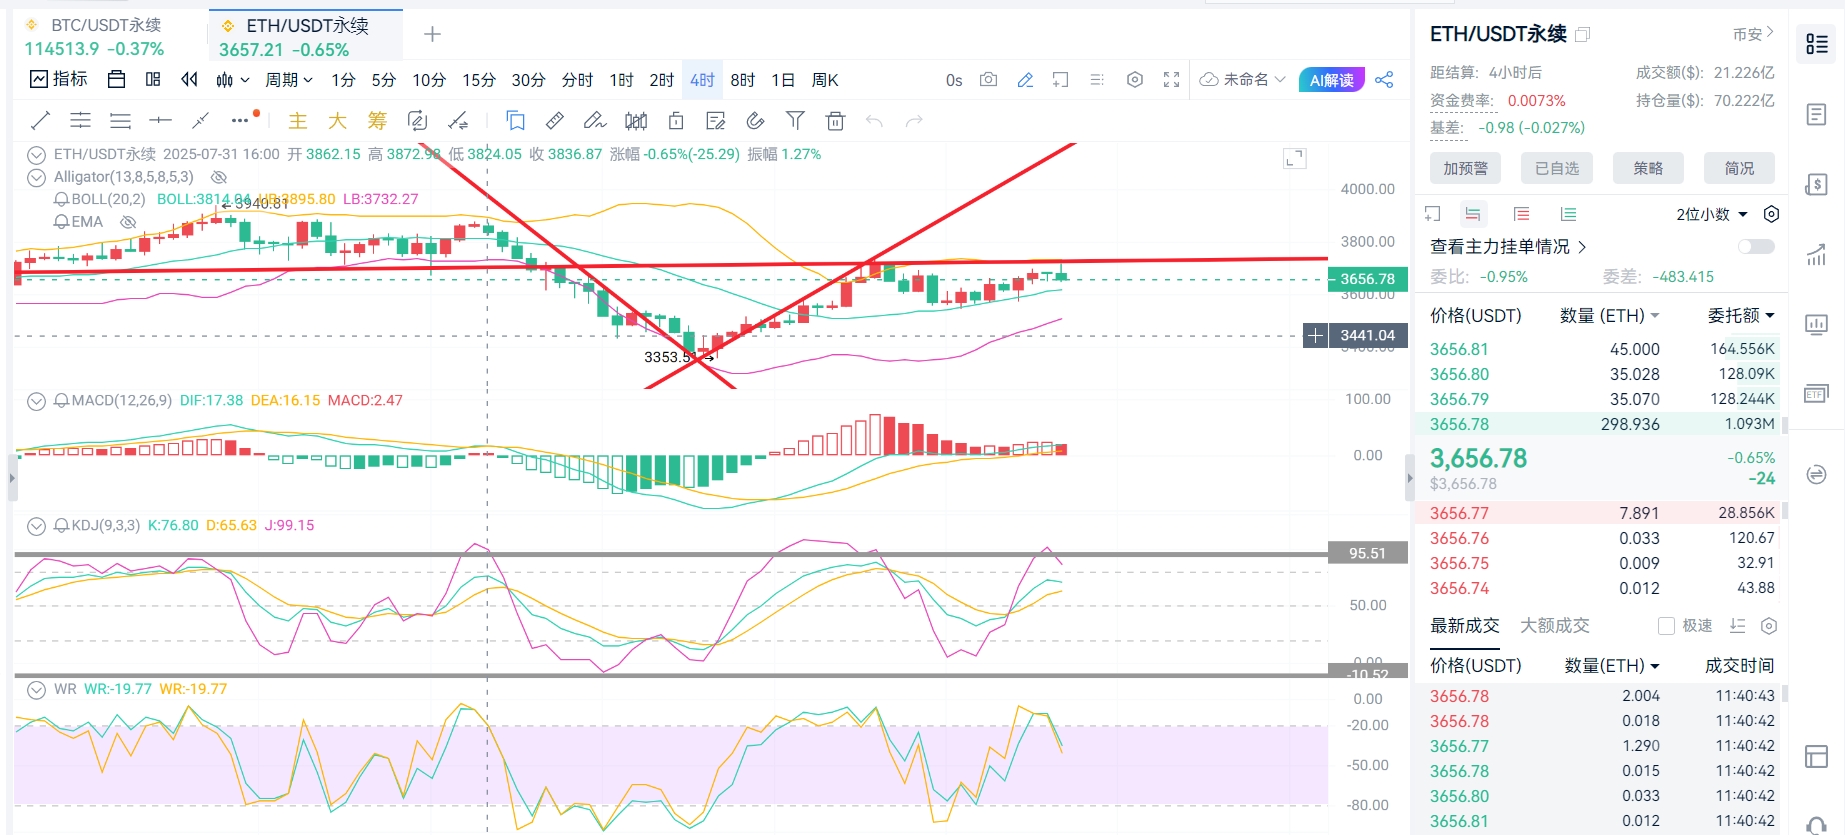
多单操作区间建议:3580美元附近企稳可进场多单,目标看3700美元,止损3530美元。
空单操作区间建议:3650美元附近承压可进场空单,目标看3520美元,止损3700美元。
若放量突破3700美元,可看多至3800美元;若失守3530美元,可能下探3350美元。 BTC突破115200美元或ETH站上3700美元可加仓;反之跌破关键支撑则离场观望。
当前市场处于“短期阵痛”与“长期价值重构”的分水岭,建议以高空低多波段策略为主,优先关注ETH相对强势机会,并紧盯政策与资金流拐点。
因价格点位具有时效性,帖子审核有延迟,具体操作还是实时行情为主。以上述操作区间分析仅供参考,加密货币市场风险高,做好风控,希望你在投资时谨慎决策。若你对特定指标分析或市场新动态对价格影响感兴趣,可随时扫描下方文章的公众号二维码,欢迎来访。

温馨提示:以上文章内容为笔者原创,文章末尾及评论区广告均与笔者无关,请注意甄别!
免责声明:本文章仅代表作者个人观点,不代表本平台的立场和观点。本文章仅供信息分享,不构成对任何人的任何投资建议。用户与作者之间的任何争议,与本平台无关。如网页中刊载的文章或图片涉及侵权,请提供相关的权利证明和身份证明发送邮件到support@aicoin.com,本平台相关工作人员将会进行核查。


