Why Bitcoin Is Falling: Will Technicals Drag BTC to $102K Next?
Bitcoin is experiencing downward pressure in price once again, moving from around $110,000 to just above $107,000 since yesterday. With a daily decline of 2.4%, traders are starting to ask an important question across markets; why Bitcoin is falling today?
There are several layers to the answer, but it starts with an important failure at the Bitcoin resistance $110,000. This eventually led to extreme long position liquidation waves, and value began pushing lower.
Thus, let’s look at some of the main reasons behind why Bitcoin is falling today .
Failed Breakout at $110K Resistance
It has consistently faced the $110K resistance since the start of its rally in late May. This level matches a prior multi-week high and holds significance both psychologically and technically.
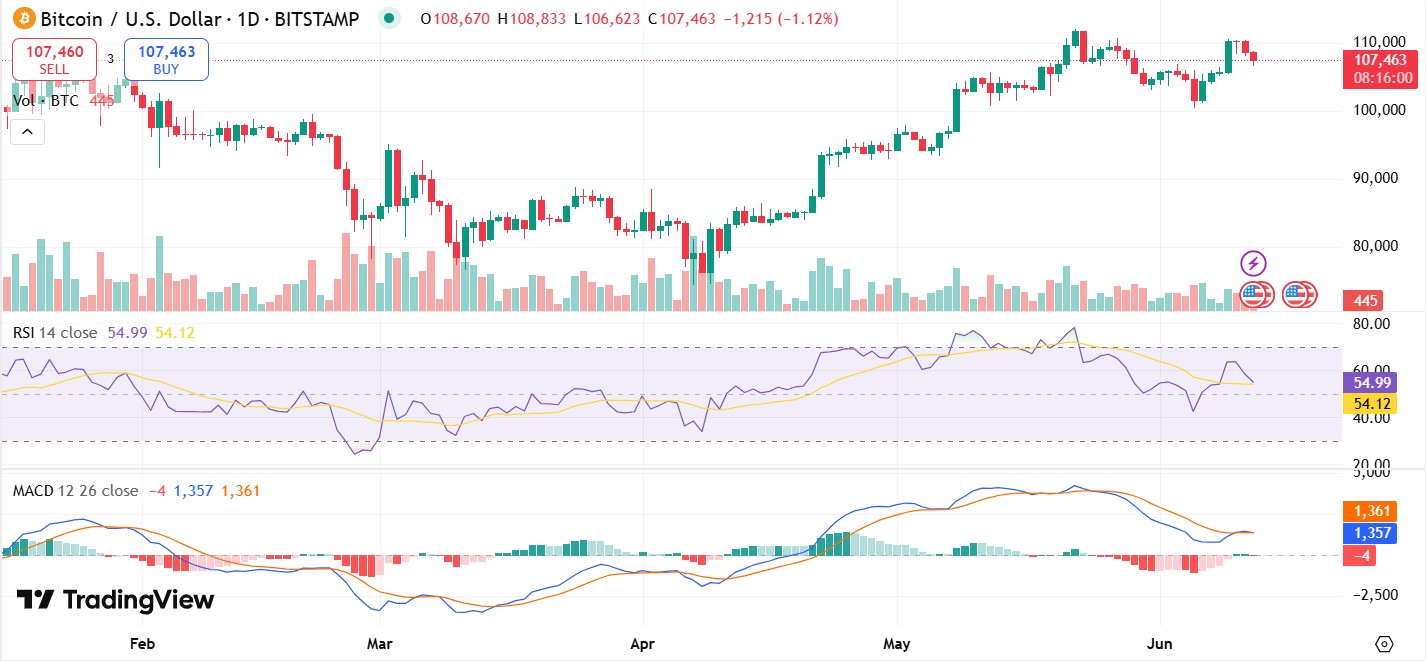
According to TradingView technical data, the rejection occurred near a key Fibonacci extension and resistance trendline. Momentum indicators like RSI (54.99) and MACD showed weakening strength just before the reversal.

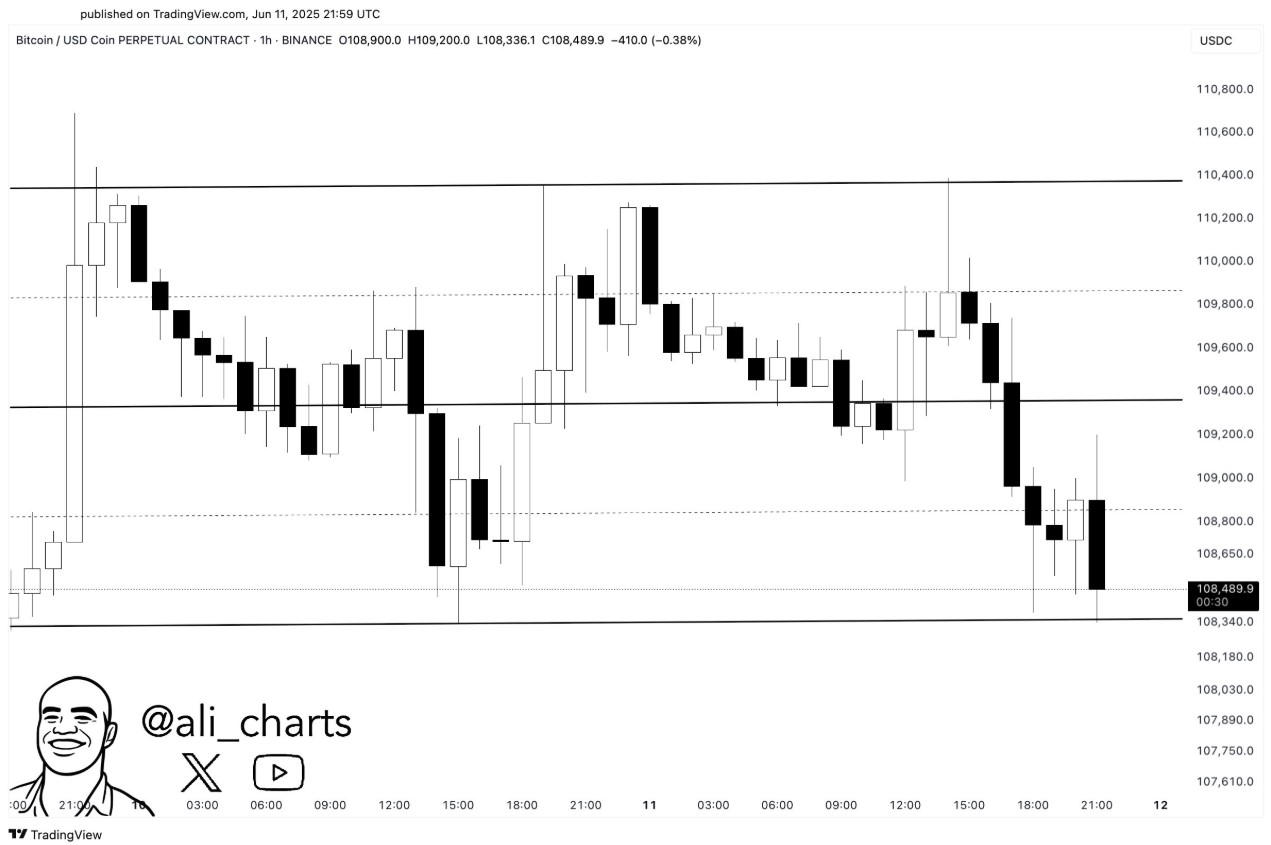
Source: Ali Martinez X
“It must hold $108,300 to maintain bullish momentum. If it loses this level, it could drop to $107,000 or lower,” said analyst Ali Martinez on X.
That prediction came true within hours, as this currency reversed sharply to current levels.
$323 Million in Long Liquidations
One of the most powerful drivers of the current drop is the liquidation spiral in its derivatives market. According to data by CoinGlass, over $323 million worth of long positions were liquidated within 24 hours.
This Bitcoin latest news explains why the Bitcoin price drop started to become aggressive after the initial price rejection
Volume data supports this caution:
-
Trading volume declined by 2.42% in 24 hours.
-
The global market cap dropped by 2.38%, indicating a broader selloff.
The combination of resistance failure, liquidations, and cooling sentiment all point toward a short-term consolidation or correction phase.
Technical Indicators Turning Bearish
According to the chart from TradingView 1D timeframe, BITSTAMP:

Source: TradingView
-
RSI is at 54.99, which means it isn’t overbought or oversold — but momentum is starting to weaken.
-
MACD shows early bearish signs — the trend is losing steam as the red bars appear, which usually hints at a possible down move.
-
It is facing resistance near $110,000, where it keeps getting rejected.
-
If it drops below $106K with strong selling, prices could fall further to $104.8K or even $102K, where the next strong support lies.
Whale Movements and ETF Inflows: A Mixed Signal
Interestingly, despite the current drop, some institutional signals remain bullish. Blockchain data from Lookonchain reveals that a whale wallet linked to AguilaTrades moved $29.85 million in USDC from Bybit to Hyperliquid to go long on this crypto king — just before the drop.

Source: Lookonchain
Meanwhile, its ETF activity remains strong: Net inflows of 1,413 BTC in the past 24 hours
This contrast between short-term traders exiting and institutions buying the dip may suggest a fundamental floor forming around $106K–$104K.
Conclusion: Why Bitcoin Is Falling — And What to Watch Now
To sum it up, Bitcoin is falling today due to a classic combination of resistance rejection, long liquidations, fading sentiment, and cooling momentum. However, strong ETF inflows and whale accumulation show that long-term conviction remains intact.
If you’re asking how much will it fall, the answer lies in how it behaves around $106K. A strong defense here may stabilize the market. A breakdown? We may be heading toward a deeper reset.
Stay tuned. This zone could decide whether its next move is back toward ATH or down into correction territory.
Also read: CEX.IO Power Tap Daily Quiz Answer Today 13 June 2025: Win Big!v免责声明:本文章仅代表作者个人观点,不代表本平台的立场和观点。本文章仅供信息分享,不构成对任何人的任何投资建议。用户与作者之间的任何争议,与本平台无关。如网页中刊载的文章或图片涉及侵权,请提供相关的权利证明和身份证明发送邮件到support@aicoin.com,本平台相关工作人员将会进行核查。


