技术面与宏观变量交织,市场面临突破或回调关键节点。
撰文:White55,火星财经
序幕:价格突破与巨鲸腾挪
2025 年 6 月 10 日,以太坊价格以凌厉攻势突破 2,827 美元,创下 15 周新高。这一数字背后,一场涉及 18 亿美元空头头寸的清算风暴正在酝酿。而在这场看似偶然的行情中,一位神秘巨鲸的操作轨迹,成为解读市场情绪的关键注脚。
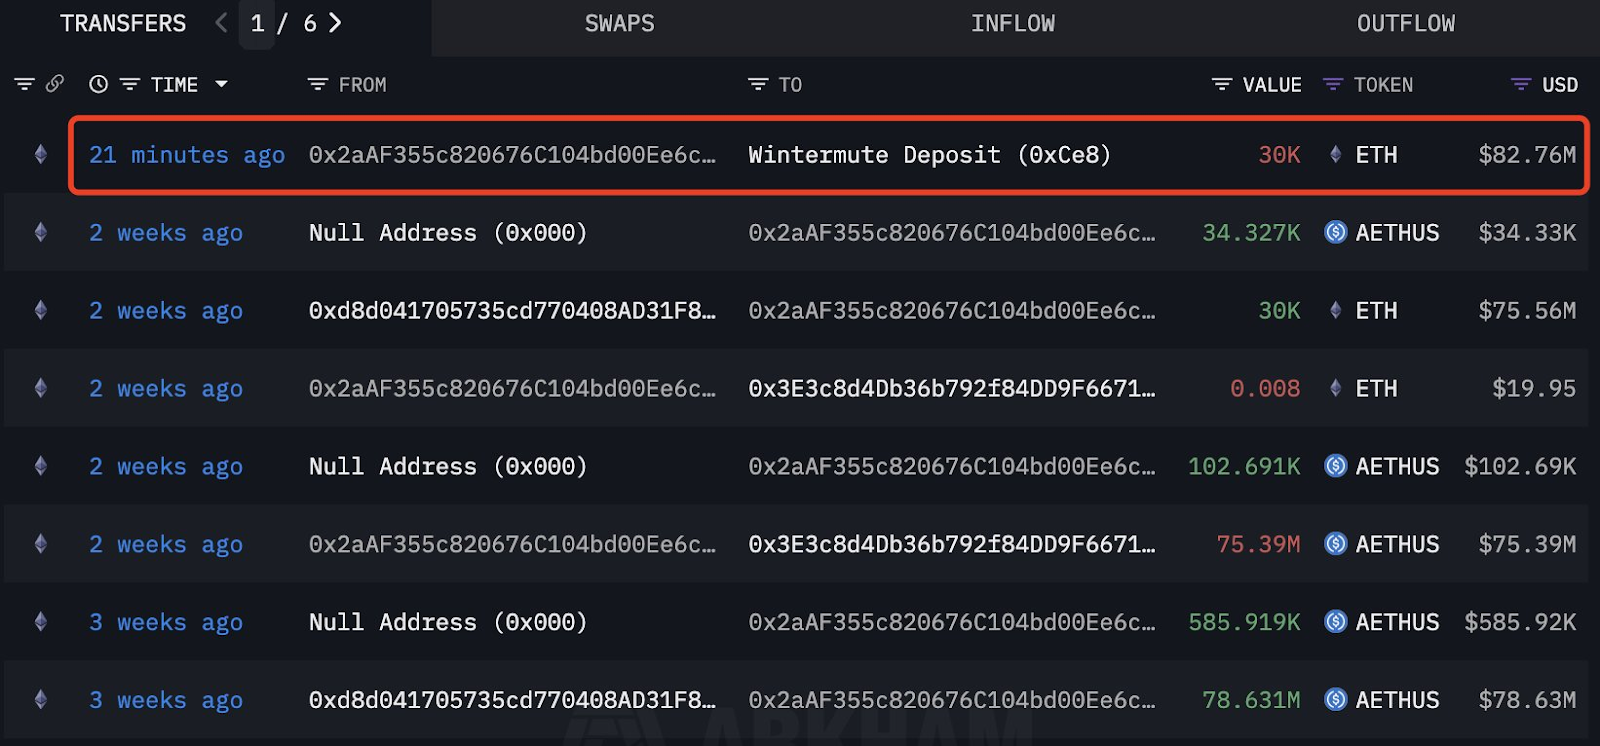
ETH 鲸鱼的交易活动。资料来源:Lookonchain/X
据链上追踪平台 Lookonchain 披露,某匿名地址在 44 天内完成两次精准狙击:
- 第一回合(4 月 27 日):通过 Wintermute OTC 以 1,830 美元均价吸筹 3 万枚 ETH,耗资 5,490 万美元;
- 第二回合(5 月 27 日):以 2,621 美元价格抛售等量筹码,获利 2,373 万美元,收益率高达 43%;
- 终局收割(6 月 10 日):再次通过场外交易以 8,276 万美元抛售 3 万枚 ETH,锁定 730 万美元利润,累计斩获 3,100 万美元。
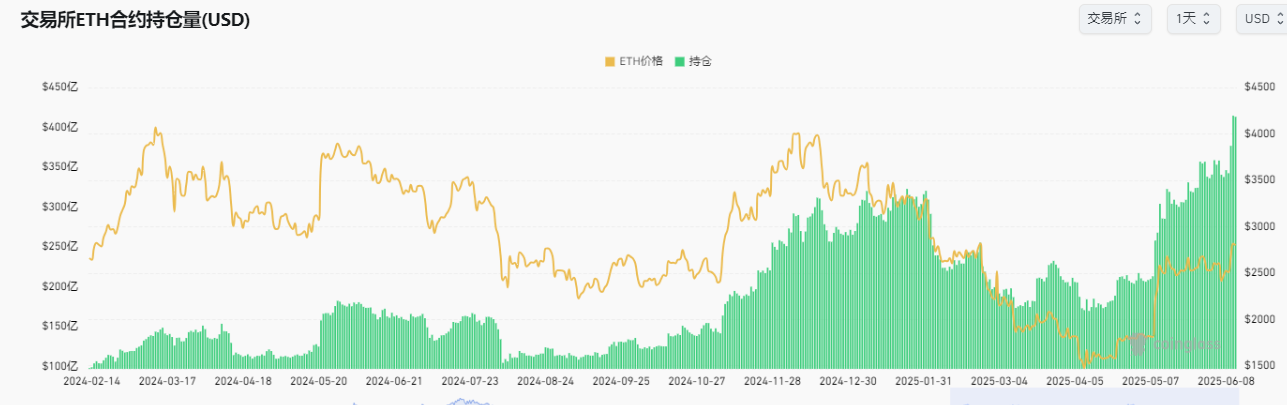
此类操作绝非孤例。CoinGlass 数据显示,以太坊期货未平仓合约(OI)首次突破 400 亿美元大关,市场杠杆率已逼近临界点。当前流动性图谱呈现微妙平衡:2,600 美元附近聚集 20 亿美元多头清算风险,而 2,900 美元上方则潜伏着 18 亿美元空头爆仓弹药。这种多空对峙,恰似《大空头》中 CDO 市场的翻版——任何方向突破都将引发链式反应。
第二章:生态扩张与价值裂缝
价格狂欢背后,以太坊生态正经历结构性变革。
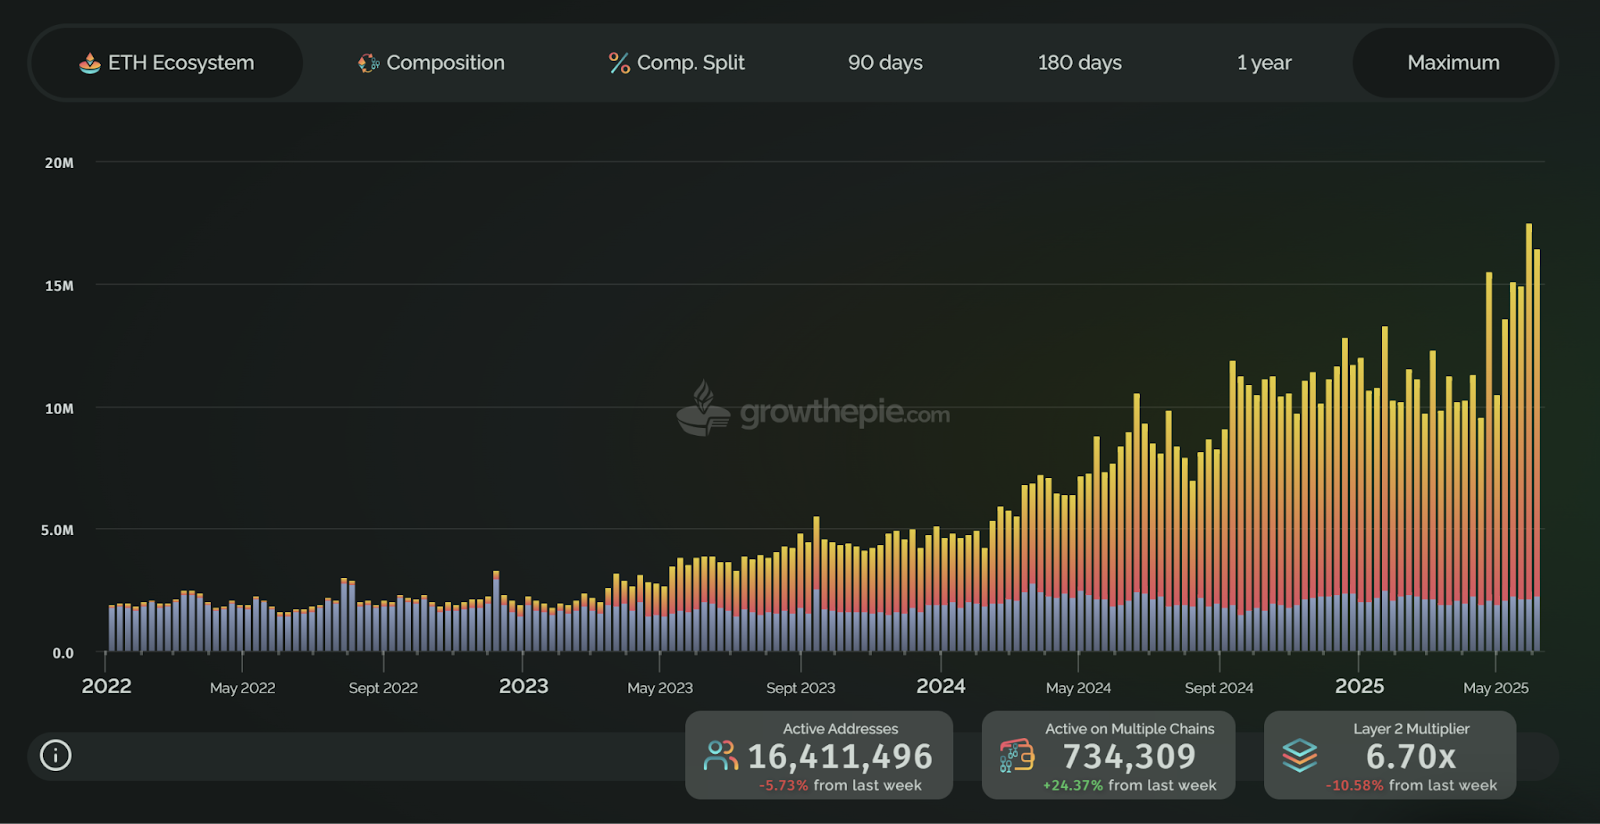
以太坊每周地址参与度图表。来源:growthepie
growthepie 数据显示,第二季度独立活跃地址暴增 70%,6 月 10 日达到 1,640 万峰值。其中 Base 网络以 72.81% 占比(1,129 万地址)成为增长引擎,远超以太坊主网的 14.8%(223 万地址)。这种「卫星链反哺主网」的模式,与 2020 年代 DeFi Summer 的叙事逻辑截然不同。
尽管以太坊仍以 660 亿美元 TVL 占据 DeFi 市场 61% 份额,但其核心收入模型已现隐忧:
- 手续费塌陷:过去 30 天网络手续费仅 4,330 万美元,较坎昆升级前暴跌 90%;
- 质押收益困局:Blob 技术降低 Layer2 成本的同时,质押者年化收益持续萎靡于 3.12%,远逊于 Solana 等竞品;
- 监管枷锁:SEC 对 ETH 质押的审查导致现货 ETF 资金连续 8 日净流出 3.69 亿美元,机构信仰出现裂痕。
这种矛盾在 Glassnode 链上数据中具象化:持有 ETH 超过 1 年的「钻石手」地址占比从 63% 骤降至 55%,而短期持有者抛售量激增 47%。当技术升级未能转化为持币者收益,生态繁荣反而成为价值稀释的推手。
第三章:衍生品市场的血色罗盘
期货市场暗流涌动,ETH 期货未平仓合约 (OI) 历史上首次突破 400 亿美元,表明市场杠杆率较高。未平仓合约的大幅上涨预示着潜在的波动性。
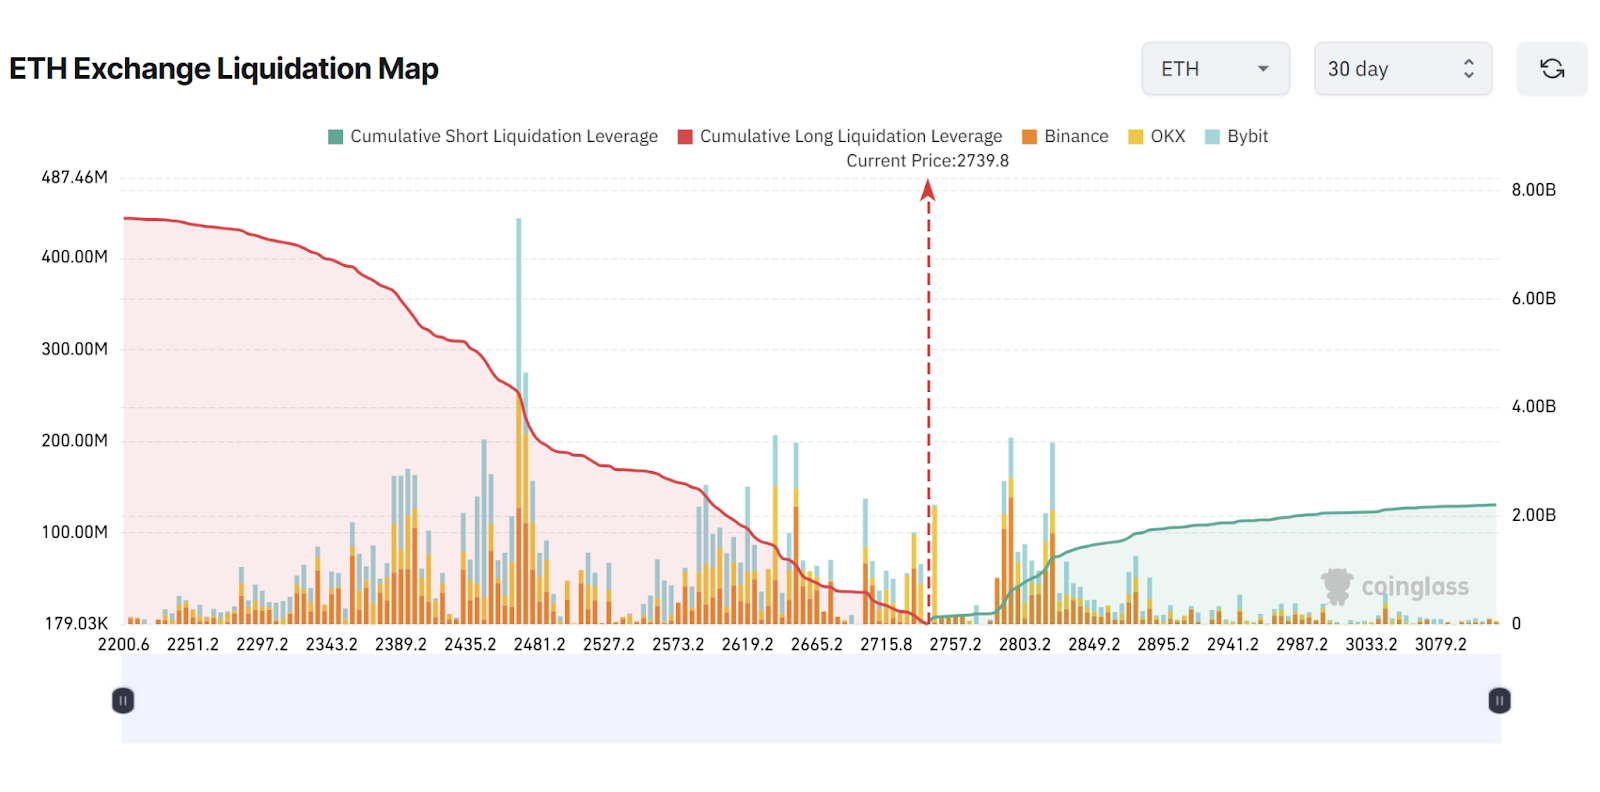
以太坊清算图表。资料来源:CoinGlass
CoinGlass 清算热图揭示资本博弈的残酷逻辑:
- 多头雷区:2,600-2,665 美元区间堆积 20 亿美元强平风险,此处恰为 2024 年牛市 50% 斐波那契回撤位;
- 空头坟场:2,900 美元上方 18 亿美元空头头寸命悬一线,该位置对应 ETH/BTC 汇率 0.019 历史低位;
- 机构双面性:CME 以太坊期货未平仓合约占比达 9%,与比特币期货 24% 的机构主导格局形成反差,暗示传统资本仍持观望态度。
衍生品市场的畸形繁荣,实为流动性陷阱的显影。当永续合约资金费率持续为负、吃单者买卖比率跌破 1 时,市场已进入「极端看空」状态。这种环境下,巨鲸的 OTC 套现更像是末日狂欢前的离场信号——毕竟历史数据显示,未平仓合约创纪录后 3 个月内发生黑天鹅事件的概率高达 68%。
第四章:技术面密码与宏观变量
从 K 线形态审视,当前行情暗藏玄机:
- 波动率挤压:日线布林带收窄至 5%,为 2024 年 2 月以来最低水平,预示突破在即;
- 周线悖论:价格站稳 50 周与 100 周 EMA 上方,但 MACD 柱状图出现顶背离,RSI 数值 42 暗示上行势能不足;
- 斐波那契桎梏:2,800 美元日收盘价将成为多空分水岭,突破则打开 3,200-3,500 美元理论空间,反之可能回踩 2,500 美元实现价格支撑。
宏观层面,美俄地缘政治谈判与美联储降息预期构成双重扰动。CME 利率期货显示,市场对 2025 年 2-3 次降息的定价已达 79%,若实际路径偏离,加密市场将首当其冲。而渣打银行警告,RWA(真实世界资产)叙事若未能在 Q3 兑现,以太坊或面临千亿美元市值蒸发风险。
终章:范式革命前夜
以太坊正站在历史十字路口:
- 质押经济重构:通过 EIP-7251 将验证节点质押上限提升至 2048 ETH,优化退出机制缓解流动性危机;
- Layer2 价值反哺:强制 Arbitrum 等 Layer2 将部分手续费收入分配至主网,解决「生态繁荣,主网贫血」悖论;
- 监管破局:SEC 对 21Shares 质押 ETF 的裁决若在 Q3 通过,预计带来 15-20% 短期涨幅,并锁定 8% 流通量。
正如彼得·布兰特所言,突破 2,800 美元拥堵形态后,以太坊或开启「登月」行情至 5,232 美元。但需警惕,这场资本游戏的本质仍是杠杆驱动下的流动性狩猎——当 18 亿美元空头头寸化作燃料时,市场终将验证:究竟谁在驾驭趋势,谁又是裸泳者。
免责声明:本文章仅代表作者个人观点,不代表本平台的立场和观点。本文章仅供信息分享,不构成对任何人的任何投资建议。用户与作者之间的任何争议,与本平台无关。如网页中刊载的文章或图片涉及侵权,请提供相关的权利证明和身份证明发送邮件到support@aicoin.com,本平台相关工作人员将会进行核查。


