在关键的26日指数移动平均线(EMA)之上徘徊,目前作为其主要支撑位的XRP显示出即将突破的迹象。XRP目前正在进行技术整合后的可能移动,经过相对平静的修正阶段后,价格稳定在2.30美元以上。
主要移动平均线的收敛,特别是26、50和100日EMA开始收紧,是图表上最重要的发现。这种挤压模式通常在波动性激增之前出现,特征是压缩的动能找到方向时价格剧烈波动。
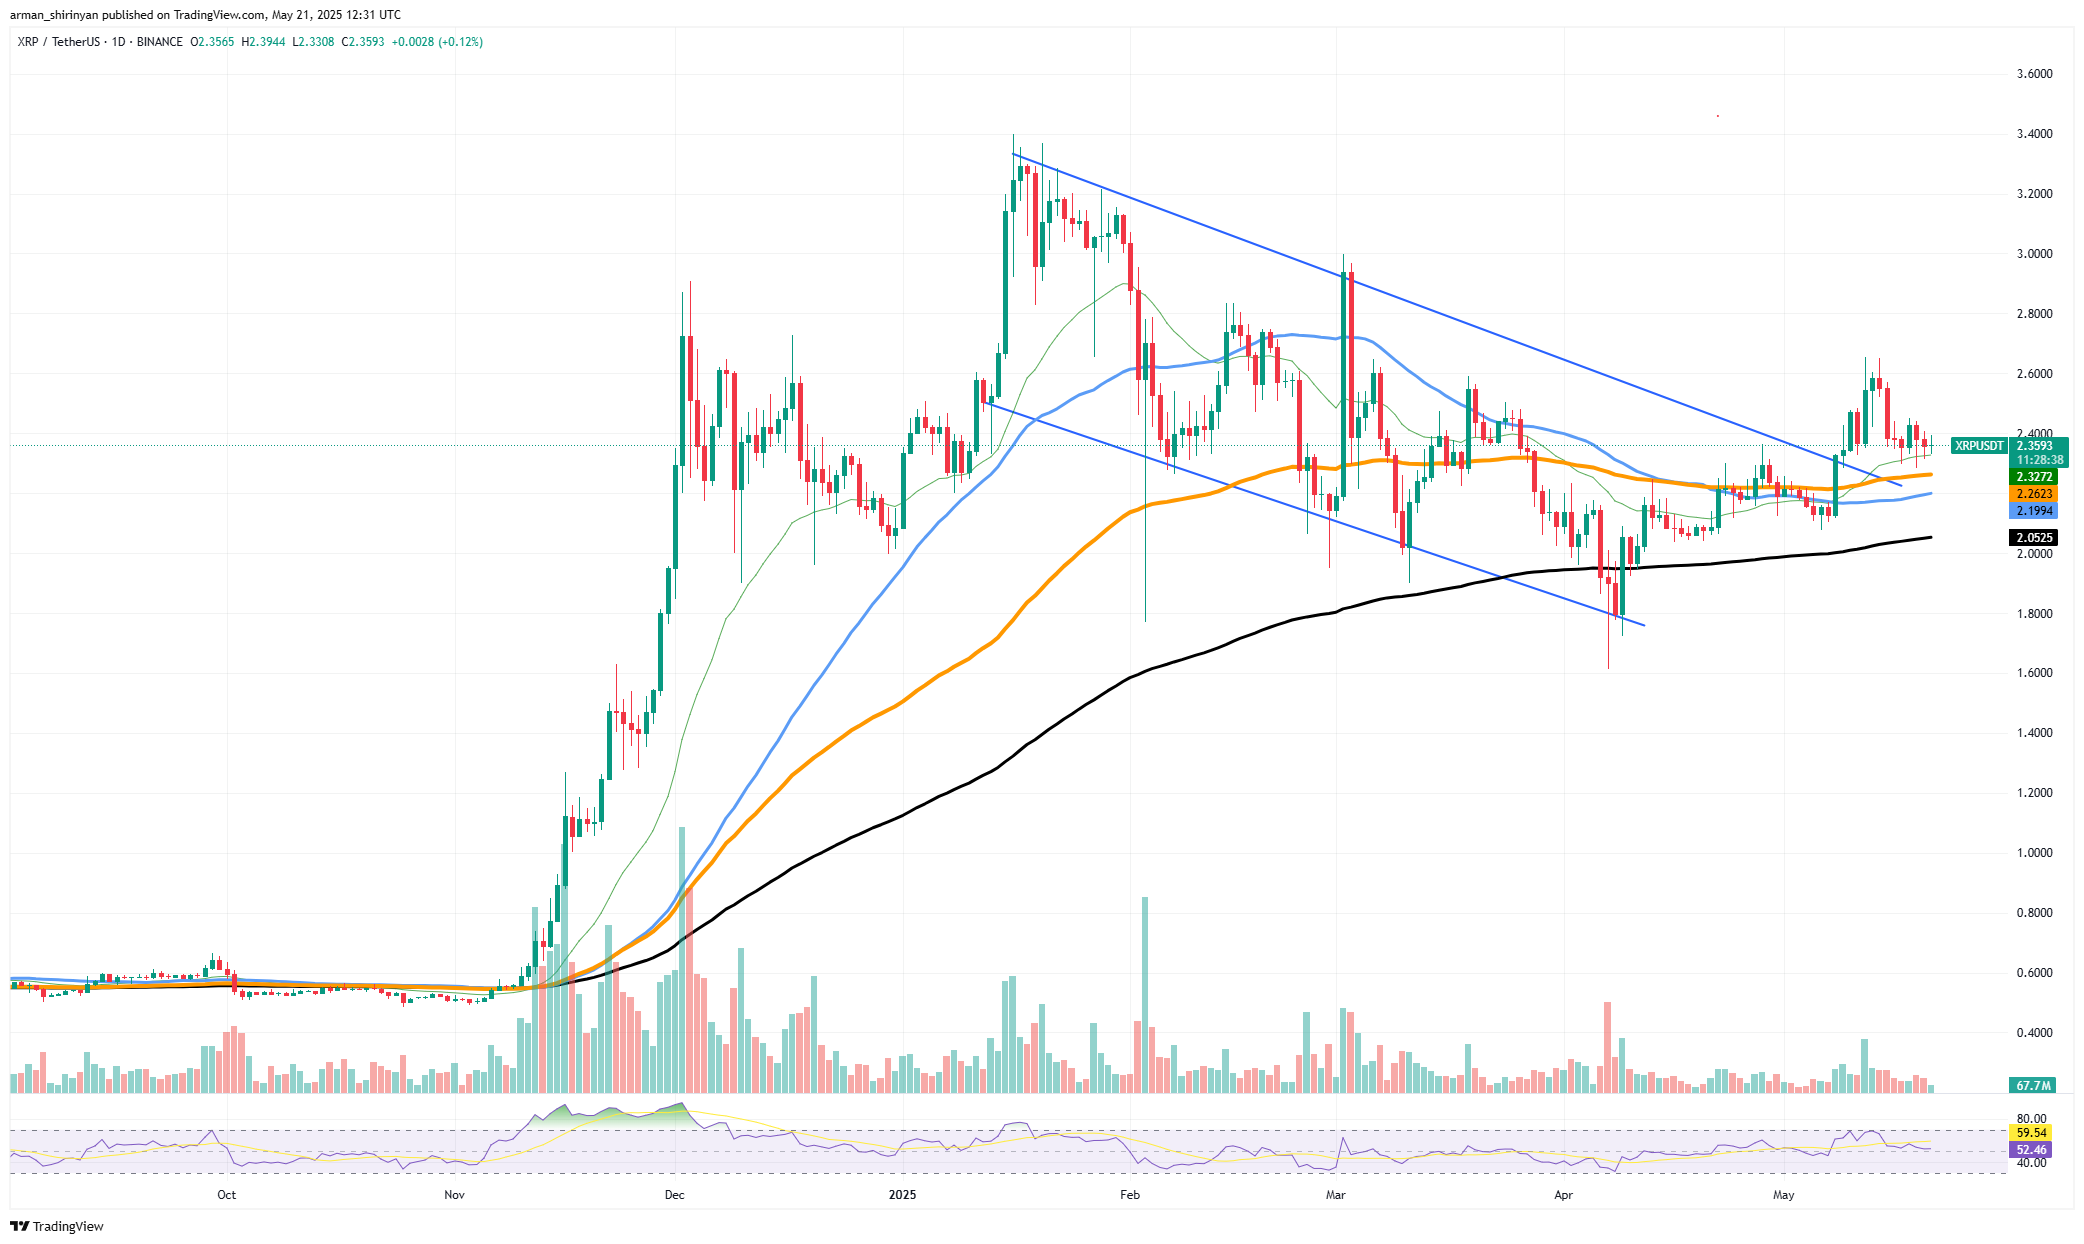
如果买入压力回归,只要XRP保持在这些水平之上,向上突破的可能性就会更高。尽管目前交易量较低,但这为压缩叙事提供了可信度。XRP在接近重要技术阈值的低交易量平台后,历史上表现出爆炸性的行为。
热门故事 Ripple首席技术官质疑2.37亿美元的XRP购买 比特币达到11.1万美元,但这次反弹极其奇怪 $11亿美元买两个披萨?历史性的比特币购买满15年 XRP价格将爆炸性上涨,以太坊(ETH):新目标3000美元,柴犬币(SHIB)瞄准黄金交叉
由于相对强弱指数(RSI)接近60,资产仍有上升空间,而不会立即进入超买区域。这种技术设置表明潜在的看涨能量在等待催化剂。XRP目前正在从多个月的下行趋势中恢复,本月早些时候突破该结构的行为在更广泛的市场结构角度上并未被否定。
基于当前的价格走势,可能会出现持续的反弹,这表明对支撑位的合理回测。如果交易量验证突破,并且XRP收盘在2.50美元的阻力位之上,可能会迅速向2.80-3.00美元移动。相反,失去26日EMA将增加下跌至100日EMA(约在2.26美元)的风险。
以太坊突破
随着长期整合的结束和新的看涨阶段的开始,以太坊正式突破了其下降趋势线。除了作为一个技术里程碑外,这一突破可能成为以太坊期待已久的反转基础,并推动其向关键的3000美元大关迈进。200日EMA在关键时刻被ETH触及并反弹,作为当前走势的坚实支撑和发射台。
这一水平作为心理和技术底部的重要性得到了确认,牛市成功捍卫了这一水平,尽管市场整体犹豫不决。从这一水平的反应证实了这一点。现在,上方趋势线的明显收盘验证了从短期下降楔形模式的突破,该模式特征是几周的低高点。在看涨时期,这种模式通常作为持续结构,而ETH的后续表现加强了这一说法。
你可能也喜欢 
2025年5月21日 - 11:57 不,比特币价格尚未过热,链上出现看涨数据 作者Godfrey Benjamin
当突破期间交易量保持稳定时,这一走势的权重增加。尽管相对强弱指数(RSI)正在接近超买区域,但在突破情境下,进一步的上行仍然是可能的。目前,主要的阻力位是接近2800美元区域的心理3000美元水平之下。
如果以太坊能够保持势头并以增加的交易量突破这一区域,这一走势可能会吸引观望的买家,并开启新一轮的看涨活动。以太坊的技术指标指向持续上涨的方向。200日EMA的干净突破反弹和下降趋势线的突破为看涨前景提供了良好的支持。3000美元的水平现在已牢牢在望,如果市场条件继续有利,ETH可能很快进入下一个重要的上涨阶段。
柴犬币的黄金闪光
随着50日指数移动平均线(EMA)逐渐接近长期的200日EMA,柴犬币显示出可能形成黄金交叉的早期迹象。尽管这一交叉通常在技术分析中被解读为看涨信号,但SHIB的未来远未确定。在价格方面,SHIB在最近的交易中相对稳定,徘徊在100日EMA附近,略高于重要支撑位。
该代币再次形成基础,期待一个催化剂将其推高,此前它在200日EMA上方的突破尝试未能成功。50日EMA当前接近价格走势,可能暗示即将发生的动能转变,但这需要确认。然而,交易量明显下降是最明显的警告信号之一。
你可能也喜欢 
2025年5月21日 - 12:17 《富爸爸穷爸爸》作者:比特币将达到50万美元至100万美元,超通货膨胀来临 作者Yuri Molchan
疲软的交易量与黄金交叉相结合,常常导致虚假突破或快速反转。如果没有太多的买入压力,这一设置可能在达到完全交叉状态之前就会消退。最近几天,柴犬币在链上的流入和流出都经历了显著增加。大型持有者的流入在过去一周增加了超过1100%,而流出活动也显著增加。
这意味着鲸鱼们更加关注,尽管不一定是以积极的方式。相反,反向流动表明再分配或战略重新定位,而不是积累。现在每个人都在关注50日EMA是否能够继续缩小与200日EMA的差距并触发黄金交叉。SHIB仍处于投机区,直到交易量得到确认且价格走势保持在重要EMA之上。交易者应谨慎行事,并在确认交易量和市场结构之前,等待进一步的看涨信号。
免责声明:本文章仅代表作者个人观点,不代表本平台的立场和观点。本文章仅供信息分享,不构成对任何人的任何投资建议。用户与作者之间的任何争议,与本平台无关。如网页中刊载的文章或图片涉及侵权,请提供相关的权利证明和身份证明发送邮件到support@aicoin.com,本平台相关工作人员将会进行核查。


