作者:Donovan Choy
编译:深潮TechFlow
更好地使用区块链指标
区块链生成了大量的公共数据。在 Crypto Twitter 上,人们不断地将区块链 A 和区块链 B 进行比较,投资者、研究人员和意见领袖 (KOL) 在为他们的观点辩护时有很多指标可以参考。然而,错误使用这些数字往往会使人们对这个领域的理解变得模糊。
在今天的 0xResearch 文章中,我们将探讨三个指标及其存在的问题:活跃地址、区块链“盈利能力”和总价值保障。
活跃地址
“活跃地址”是指在某个协议上有多少活跃的、付费的用户。
“Facebook 拥有三十亿月活跃用户”是一个有用的信息,它告诉我们一些关于这个社交网络的情况。由于垃圾邮件发送者没有足够的盈利机会来泛滥 Facebook,活跃地址是评估该平台对消费者真正价值的一个不错方法。
但是对于区块链而言,由于创建新钱包非常容易,以及通过空投或协议激励来获利的机会显而易见,活跃地址的价值就不那么大了。
例如,下图展示了一个明显的情况:Solana 在过去一个月中拥有最多的每日活跃地址,因此 Solana 看起来非常活跃。
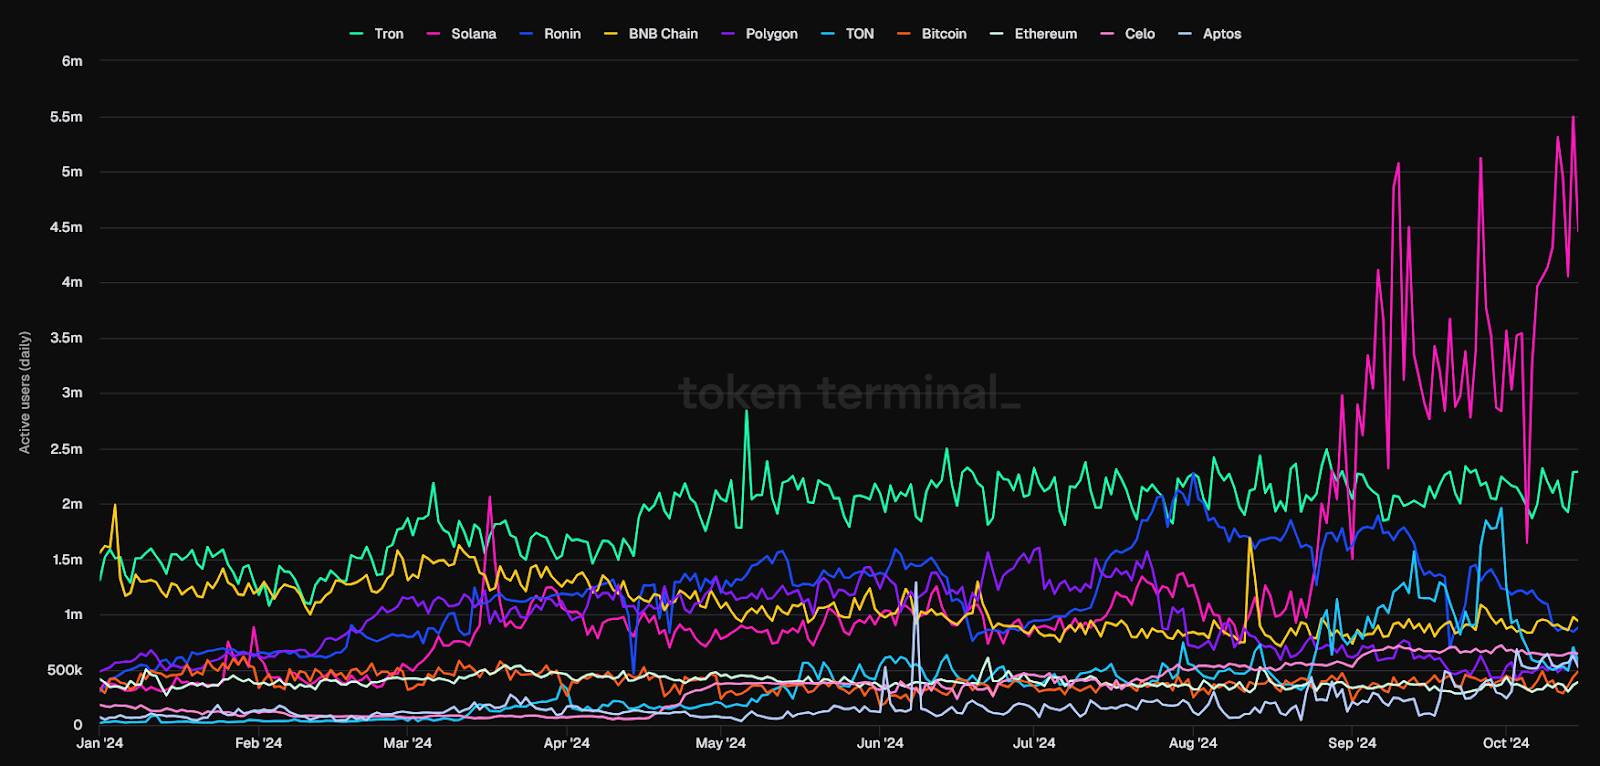
来源: TokenTerminal
大多数 Solana 用户在去中心化交易所 (DEX) 上进行交易,因此我们需要仔细观察 DEX 上的活动。当我们深入研究 Solana 在其 DEX 上的活跃地址时发现,过去一天中,大多数地址——大约 340 万个,总计 440 万个——的交易量终生少于 10 美元。
这表明,由于 Solana 的低交易费用,可能存在大量的垃圾或机器人活动,而不是大量的“优质”用户。
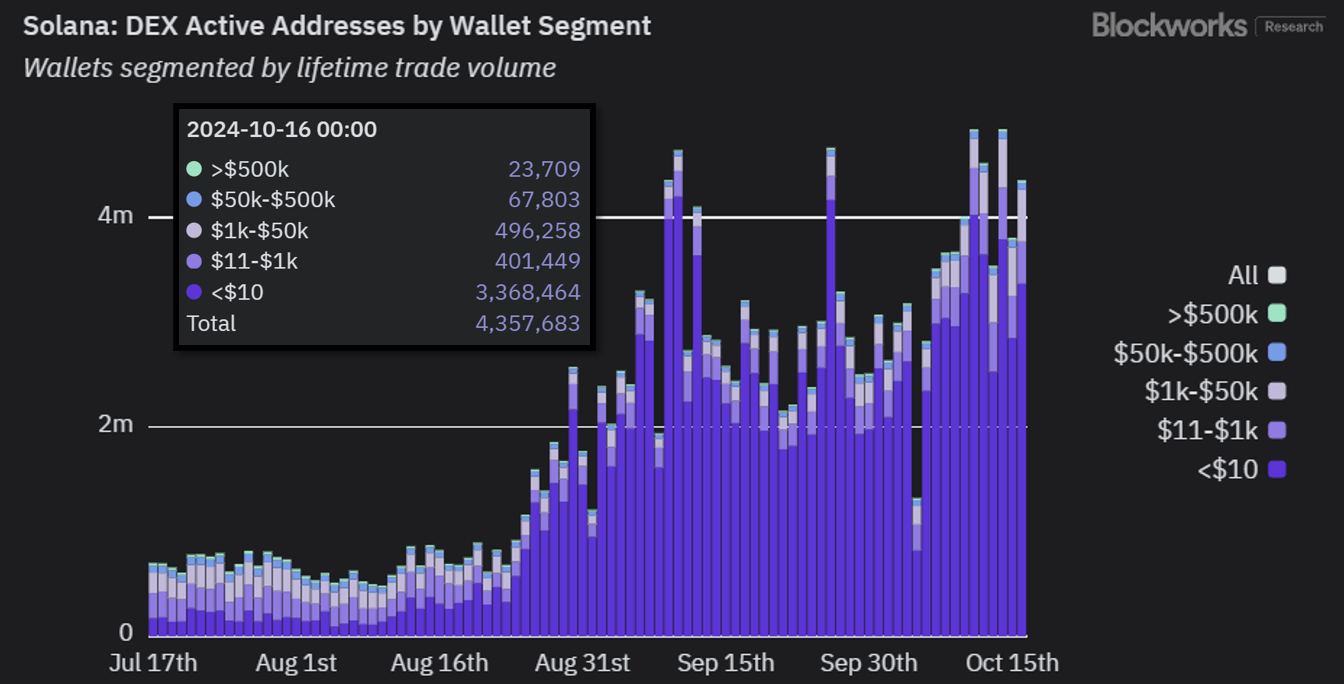
来源: Blockworks 研究
这是我之前提到的另一个例子:Celo L1(现在为 L2)在 9 月份时,其发送稳定币的每日活跃地址激增至 64.6 万。这一数字超过了 Tron,因此引起了 Vitalik Buterin 和 CoinDesk 的关注。
经过深入分析,Variant Fund 的数据分析师 Jack Hackworth 发现,其中 77% 的 Celo 地址转移的金额不到两美分,主要是因为成千上万的用户通过一个名为 GoodDollar 的普遍基本收入协议领取了微小金额的资金。在这两种情况下,活跃地址都显示了高使用率,但仔细分析后,这种说法并不成立。
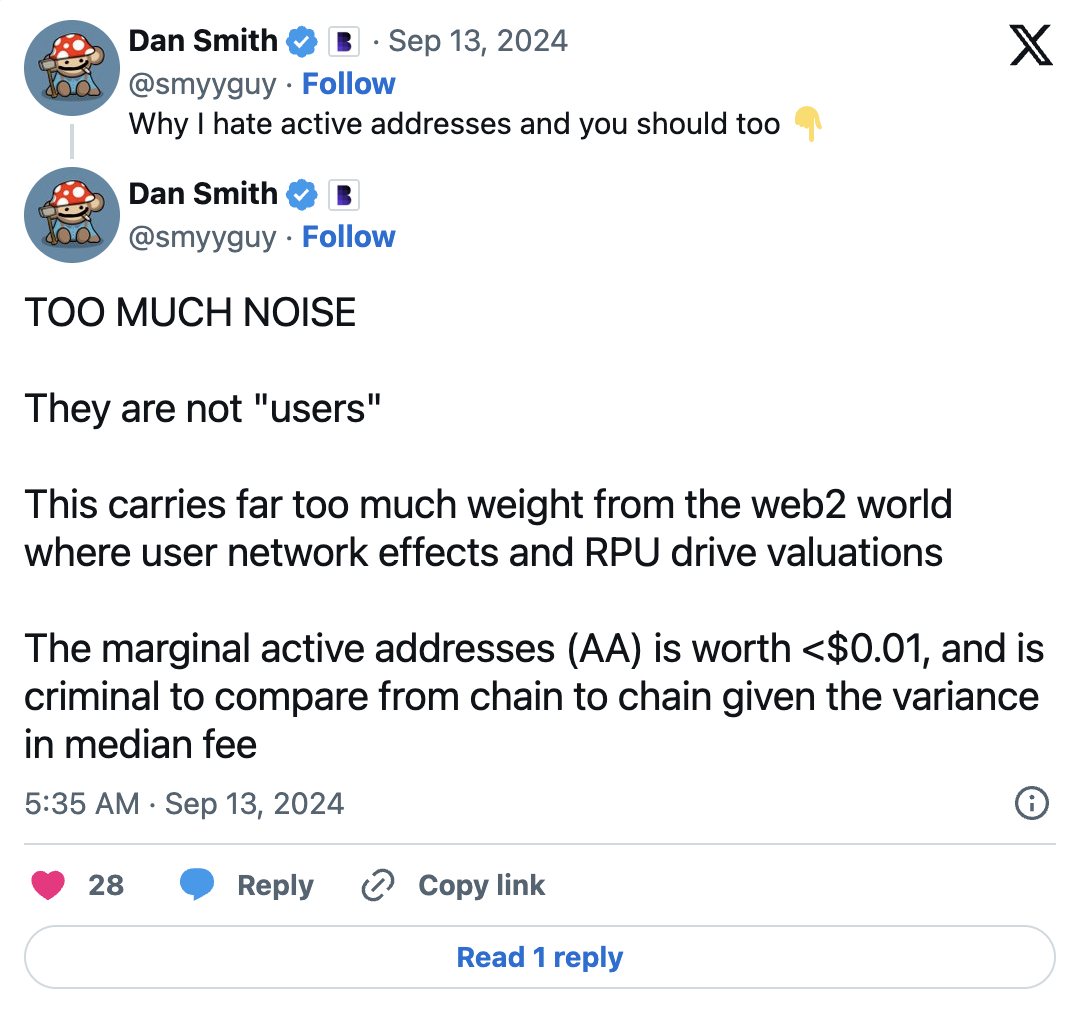
想了解更多相关信息,可以参考 Dan Smith 的研究,他专注于每日活跃地址的误用问题。
区块链盈利能力
与其关注活跃地址来研究区块链活动,不如查看网络费用指标。费用反映了使用协议的总 gas 消耗,而不考虑“优质”用户的问题。
费用通常被分析师和投资者用来判断哪些区块链产生了最多的“收入”。然后,我们将区块链支付给验证者的代币发行视为成本。结果就是区块链的“盈利能力”。
这就是 Token Terminal 为加密协议生成“财务报表”的方式。例如,下面的图表显示,以太坊 L1 在过去两个月中积累了数百万美元的亏损。
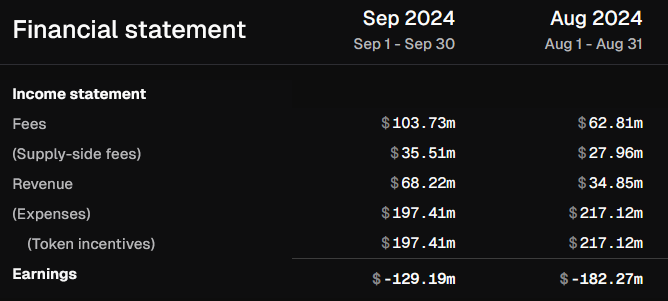
唯一的问题是,这种计算没有考虑到一个关键因素:与 PoW 链(如比特币)不同,PoS 链上的用户也可以轻松获得代币发行奖励。
毕竟,如果我能从 Lido 或 Jito 等流动质押平台上获得 5% 的 ETH/SOL 质押收益,我为什么要在意网络是否“无利可图”?因此,将代币发行视为成本得出“以太坊无利可图”的结论是有问题的。
在现实世界中,通货膨胀是有害的,因为当中央银行大量印钞时,增加的货币供应在不同时间到达经济中的不同参与者,最先获得新货币的人在“真实”价格调整之前会受益。这就是所谓的坎蒂隆效应。
在 PoS 区块链经济中,情况并非如此,因为通货膨胀(即代币发行)是所有人同时获得的。因此,没有人因此变得更富有或更贫穷——大家的财富保持不变。
相反,我们可以考虑使用真实经济价值 (REV) 这个替代指标。REV 将网络费用和给验证者的 MEV 小费结合在一起,但不把代币发行当作成本。
基于这一点,我们可以看到,以太坊在过去两个月实际上是盈利的:
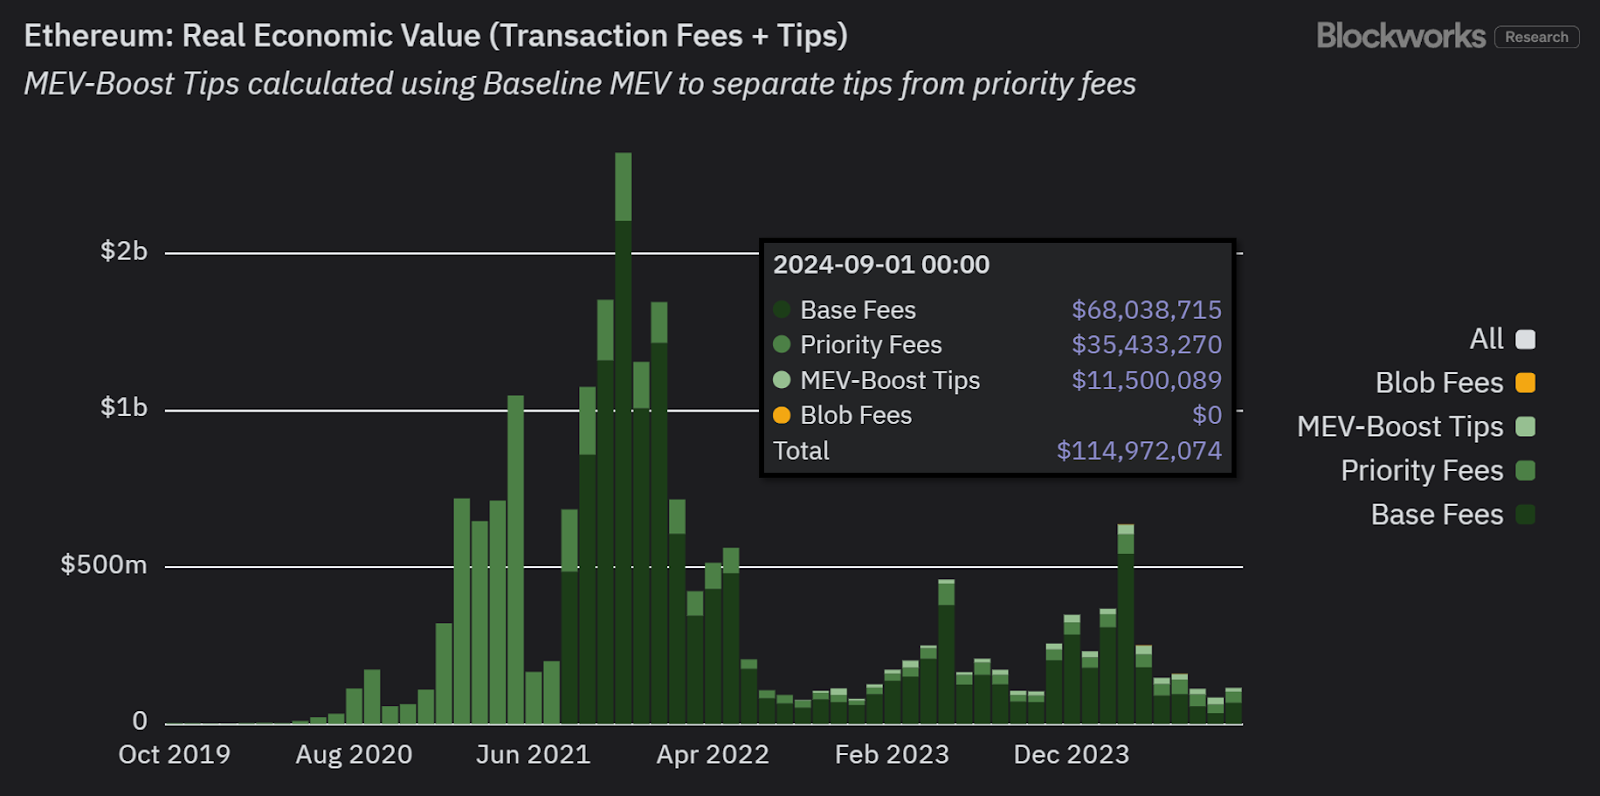
REV 可以说是评估网络真实需求的更佳指标,也是与传统金融 (TradFi) 更具可比性的收入指标。
总而言之,传统的损益会计方式并不容易直接应用于区块链。
想了解这个复杂话题的更多信息,可以收听最近与 Jon Charbonneau 一起参与的 Bell Curve 播客。
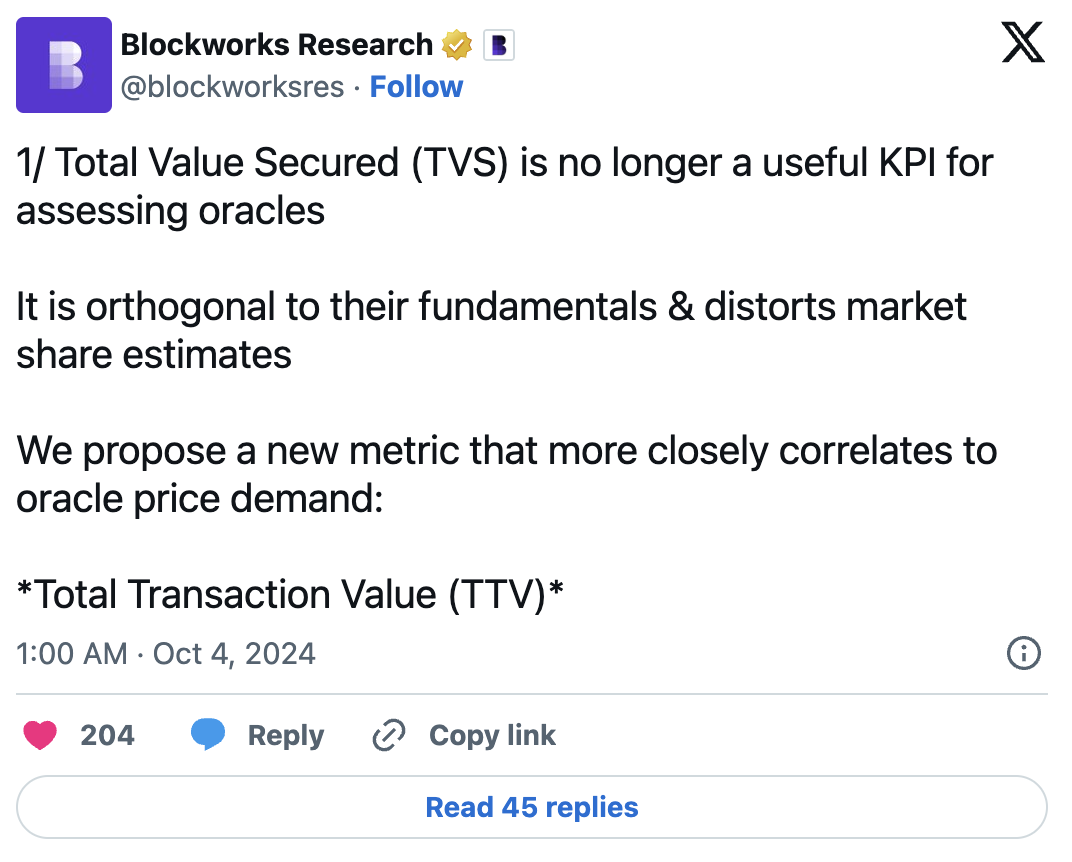
总交易价值 (TTV),而不是总价值保障 (TVS)
Oracles 是区块链获取链外数据的关键基础设施。没有像 Chainlink 这样的 Oracles,区块链经济就无法可靠地反映现实世界的价格。
比较 Oracles 提供商市场份额的常用方法是使用“总价值保障” (TVS) 指标,它汇总了所有由 Oracles 保障的 TVL。DefiLlama 就是这样明确计算的:
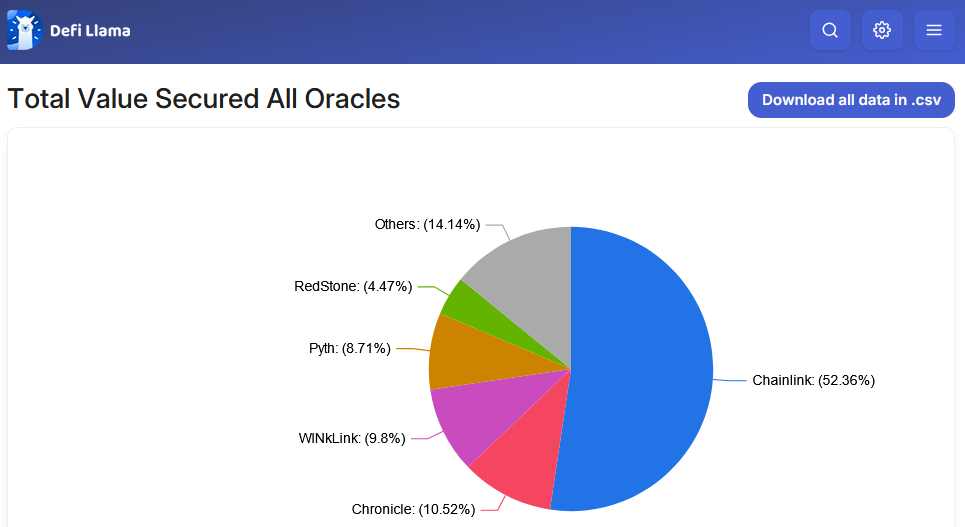
来源: DefiLlama
TVS 的问题在于它掩盖了 Oracles 实际保障的活动。
例如,为高频交易产品(如永久合约交易所)提供支持的 Oracles 会以亚秒级的延迟不断从链外数据源“拉取”价格更新。
这与用于借贷协议的“推送式” Oracles 形成对比,后者每天只需在链上更新几次价格,因为不需要频繁更新。
TVS 关注的是 Oracles 管理的总价值,但忽略了 Oracles 提供商的性能强度。
换句话说,这就像说一份精致牛排和一份沙拉在菜单上都标价 50 美元,因此它们对食客的价值是相同的。但显然,制作牛排所需的工作远比制作简单沙拉要多,这是一个值得考虑的因素。
一种替代指标是总交易价值 (TTV),它考虑了使用 Oracle 更新定价的周期性交易量。
TTV 排除了低交易频率的应用,如借贷、CDP 和重新质押,但正如 Ryan Connor 所解释的,“只有 2-9% 的 Oracle 价格更新来自这些低频协议,在加密货币领域,这个比例很小,因为基本指标的波动性很大。”
当以 TTV 来评估 Oracles 时,市场份额会发生显著变化。
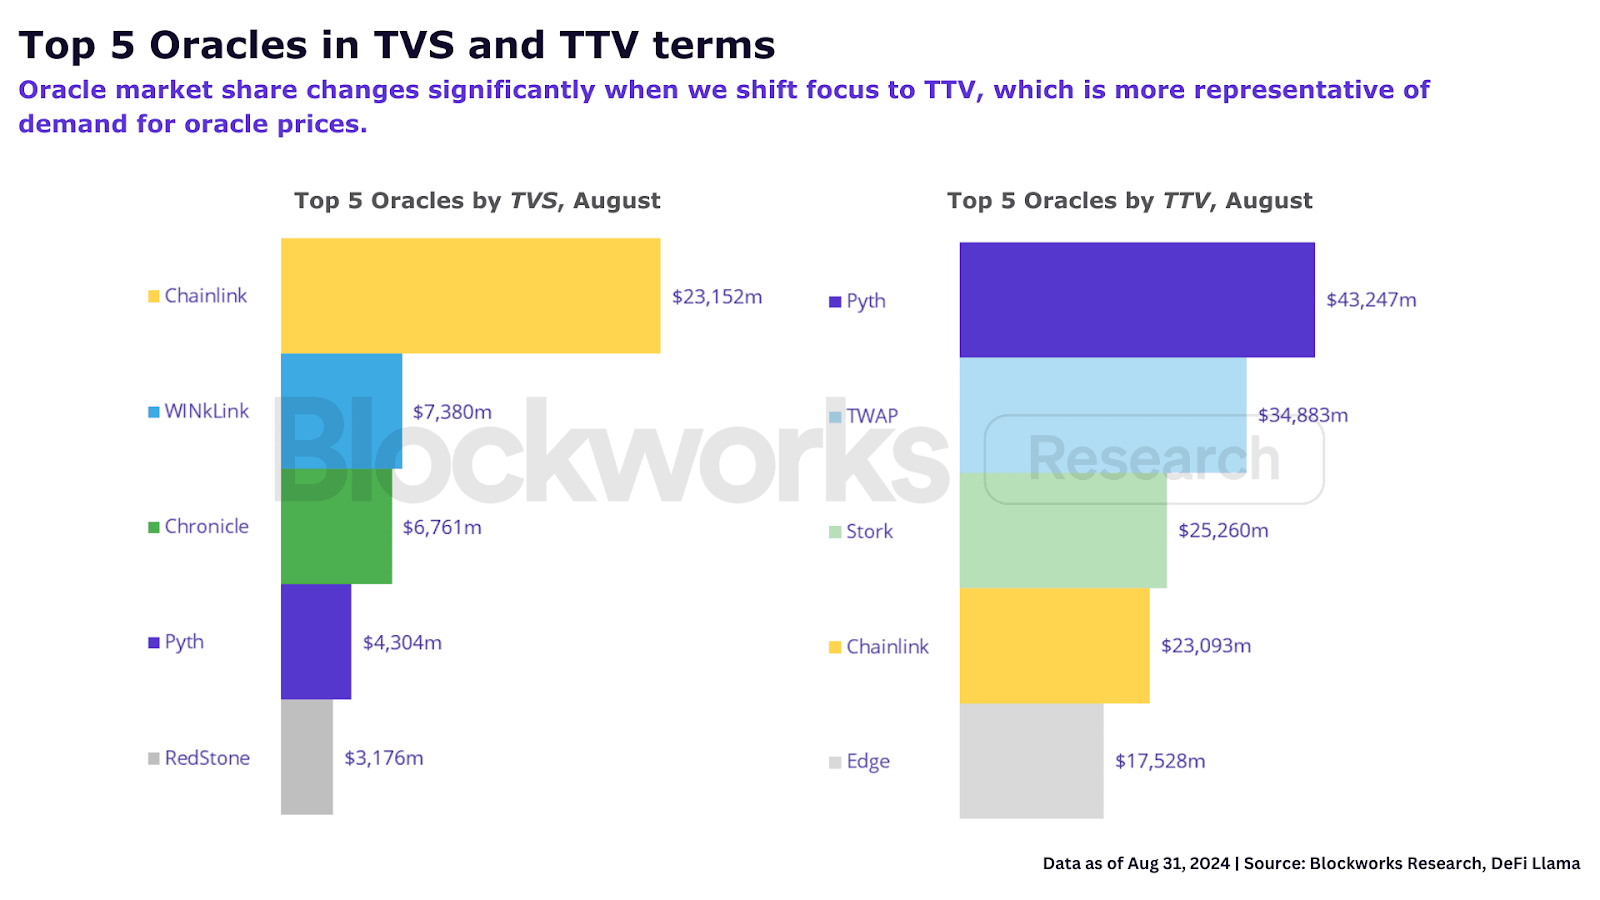
想了解更多,可以参考 Blockworks Research 关于 TTV 如何更好地反映 Oracles 基本面的报告。
免责声明:本文章仅代表作者个人观点,不代表本平台的立场和观点。本文章仅供信息分享,不构成对任何人的任何投资建议。用户与作者之间的任何争议,与本平台无关。如网页中刊载的文章或图片涉及侵权,请提供相关的权利证明和身份证明发送邮件到support@aicoin.com,本平台相关工作人员将会进行核查。


