Author: Rime Xiaochu
Several important data to help you make future decisions
1) Since the calculation from BTC 38,000 to the present, the total market value of stablecoins has increased by 11 billion US dollars. There was a significant increase in the previous week, with stablecoins increasing by 3.7 billion US dollars.
2) Starting from March 6th, the main force behind the rise in BTC has shifted to Asian funds. There are signs of withdrawal of funds from the United States, and BTC has instead fallen by 15% in the US time zone, which is not a good sign.
3) The total inflow of ETFs is 9.5 billion US dollars, so the inflow of stablecoin funds still exceeds the inflow of ETF funds, which is the biggest driving force for the rise in the coin circle. However, ETFs can only purchase BTC, so the funds from ETFs play a more dominant role in the rise of BTC.
4) In terms of BTC whales, in the past week, the number of addresses with more than 1,000 BTC has decreased by 50, while the number of addresses with more than 100 BTC has increased by 86.
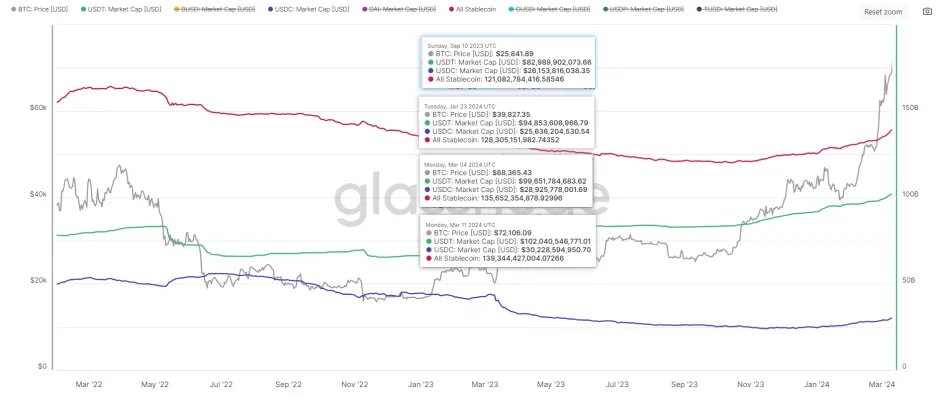
1 Analysis of the total market value of stablecoins
From the perspective of the total market value of stablecoins, here are some data:
- The lowest point of this round of market, which was September 10, 2023, the total market value of stablecoins was 121 billion US dollars.
- The lowest point after the approval of ETF, when BTC adjusted to 38,500, which was January 23, 2024, the total market value of stablecoins was 128.3 billion US dollars.
- Last Monday, the total market value of stablecoins was 135.6 billion US dollars.
- This Monday, the total market value of stablecoins was 139.3 billion US dollars.
In other words, from the beginning of the last market to the lowest point after the approval of ETF, stablecoins increased by a total of 7.3 billion US dollars. And in the past month, stablecoins have increased by 11 billion US dollars, with a significant increase last week of 3.7 billion US dollars.
For mainstream stablecoins USDT and USDC, since September 10, 2023, USDT has increased from 82.9 billion to 102 billion US dollars, an increase of 19.1 billion US dollars. USDC has increased from 26.1 billion to 30.2 billion US dollars, an increase of 3.9 billion US dollars. USDT has indeed seen substantial increases.
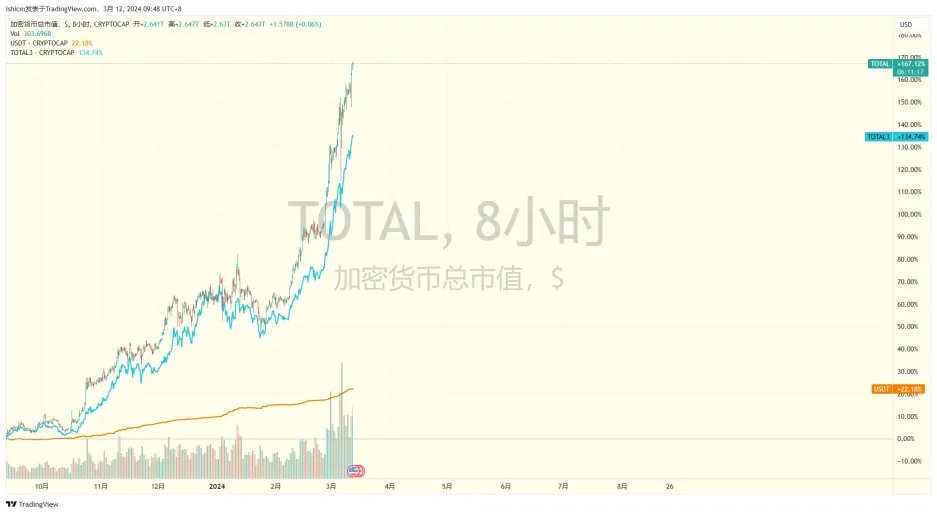
2 Analysis of the total market value of altcoins
In the above figure, a) black represents the total market value of cryptocurrencies, b) green represents the total market value of cryptocurrencies excluding BTC and ETH, c) orange represents the total market value of USDT. From the above figure, we can intuitively see:
1) Since the bottom in September 2023, the growth of the total market value of BTC+ETH has been significantly higher than that of other altcoins, and most of the time it has been higher. So, first of all, congratulations to those who hold large positions in BTC and ETH. Secondly, if your current returns cannot surpass those of BTC and ETH, do not doubt yourself. Do not be swayed by those who claim to have made tens of times their investment, as the actual overall returns of altcoins lag behind BTC and ETH.
2) We observe that the increase in the market value of USDT is clearly slower than the increase in the market value of cryptocurrencies. This is due to two reasons: 1) because ETF funds and US dollar funds mainly from Coinbase are also in this situation, 2) as the market rises, more people adopt a strategy of holding positions without making large investments. Therefore, a large amount of funds is not needed to drive the market.
3 ETF data analysis
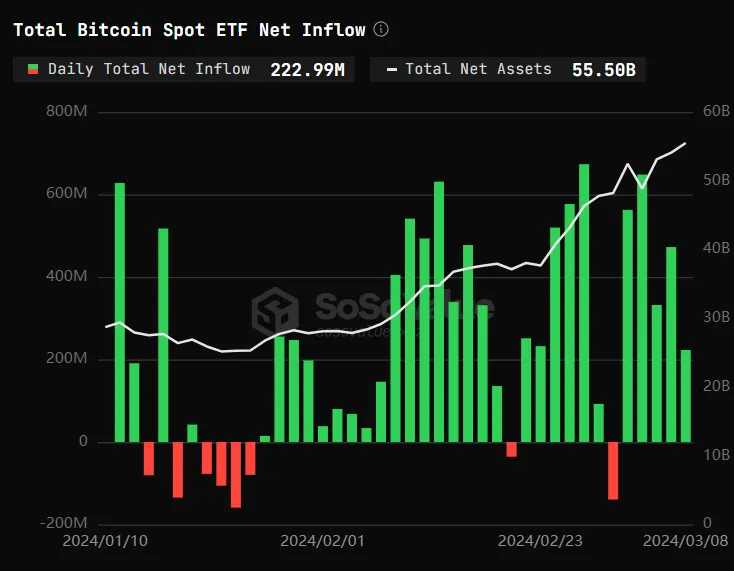
From the data of ETFs, as of March 8th, the net asset value of ETFs holding BTC is 55 billion US dollars. The cumulative net inflow is 9.5 billion US dollars, compared to the 11 billion US dollars increase in the issuance of stablecoins. Therefore, the inflow of stablecoin funds still exceeds the inflow of ETF funds, which is the biggest driving force for the rise in the coin circle. However, we know that ETF funds are only used to purchase BTC. The funds of stablecoins also include other altcoins. Therefore, the funds from ETFs play a more dominant role in the rise of BTC.
From the relationship between the price and the net inflow of ETFs, it is obvious that ETFs are highly coupled with the price of BTC. Around January 20th, when there was a net outflow, BTC was in a state of decline and bottoming out. When there was a net inflow, BTC was in a state of rise. In other words, the funds from ETFs in the United States dominate the price factors of BTC.
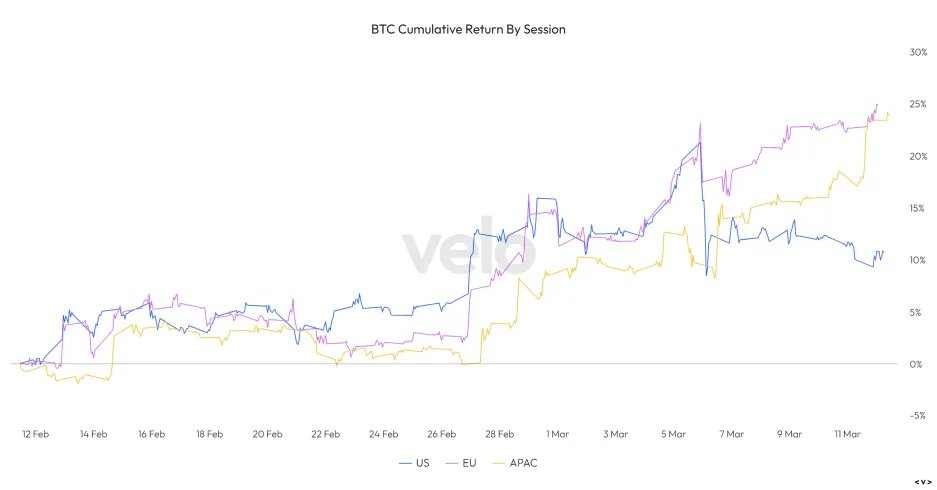
4 Trends of US and Asian funds
Looking at the contributions to the rise of BTC from various time zones over the past month, initially the US time zone has always been in the lead, meaning the United States is the biggest driving force behind the rise of BTC, and the contribution of Asian funds to BTC has been relatively small. However, starting from March 6th, there are signs of withdrawal of funds from the United States, and BTC has instead fallen by 15% in the US time zone. The main force behind the rise has shifted to Asian funds.
And looking at the cumulative contributions of Asian funds to the rise of BTC over the past month, it has far exceeded that of the United States. Historically, the sustainability of Asian funds is not long, so this may not be a very good signal.
5 Analysis of BTC whale data
Over the past month, the inventory of BTC on exchanges has been in a continuous decline, from 2.363 million to 2.28 million, a net outflow of 83,000. At the same time, the number of large holders with more than 10,000 BTC has decreased by 1, and the number of large holders with more than 1,000 BTC has decreased by 9, while the number of large holders with 100 BTC has increased by 190. So the net outflow of BTC on exchanges basically corresponds to large holders holding around 100 BTC. Looking at the data from the past week, the inventory of BTC on exchanges still continues to decline, and the number of large holders with more than 10,000 BTC has not changed. The number of large holders with more than 1,000 BTC has seen a significant decrease, decreasing by about 50, while the number of large holders with 100 BTC has increased by about 80.
免责声明:本文章仅代表作者个人观点,不代表本平台的立场和观点。本文章仅供信息分享,不构成对任何人的任何投资建议。用户与作者之间的任何争议,与本平台无关。如网页中刊载的文章或图片涉及侵权,请提供相关的权利证明和身份证明发送邮件到support@aicoin.com,本平台相关工作人员将会进行核查。


