2月1日下午,AICoin 研究员在【AICoin PC端-群聊-直播】进行【了解成交量的秘密信号(送会员)】的图文直播分享,以下是直播内容汇总。
一、成交量与K线关系
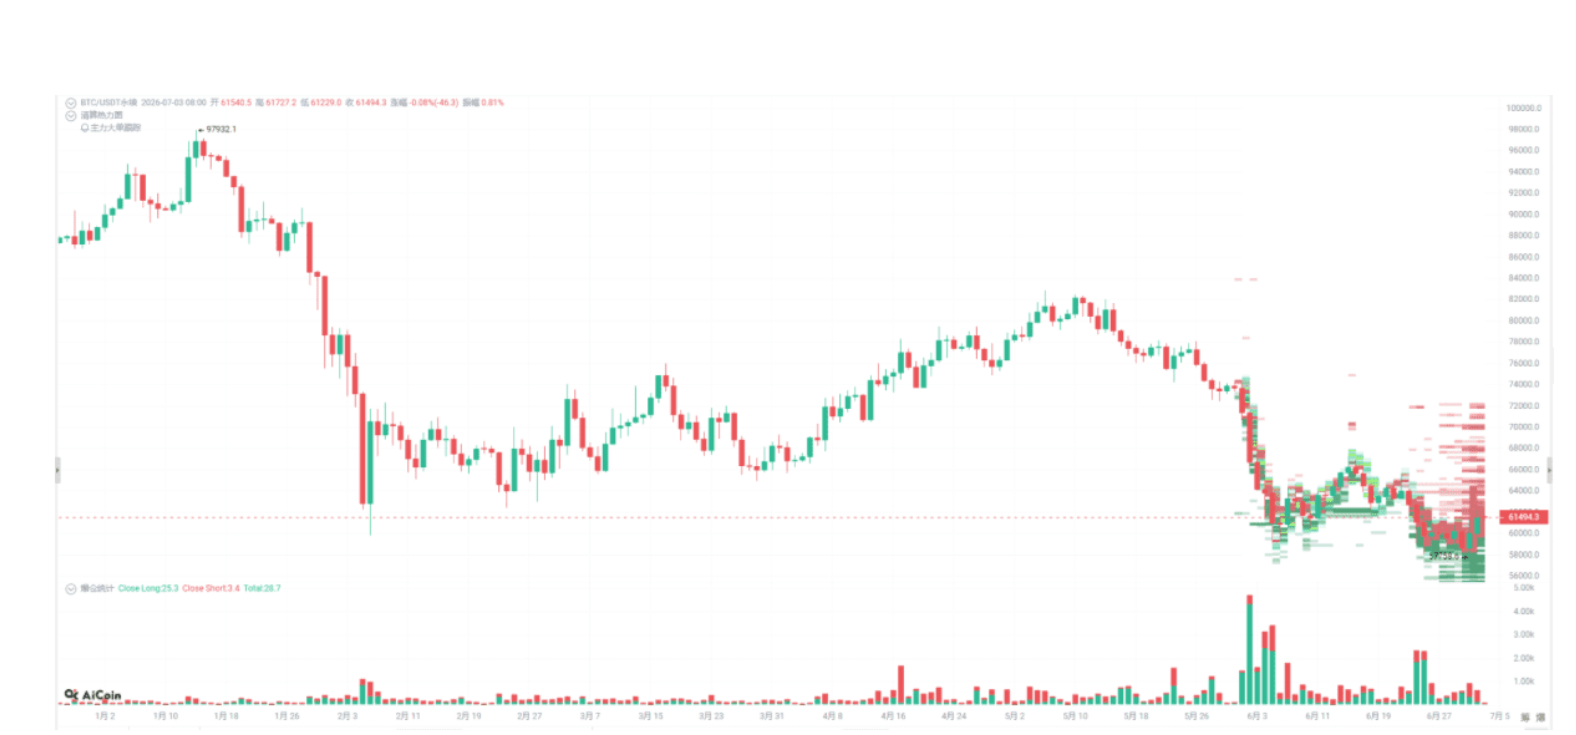
任何一个大阳k线、阴k线背后注定代表的是资本的流向。成交量是市场参与度的直接体现,它可以帮助我们理解当前走势背后的力量和可能的趋势变化。
二、量价结构分析
1、量价配合分析
量价配合的情况下,数量和价格由市场供需关系和交易动力所决定的。
(1)、供需关系:
当买卖双方供需力量平衡时,价格变动较小。因此,在力量平衡,既没有显著的买入冲动也没有强烈的卖出压力的情况下,成交量往往会比较小,对应的K线也比较短小。

(2)、交易动力
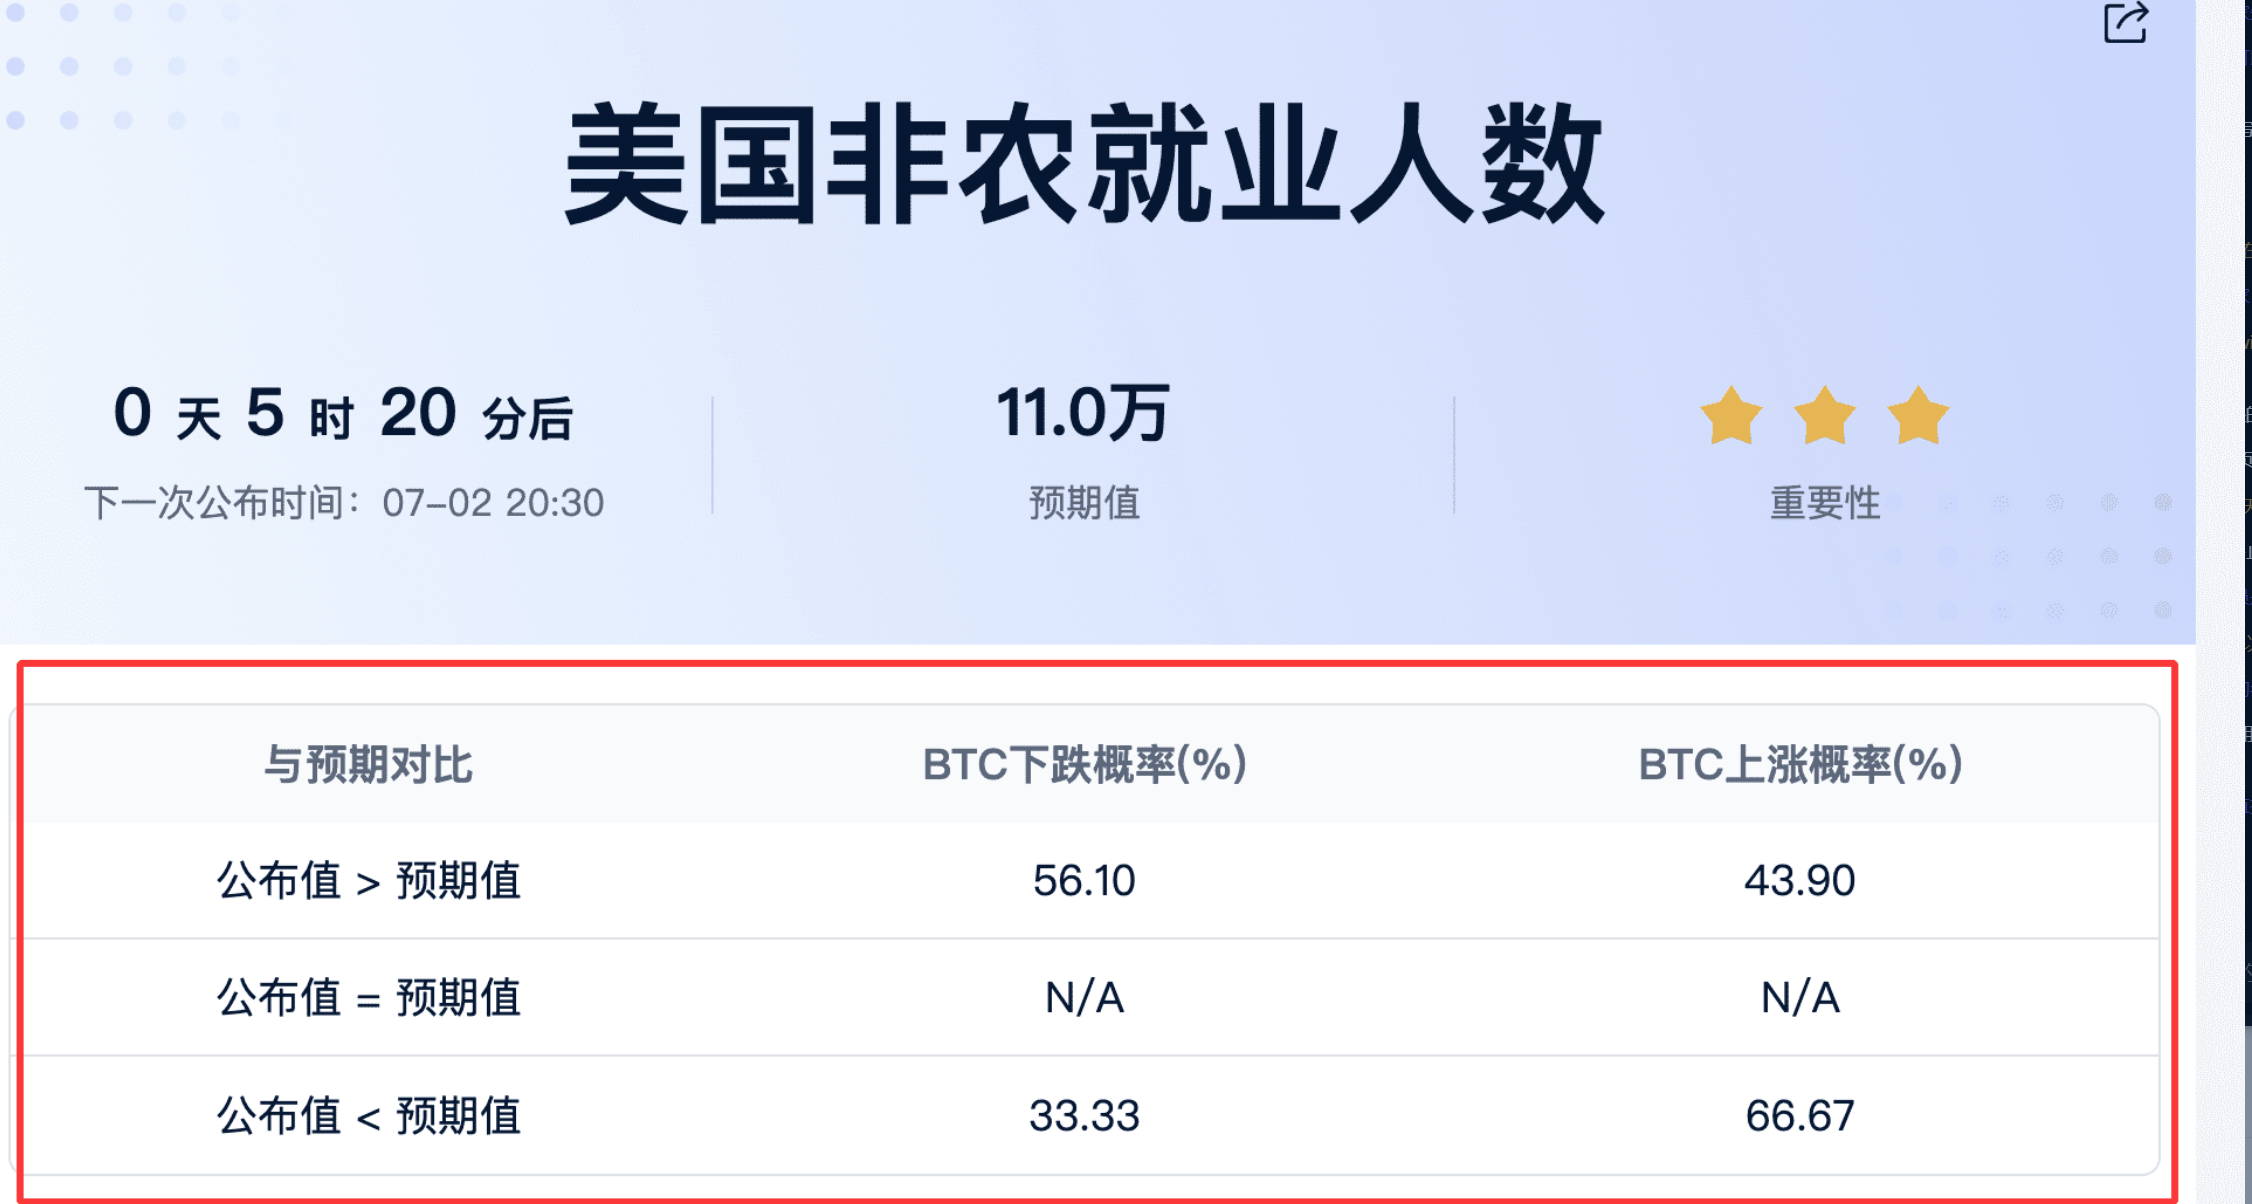
大成交量往往代表市场有更强烈的买卖双方参与。这可能是市场消息、事件或分析报告触发了交易者的买卖行为,从而形成了较大的价格波动。当存在一个方向上的强烈趋势,比如价格明显上升或下降时,相应地,成交量会增加,对应的K线实体部分也会更大。另外参与者热情交易,交易频率速度变快也会导致成交量变大。任何新消息或数据都可能会迅速被市场吸收并反映在价格上。
(3)、量价配合总结
总结:正常的量价配合的情况下,
小成交量对应小k线,大成交量对应大k线;
量价由供需关系和交易动力决定的。
2、量价异常的识别和分析
(1)、放量不涨
A、原因:
大量主力在盘口挂单,很小价格区间,在盘口里压了很大单 ,这就形成了放量滞涨;
卖方不停的砸、小散户把钱砸进去、吃了这些小单子,形成底部放量不涨。

B、分三个阶段来分析放量不涨:
一个市场周期我们可以简单划分【吸筹区-拉升区-出货区-下跌区】。
3个阶段分别:底部放量、中部放量、顶部放量。


第一阶段:底部放巨量滞涨【好现象】
•底部:在一段时间的下跌之后,开始在某个价格区间形成横盘,这个区间被视作价格的潜在支撑位,就像价格下跌到了一个“谷底”。
• 放量:在一定的时间段内,交易量显著增加。
意味着市场参与度的增加,反应了更多的买卖力量的介入。
•滞涨:尽管交易量增加,但是价格并没有相应的大幅上涨,呈现出价格上涨动力不足的状态。
•解读:可能是有庄家或大资金在低位吸筹,或者发生抛售洗盘的动作。如果没有随后的下跌,那么这往往可以视为潜在的买入机会,因为可能预示着市场底部形成。
•行动:关注后续的价格走势和成交量变化,如果后续成交量减小且股价稳定或开始缓慢上升,则可能确认底部确立。底部就是一个绝佳买点。
第二阶段:中部盘整放巨量
•我们看里面结构的量是否规则?
I·是否符合量价匹配
II·左边的支撑压力、大盘指数 (看看有没有可能有第三波?)中位盘整放巨量:「可能性」对倒拉升/出货/派发(对倒就是机构左手倒右手)。
•行动:观察市场后续行为以判断趋势。如果价格开始下跌,可能需要考虑止损;如果价格继续上升,表明此前的放量可能仅是过渡性稳定或是积聚力量的表现。
第三阶段:高位放巨量
估值区炒作过高远离价值,底部巨量不涨,这个位置极有可能要派发。
• 行动:如果巨量后价格跌破关键支撑位,或者其他技术分析(如形态、指标等)提示卖出信号,这可能是一个做空或卖出信号。尤其是结合图形学的顶部反转模式(如头肩顶等),应更为警觉。
C、放量总结:
看放巨量的位置到底是在底部、中部还是高位
底部放量:睁大眼,可能是绝加的买入机会
中部放量:需要后续的价格行为确定、如果价格下降止损;如果继续上升,可能只是短暂的稳定
顶部放量:跌破关键位置(结合形态学、其他方法) 好现象 做空!!
(2)、缩量大涨。
A、含义:价格涨这么高,成交量这么低

B、分析:
a·有资金、机构进入;这时买入可能要大赚,耐心持有,可能准备要拉。
b·没有资金、机构进入;涨了这一波、继续涨,这种可能是大机构错过了。但是这种一般要有实质性消息,有基本面。涨了一波、就跌;这种可能就是庄家拉升测试,看有没有人跟。

C、缩量总结:
查看前段有无主力进入,
看前段有没有量价配合。
D、判断大量资金进入3个方法:
第一个方法:盘口点击主力大单,

看主力,看主力就是看量持续情况,看主力把握市场机会。

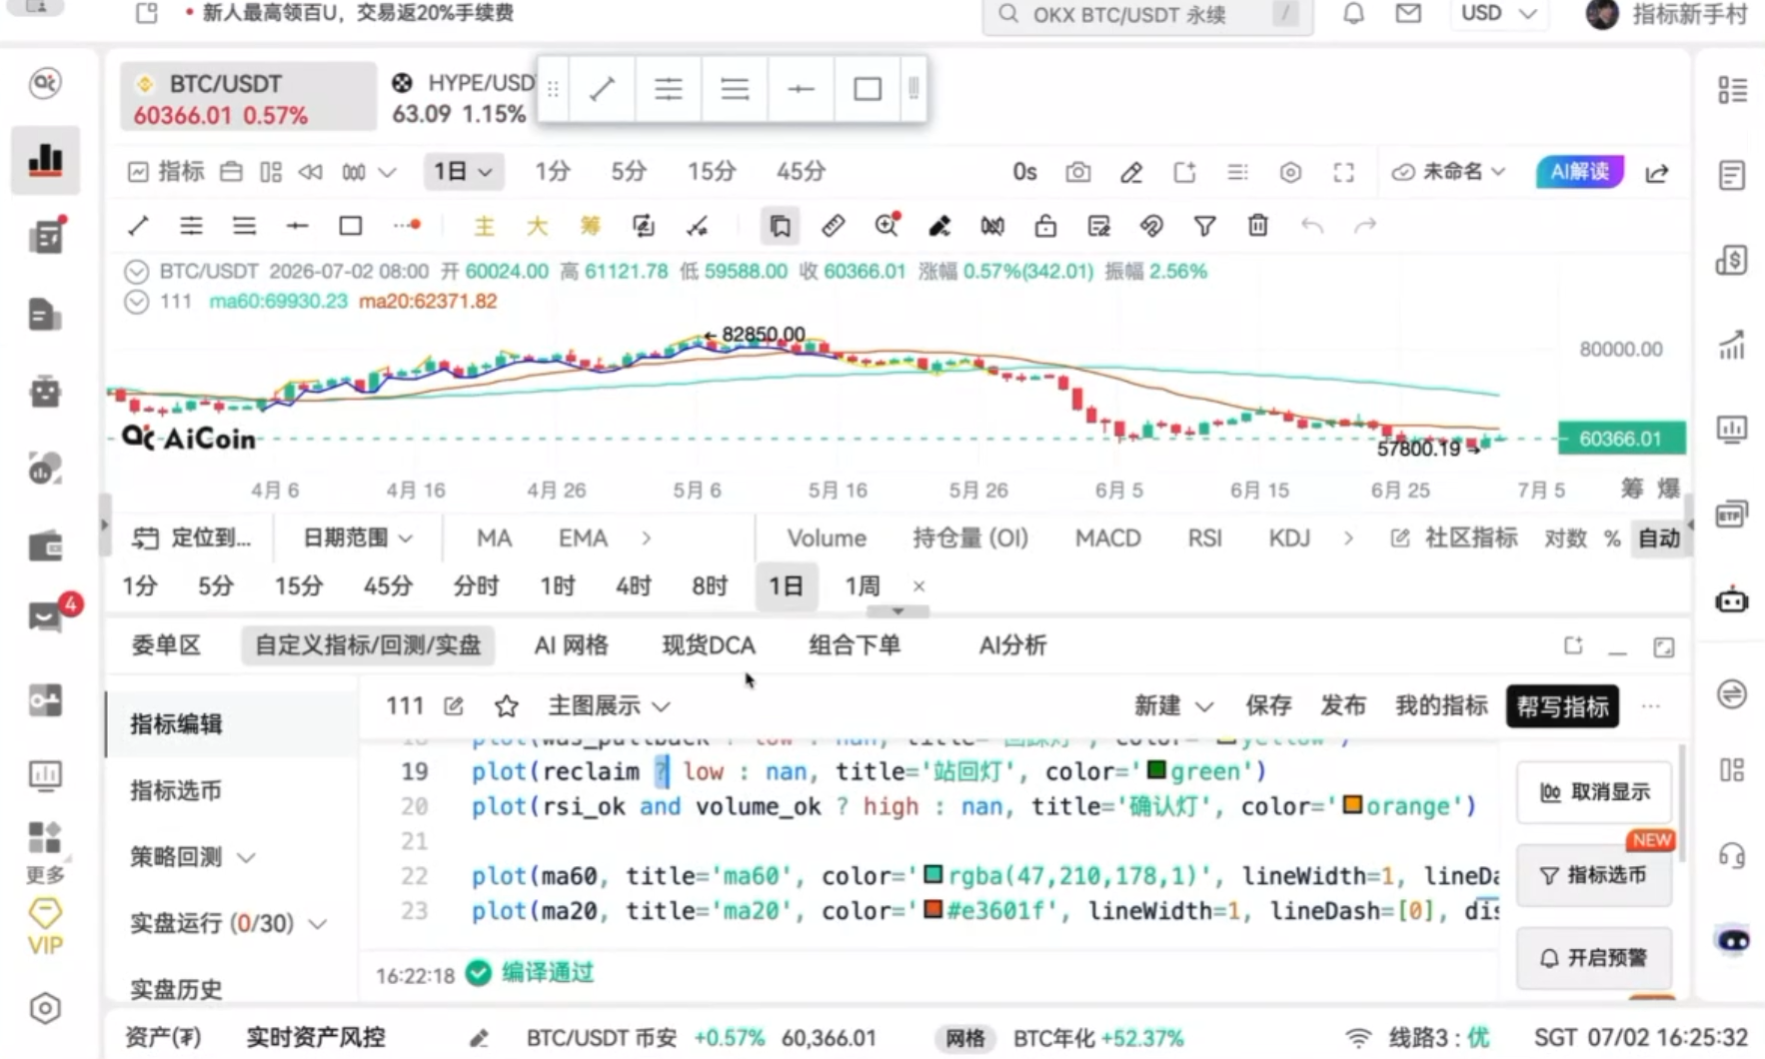
第二个方法:从指标库选择主力大单,查看指标。

第三个方法:设置预警。

PRO版K线主力大单,实时监控盘口里面的大额委托单,查看挂单情况并可以设置预警实时提醒,帮助用户更高效地判断主力买卖方向,更准确地把握进场时机。击下方链接开通自动进行PRO群:https://www.aicoin.com/zh-CN/vip
3、量价结构分析总结知识点:
·原理:
量价由供需关系和交易动力决定的
·量价配合稍宽心
大k线对应大成交量,小k线对应小成交量;
·量价异常睁大眼
a·巨量不涨分情况 — 底部有机会、中部需观望、高位巨量要谨慎;
b·缩量上涨较复杂 — 核心看前段有没有量价配合。
三、实战案列研究与买卖点位把握
1、把握量价异常,如下图四步设置


最后点击保存,点击显示到k线。

这样图就显示小箭头,小箭头的位置就是点位机会点。

2、指标应用场景
放量和缩量的成交量策略通常确实在有明确趋势的交易对中效果更佳。因为成交量变化可以作为趋势强度和持续性的一个衡量指标。当交易对有明确的上升或下降趋势时,放量可能表明趋势有广泛的市场支持,增加了趋势延续的可能性。
知识点:放量上攻,短线看多;放量下跌,短线看空
如果不知道调参,进入「PRO CLUB」专属群聊。 我们研究院也会在后续常驻PRO群;各位PRO会员可以多和我们研究院交流。同时即时发布最新PRO专享数据解读。击下方链接开通自动进行PRO群:https://www.aicoin.com/zh-CN/vip
推荐阅读
更多直播干货,请关注AICoin“新闻/资讯-直播回顾”栏目,欢迎下载AICoin PC端
免责声明:本文章仅代表作者个人观点,不代表本平台的立场和观点。本文章仅供信息分享,不构成对任何人的任何投资建议。用户与作者之间的任何争议,与本平台无关。如网页中刊载的文章或图片涉及侵权,请提供相关的权利证明和身份证明发送邮件到support@aicoin.com,本平台相关工作人员将会进行核查。