TL;DR
- IOSG research indicates that we are currently in the sixth cryptocurrency bull market cycle, which has been ongoing for over a year.
- Based on historical market cycle patterns, IOSG believes that we are currently in the middle to later stage of a medium-length bull market cycle, transitioning into the climbing phase.
- Recently, the cryptocurrency market has seen the second occurrence of the 50-day moving average crossing above the 200-day moving average, signaling a positive trend. This technical indicator has a stable historical backtesting data, with over 80% of cases showing positive returns in the mid-term.
- Compared to previous cycles, the current Bitcoin bull market cycle is unusually stable, but referencing historical patterns, IOSG expects at least 10 more corrective pullbacks (exceeding -5%) before reaching the peak of this cycle.
- Before and after the Bitcoin halving event, the price of Bitcoin often experiences significant increases.
- IOSG: Although the Bitcoin halving event coincides with market cycle changes, they may not be direct causes of market changes, but rather consistent with broader global economic trends.
Research Motivation
To better understand and respond to the current market conditions, we need to study the formation and development of historical market cycles, as well as the various factors that influence these cycles.
Drawing from the lessons of past market cycles, we can gain a deeper understanding of market behavior. Additionally, understanding the duration, magnitude, and characteristics of past cycles can provide valuable background for evaluating current market conditions and identifying potential market turning points.
About Cyclicality
Market cycles are typically defined as the period between two major lows of a broader market index (such as the S&P 500 index). Global market cycles are influenced by business cycles, economic conditions, and investor sentiment. At a more micro level, various industries, sectors, and assets bear the imprint of these macro cycles, but are still influenced by their own unique factors.
In general, cycles have four distinct stages or periods that describe market participant behavior: accumulation (attracting chips), markup (rising trend), distribution (distributing chips), and markdown (declining trend).
In the initial stage, the accumulation period marks the end of a downtrend. The prevailing sentiment is one of distrust and uncertainty, with market participants cautiously navigating an environment of low price volatility.
Transitioning into the markup period, the bull market takes center stage. Investor sentiment becomes optimistic and active, and the market exhibits an upward trend in prices.
In the distribution stage of the market cycle, the narrative of sentiment begins to change, with market sentiment being dominated by overconfidence and greed.
Finally, the markdown period marks the arrival of a bear market. Anxiety and panic dominate market sentiment, and the trend of price charts continues to decline. The shadow cast by unfavorable economic conditions further intensifies investor unease during this stage.
In this section, we focus on analyzing the inherent cyclicality of the cryptocurrency market, with a specific focus on Bitcoin. Bitcoin has the highest market capitalization, a large market value, and high trading volume, occupying an important position in the digital currency market. The price fluctuations of Bitcoin often lead to corresponding adjustments in the prices of other cryptocurrencies that are usually highly correlated with it.
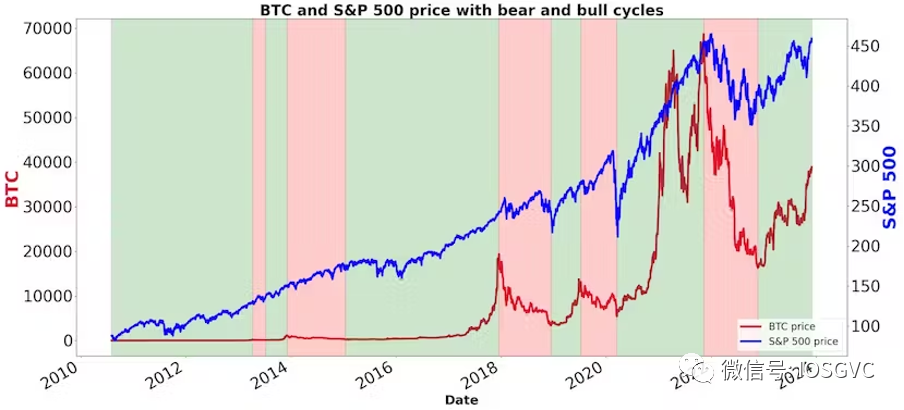
Since its inception, BTC has averaged an annual increase of over 2 times, however, with a more macro perspective, we can identify clear cycles.
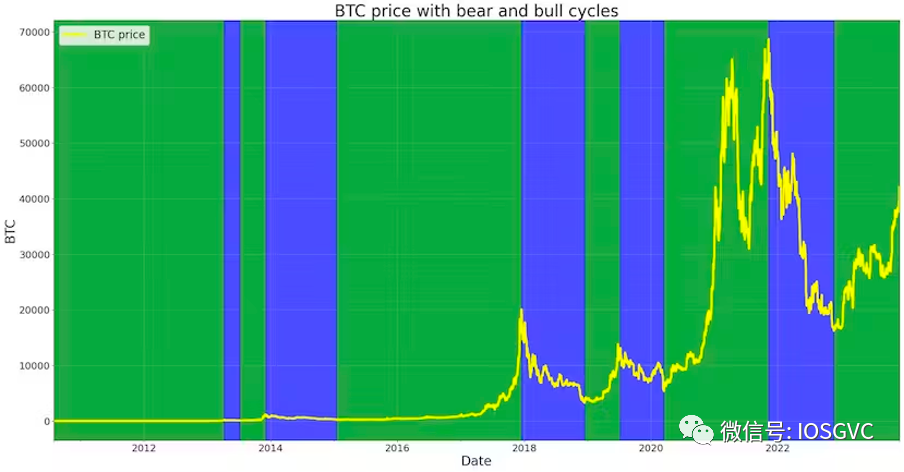
Source: IOSG Ventures
So far, we have experienced five (six including the current cycle) bull market cycles (green area) and five bear market cycles (blue area).
Currently, the cryptocurrency market appears to be in the middle of the sixth bull market cycle, experiencing an upward trend. The accumulation period—the initial stage of the cycle—extended from the end of 2022 to the summer of 2023, when Bitcoin's volatility reached historic lows.
Exploring Historical and Current Parallel Performances
There is currently a school of thought that denies the effectiveness of technical analysis, arguing that historical price and volume data lack the consistent predictive ability required to forecast future stock prices. Their view suggests that relying on past price trends and trading volume does not provide inherent advantages in predicting market trends. We tend to agree with this view, especially when evaluating the performance of individual assets in isolation.
However, on the contrary, we also believe that analyzing historical information is valuable for understanding the cyclicality of the market. While it may not provide precise predictions of future price trends, analyzing historical data can cultivate intuition and help avoid bias. By carefully studying market cycles, it can help avoid unnecessary bullish enthusiasm, such as holding supercycle rhetoric during market upswings (greedy period), and counteracting bearish rhetoric during market downturns (panic period). This can cultivate a resilient and insightful mindset, enabling a more rational and prudent response to market fluctuations, unaffected by temporary market sentiment.
Basic Data Statistics
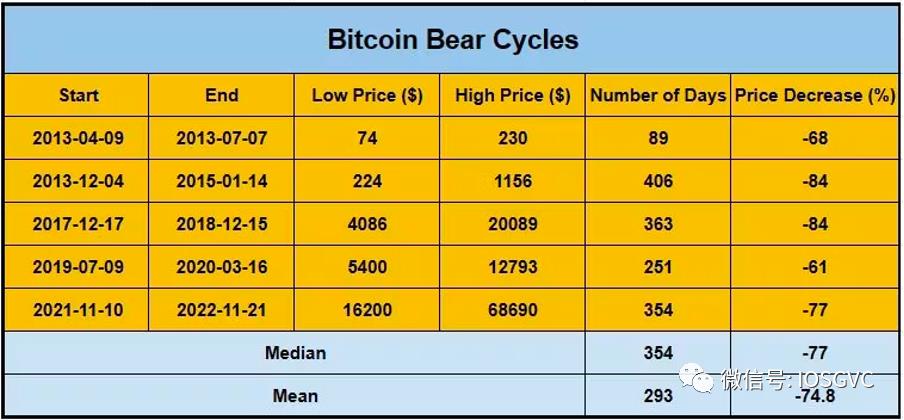
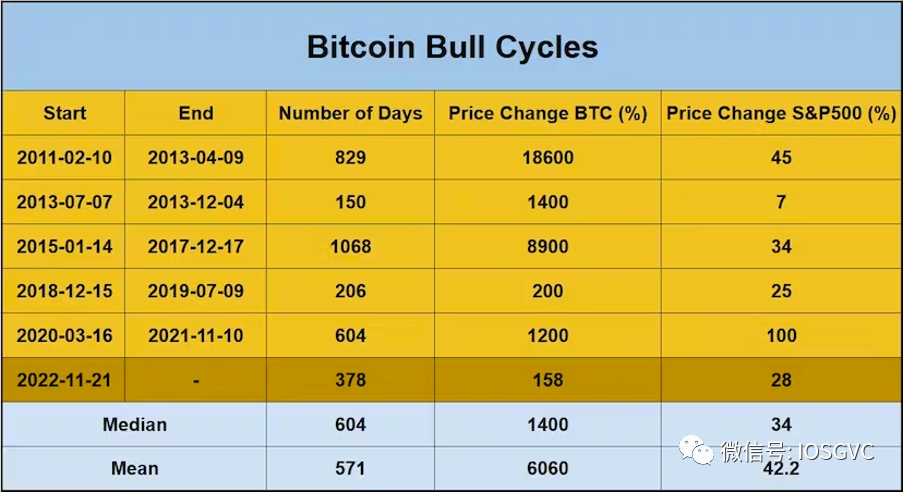
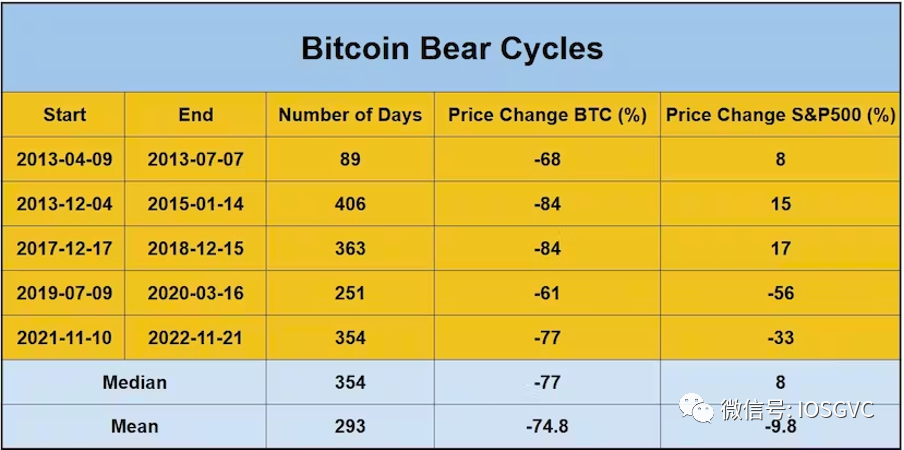
In the table below, we present the statistical data for each historical bull and bear market cycle.
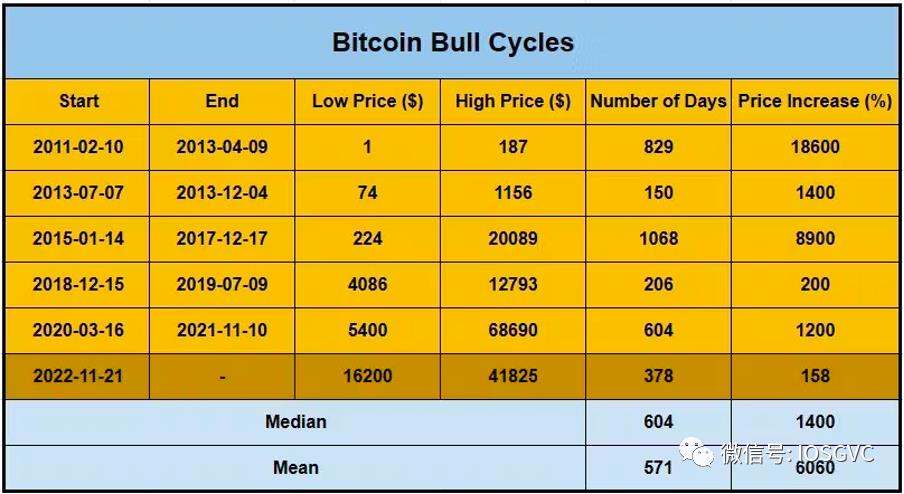
Source: IOSG Ventures
Analyzing past cycles, the median decline in previous bear market cycles was -77% (average decline was approximately -75%). The recent bear market cycle has precisely declined by 77%. On the other hand, the median price increase for bull market cycles was 15 times (average increase was approximately 60 times).
As for the duration of the cycles, the median duration of bear market cycles was 354 days, with an average duration of 293 days. The recent bear market cycle lasted for 354 days. For bull market cycles, the median duration was 604 days, with an average duration of 571 days.
Bull Market Countdown
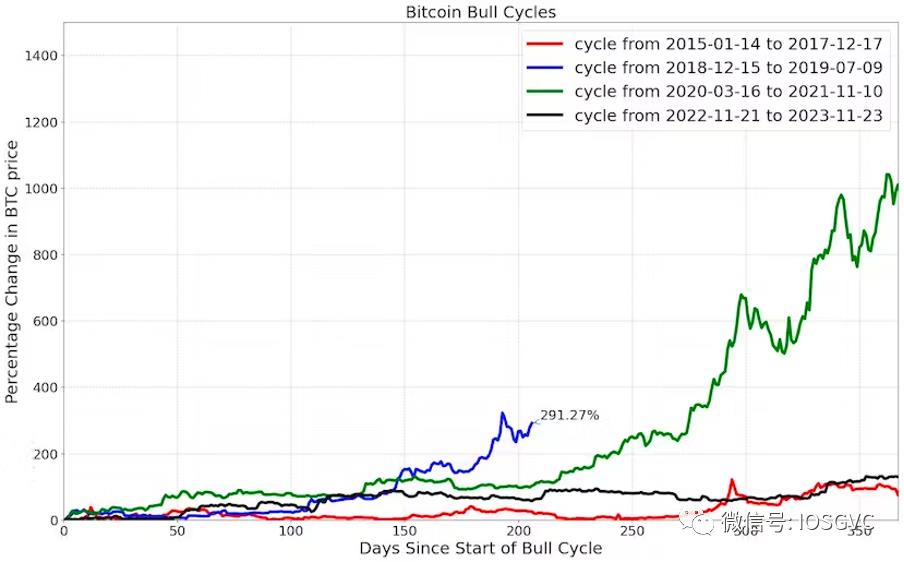
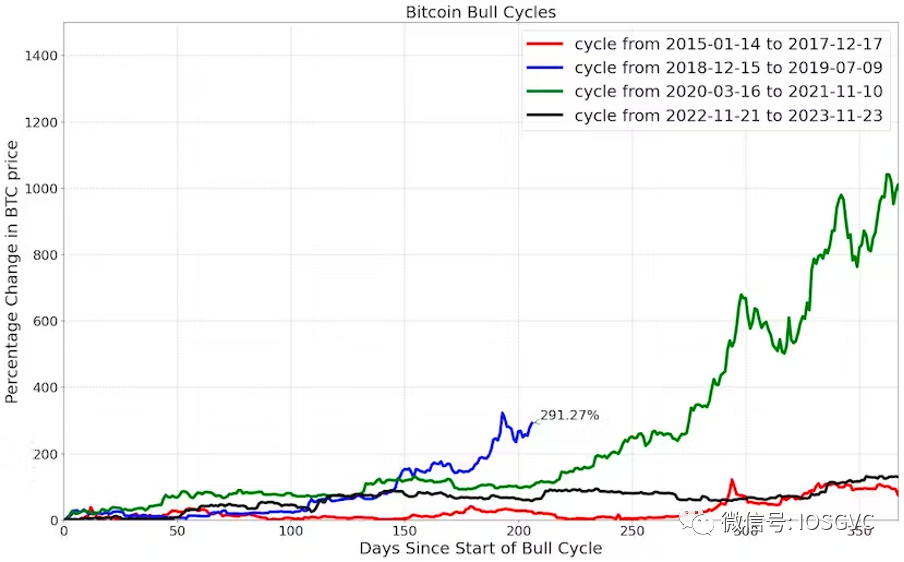
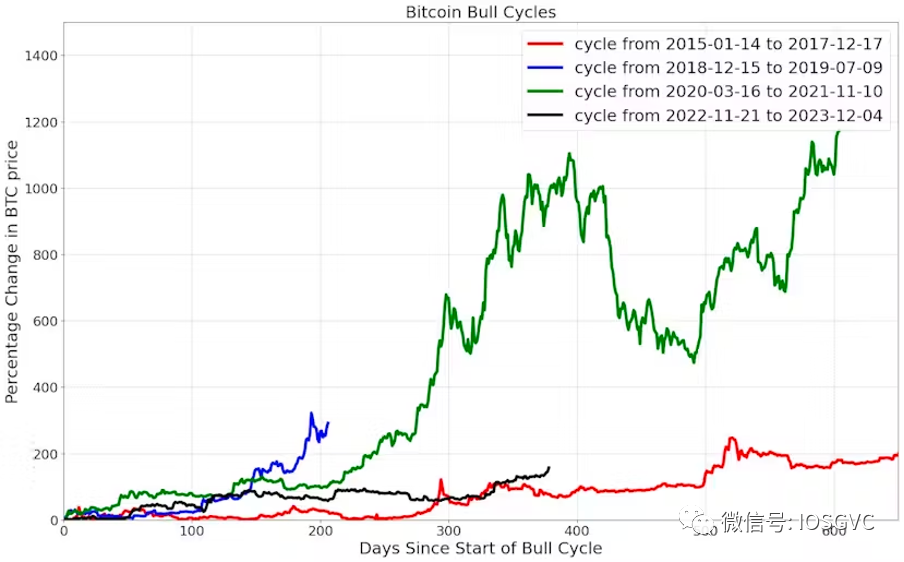
The current bull market cycle has lasted for about a year. Below, we will compare the returns of Bitcoin in this cycle with the returns in the previous cycles within a similar time window.
Source: IOSG Ventures
The bull market cycle of 2018-2019 ended in less than a year, with a return of approximately 3.9 times. The cycles of 2020-2021 and 2015-2017 lasted for over a year, with returns of 11 times and 1.9 times, respectively, within the initial 365 days. Essentially, the returns of the 2020-2021 cycle were mainly realized in the first year of the bull market, while the 2015-2017 cycle accelerated performance after the first year.
For the current bull market cycle, the price of Bitcoin has increased by 2.6 times from the bottom, roughly in the middle of a medium-duration bull market cycle.
Source: IOSG Ventures
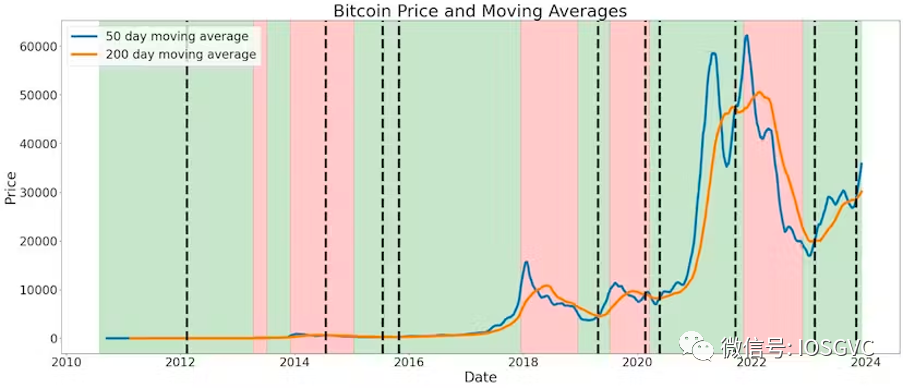
In the past few weeks, for the second time since the beginning of this cycle, the 50-day moving average (MA) has crossed the 200-day MA. In fact, we rarely see this pattern occur twice in a short period of time. Historically, this event only occurred once during the 2015-2017 bull market period.
Source: IOSG Ventures
At that time, after the second 50/200-day MA crossover during the 2015-2017 bull market cycle, the results for BTC were as follows:
- 90 days later - return rate of 1.27 times
- 180 days later - return rate of 1.43 times
- 365 days later - return rate of 2.26 times
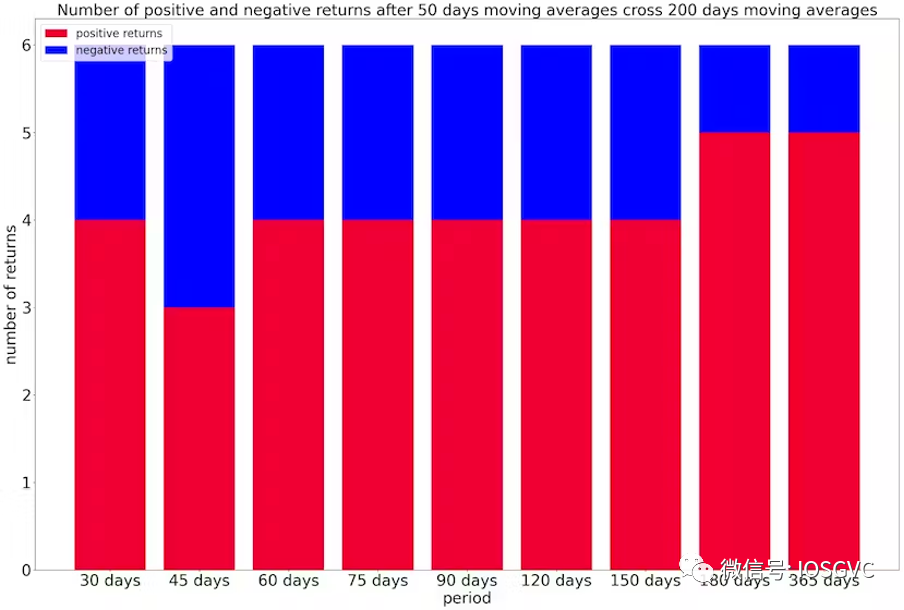
Looking at the entire history of Bitcoin prices, the 50-day MA has only crossed the 200-day MA in 6 instances. From a probabilistic standpoint, it can be predicted with over 80% likelihood (5 out of 6 instances in history) that there will be a positive return one year after the crossover event.
Source: IOSG Ventures
On average, after bull market crossover events, the expected Bitcoin (BTC) return rates are as follows:
- 90 days later: 1.1 times
- 180 days later: 1.33 times
- 365 days later: 2.5 times
Rough Road Ahead
According to IOSG observations, the smoothness exhibited by this bull market cycle exceeds that of any previous cycle in Bitcoin's history.
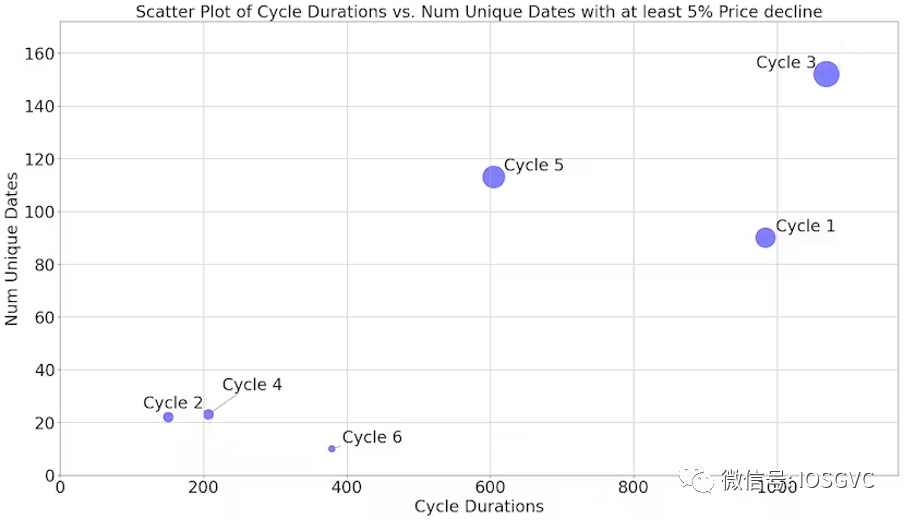
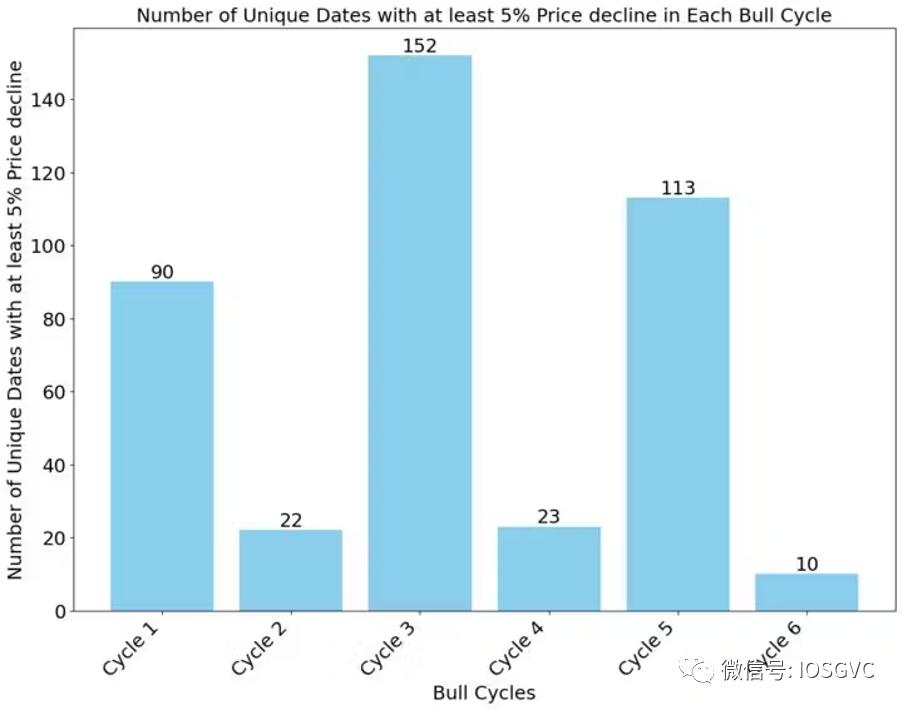
In the process of Bitcoin reaching its peak, the previous cycle experienced nearly 115 daily corrections of 5% or more (here we refer to negative returns as corrections), while this cycle has only experienced 10 such corrections. Even shorter cycles have had more corrections than this cycle.
So far, no bull market cycle has ended with fewer than 20 daily corrections of 5% or more. Therefore, if this bull market cycle is similar to previous ones, we expect at least 10 more corrections as the market continues to rise before transitioning to bearish sentiment.
Source: IOSG Ventures
Impact of BTC Halving
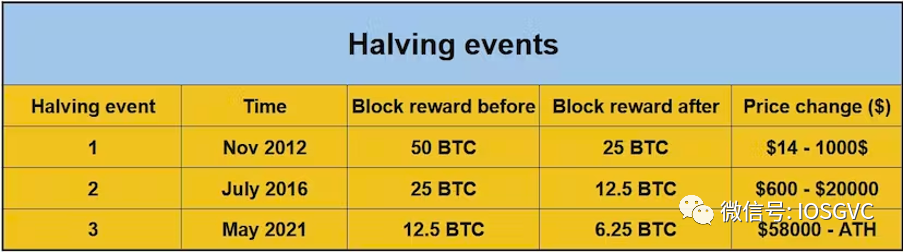
Bitcoin halving is a predetermined event within the network, occurring approximately every four years, especially when 210,000 blocks are mined. During halving, the rate of new BTC generation is halved.
This has a significant impact on Bitcoin miners, as their mining rewards are also halved. Therefore, mining becomes more competitive, prompting miners to seek more cost-effective energy to sustain their operations.
Additionally, halving significantly reduces the amount of new Bitcoin entering the market, leading many market participants to view halving as a bullish catalyst.
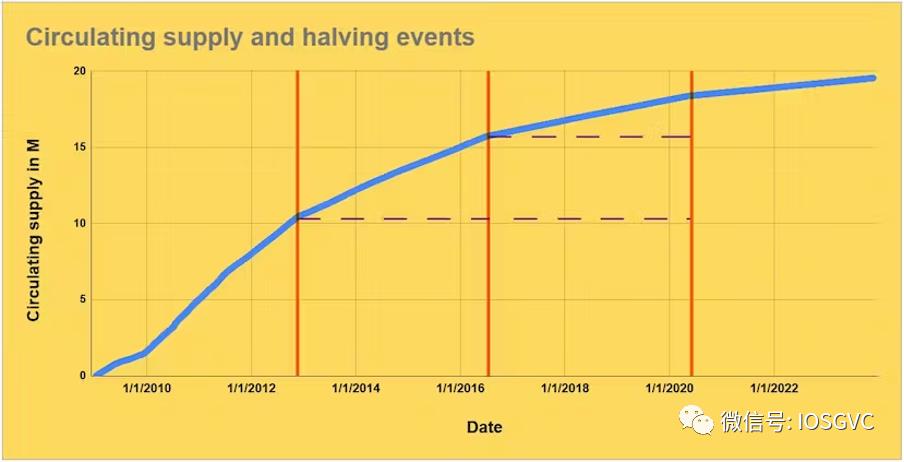
To illustrate the impact of halving, let's look at the issuance of Bitcoin before and after each halving. Before the first halving, the issuance of Bitcoin exceeded 10 million. Before the second halving, the issuance was slightly over 5 million, and before the third halving, the issuance was approximately 2.5 million.
These statistics highlight the decreasing issuance of new Bitcoin over time, emphasizing the scarcity and long-term appreciation potential of cryptocurrencies.
Source: IOSG Ventures
While analyzing only three historical halving events may not provide a statistically significant sample size to draw definitive conclusions, the importance of halving events in the Bitcoin community and the widespread discussion of their role as bullish catalysts cannot be ignored. Therefore, we will delve into the relevant data of historical halving events in the following sections.
Source: IOSG Ventures
The next halving is expected to occur around April 2024 at block 840,000. The mining reward will decrease to 3.125 BTC.
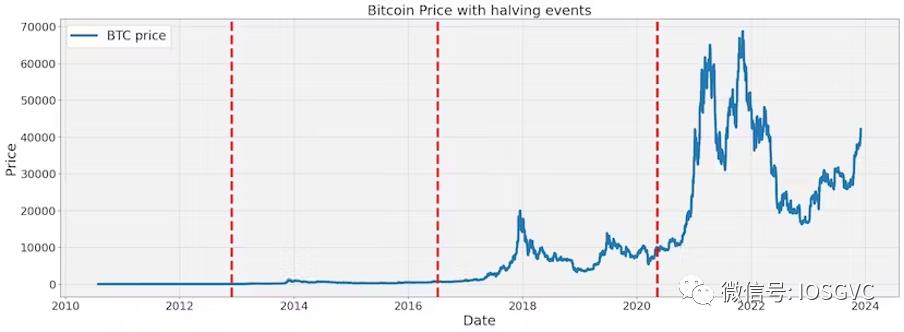
These cycles clearly show a correlation with halving events, and the change in BTC price after halving events is clearly visible in the chart:
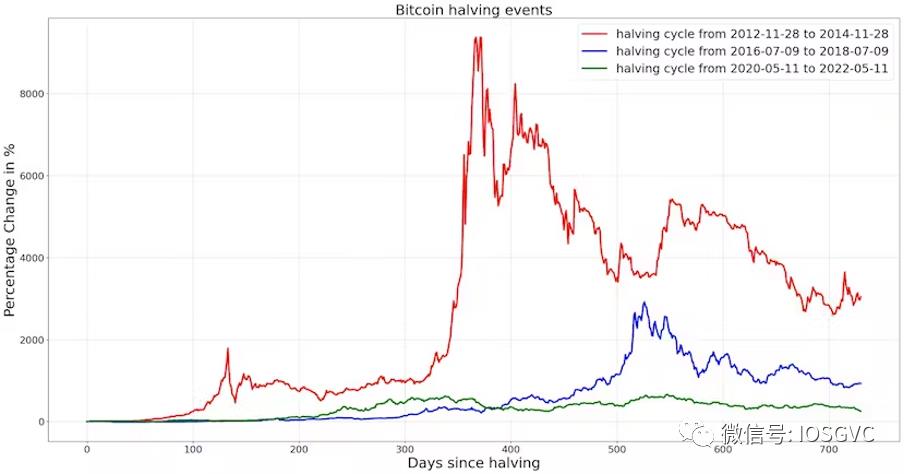
Source: IOSG Ventures
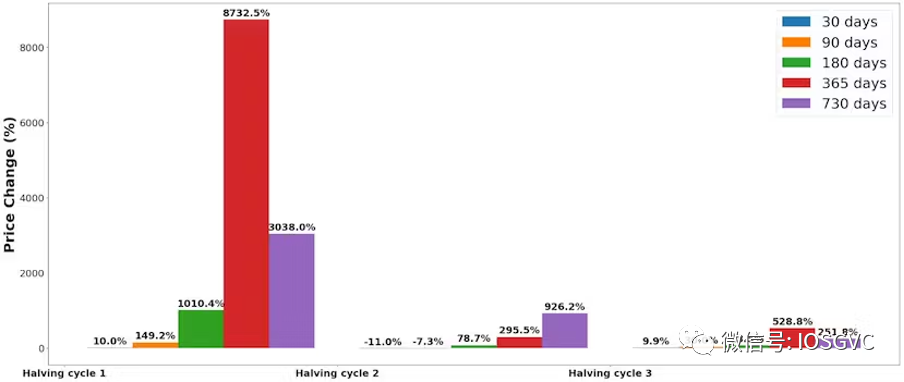
In percentage terms, as BTC becomes a more mature asset, the impact of halving gradually diminishes. After the last halving event, the price rose by over 6 times one year after halving.
Source: IOSG Ventures
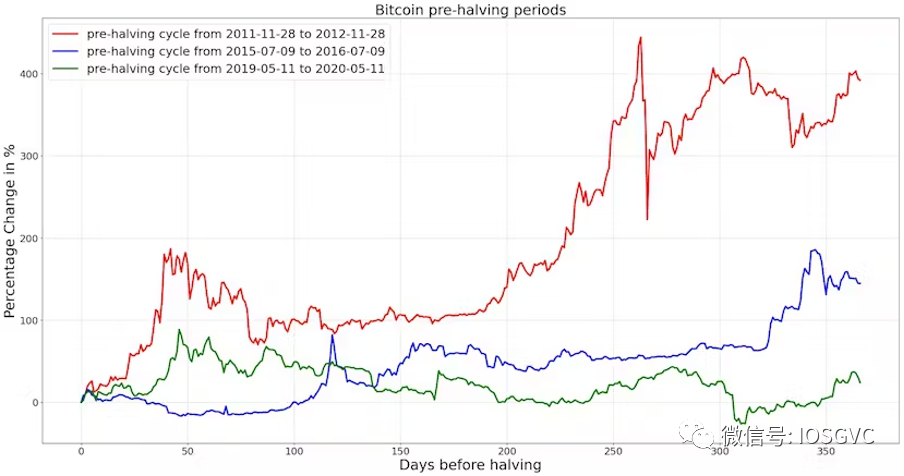
Analysis of Pre-Halving Period
In the expected halving event, we also observed a strong BTC price trend, although not as intense as post-halving. Similarly, in each new cycle, the increase has been moderate, ranging from 400% to 150%, and then to 25% before reaching the peak.
Source: IOSG Ventures
Overlap Analysis of Macro and Cryptocurrency Bull Market Cycles
Before determining the impact of halving events on the cyclicality of the cryptocurrency market, we should attempt to separate the influence of global macro cycles on cryptocurrencies.
Source: IOSG Ventures
As shown in the above chart, there is a lot of overlap, especially in recent years. Therefore, we cannot say that halving events play a decisive role in determining the timing of new cycles. While a positive macro environment may be the primary factor determining the cyclicality of cryptocurrencies, halving cycles and other specific cryptocurrency events may also have a significant impact on the scale of bull markets.
Source: IOSG Ventures
Cryptocurrency traders may closely monitor the macro environment, as the outcomes of interest rates, oil prices (energy costs), and ongoing geopolitical conflicts will have significant impacts on the overall macro cycle.
In the cryptocurrency space, the major bullish triggers so far have been a series of high-profile bank bankruptcies, speculation on cryptocurrency ETF products, and the resolution between Binance and regulatory authorities, eliminating one of the biggest potential black swan events.
Conclusion
While we remain optimistic for the next few months, historical trends from prosperity to correction remind us that reaching overvalued levels is not uncommon. We are at a point of overconfidence and greed, where overconfidence and greed often dominate, potentially leading to a volatile environment and irrational valuations.
Although this analysis suggests that the enthusiasm for cryptocurrency investment is expected to grow further and the positive momentum will continue, caution is also warranted.
After all, Bitcoin's current state is a more mature asset compared to earlier cycles. The increasing institutionalization and maturity of this asset class have raised concerns about the efficient market hypothesis coming into play. We recognize that as the asset matures, historical pattern analysis may become less applicable. Therefore, approaching and analyzing the market with a balanced and realistic perspective is highly valuable.
免责声明:本文章仅代表作者个人观点,不代表本平台的立场和观点。本文章仅供信息分享,不构成对任何人的任何投资建议。用户与作者之间的任何争议,与本平台无关。如网页中刊载的文章或图片涉及侵权,请提供相关的权利证明和身份证明发送邮件到support@aicoin.com,本平台相关工作人员将会进行核查。


