Yesterday's article mentioned two perspectives on the current market situation. Regardless of which one, it is to go long/cover short/sell short when a buying point appears at the 1-hour level, and to reduce long positions/sell short/cover long after an upward line segment appears at the 1-hour level. Only by following the market's rhythm in this way can one navigate the unpredictable small-scale market changes with ease. Let's take a look at the current market situation.
4-hour level:
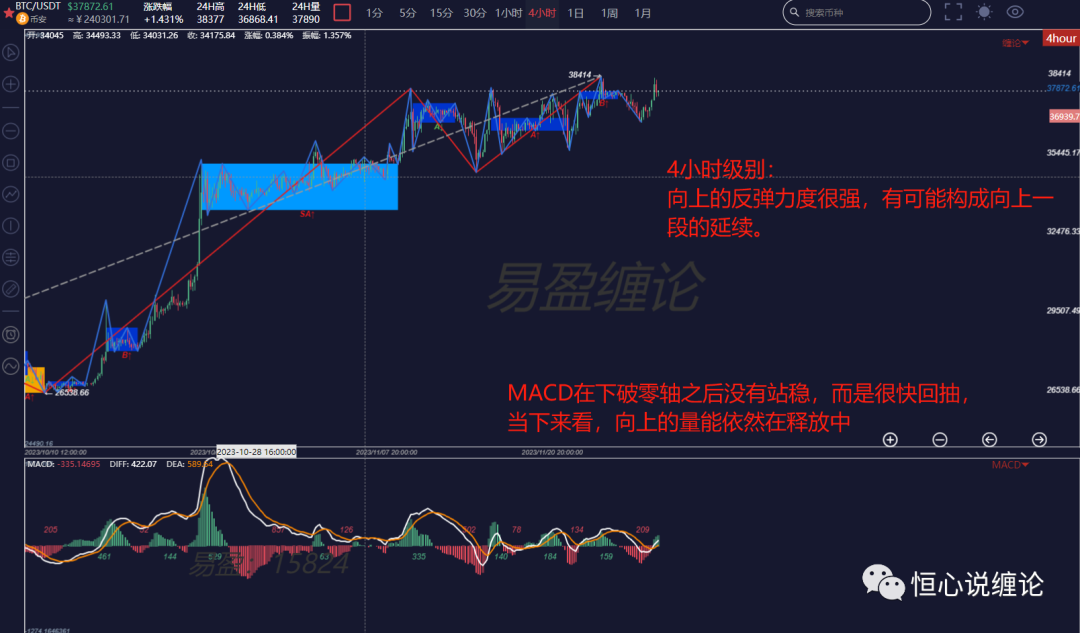
The MACD did not coil below the zero axis, but quickly rebounded to the zero axis. The bullish momentum is still strong. If high-level short positions have not been profitably closed at the low point, it is necessary to prepare for stop-loss.
Currently, it is necessary to patiently wait for the end of the 4-hour level's uptrend and wait for a selling point to appear.
1-hour level:
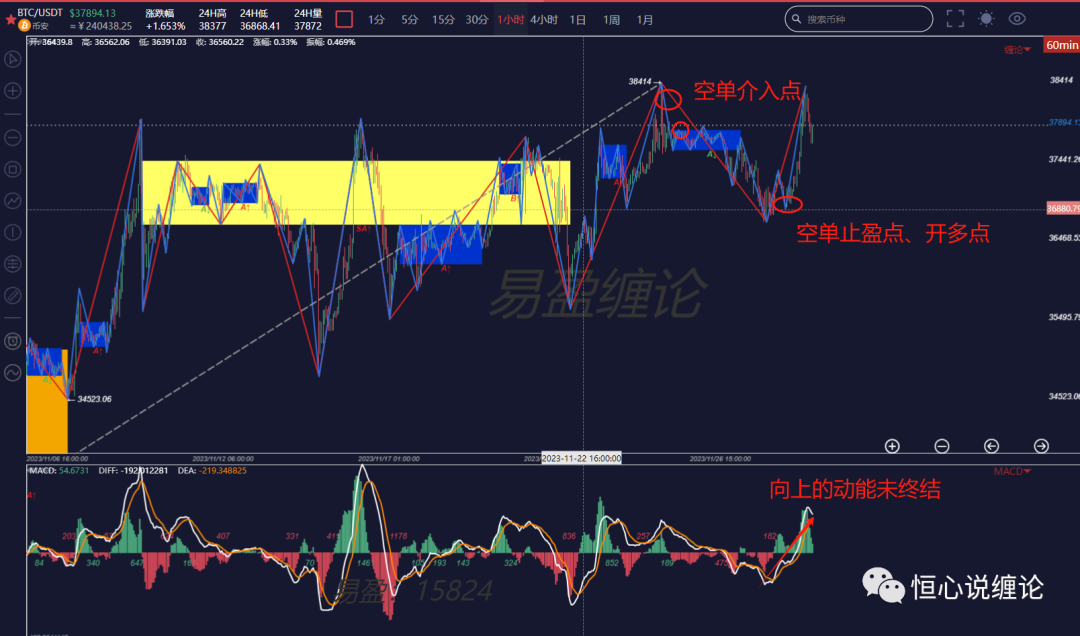
At the 1-hour level, the recent two segments have been very regular. At the high point, it is a divergence point for the 1-hour level upward trend, and secondary level double sells and quasi-double sells have appeared. After the subsequent downward segment, it moved for about 3-4 days and at the bottom (yesterday afternoon), a secondary level double buy appeared.
In yesterday's analysis, we saw that there was no obvious divergence at the 15-minute level at that time, but after the double buy appeared, the price pulled up. This once again warns us that not all reversals will have divergence! The complete internal structure + second type buying and selling points are signals that the market is about to reverse.
The same is true for the current situation. Although there is no divergence within the 1-hour level at the moment, it is expected to continue upward, but it is still possible to turn downward after a double sell or quasi-double sell appears. Therefore, holding long positions should reduce after the subsequent upward segment at the secondary level today (unless there is a violent non-divergent surge) for trading. Always put "do not count your chickens before they hatch" first.
Simple terminology explanation:
Level: A unique concept in the Chan theory, representing the market in two dimensions of time and space. The larger the level, the longer the time and the greater the fluctuation space, generally 4-hour level, 1-hour level, 30-minute level, etc.
Trend type: Divided into consolidation and trend, with upward and downward trends; each level has corresponding trend types
Line segment: Constituted by the trend type at the secondary level, "a segment of a certain level" specifically refers to a line segment
The views in the article are for learning reference only and do not constitute investment advice.
If you want to systematically study the Chan theory, use the Chan theory automatic drawing tool, participate in the offline Chan theory training camp, improve your trading skills, form your own trading system to achieve a stable profit target, and use the Chan theory technology to timely escape the peak and bottom. You can scan the following QR code to add the WeChat account (vhenrythu) for consultation and learning exchange!
免责声明:本文章仅代表作者个人观点,不代表本平台的立场和观点。本文章仅供信息分享,不构成对任何人的任何投资建议。用户与作者之间的任何争议,与本平台无关。如网页中刊载的文章或图片涉及侵权,请提供相关的权利证明和身份证明发送邮件到support@aicoin.com,本平台相关工作人员将会进行核查。


