一、多空比的核心原理
1. 多空比是什么?
BTC多空持仓人数比(BTC Long/Short Ratio)指数是指某一时间内持有对应合约币种多仓总人数与空仓总人数的比值情况。
多空持仓人数比是一个衡量市场参与者情绪分布的重要指标,可以从专业角度揭示市场内部的力量对比关系。由于市场机制决定了多头与空头的总仓位价值始终是对等的,这意味着真实的多空优势并不体现在仓位规模上,而是反映在个体参与者的数量关系中。当某一方的参与人数远超另一方时,必然导致单位仓位价值的分布失衡,这也暗示了该群体中散户参与的集中程度。
具体来说,当多空持仓人数比大于1时,表现为多头人数明显占优,这通常释放出市场情绪偏向乐观的信号,此时多数散户持倾向于看多。然而,过高的多空比可能意味着市场信心过于一致,潜在回调风险上升。相反,当多空持仓人数比小于1时,说明空头投入者的数量更占主导,多数散户可能倾向于看空,这通常反映出对价格下行的预期。专家会结合此类情绪指标与其他市场因子(例如资金流向、持仓金额变化等),综合评估市场状态,并精准定位情绪驱动的潜在市场拐点。

2. 核心逻辑
市场情绪指标: 多空比通过量化市场参与者的仓位分布,反映当前的整体情绪。
-
多空比高(>1): 多头人数更占优,可能代表市场信心较强,但也可能存在过热风险(多杀多)。
-
多空比低(<1): 空头人数更占优,通常说明市场偏悲观,但若过低也可能引发空头回补。
大户思维: 多空比过于极端时,可能代表市场预期一致,说明反向的一方正躲着大户准备出击。
3. 应用方式
多空持仓人数比与行情通常呈现反向关联。当市场行情下跌时,多空持仓人数比仍然持续增长;或者当行情上行时,多空持仓人数比反而呈现下降趋势,这往往预示着当前的行情方向大概率会延续此前的走势。
当多空持仓人数比处于极高或极低水平时,市场通常会出现短期的剧烈波动,例如插针现象的概率较高。
当行情处于高位时,如果多空持仓人数比出现明显上升,预示市场大概率可能发生反转行情。但如果高位行情下,多空持仓人数比处于适中水平(接近1:1的比例),则市场更可能延续此前的上涨趋势。
二、多空比跟踪策略分析
跟踪动态变化,捕捉机会:
通过观察市场多空比的动态变化,判断资金流向与市场情绪,确认买入或卖出信号,并及时抓住市场反转或顺势行情的关键交易机会。
1. 关注关键值突破,注意风险:
-
当多空比升破某个重要的关键值(如 1.6)时,意味着市场情绪倾向空头,整体市场大概率承受下行压力,此时风险加大。
-
主力做空的资金在此时往往更为集中,导致进一步下行概率较高,应谨慎操作或通过调整策略以控制风险。
2. 重点低位信号,留意机会:
-
当多空比跌破某个临界低值(如 1.08)时,主力做多资金逐步回流,情绪逐步转暖,市场整体上涨的概率增加。
-
此时应高度关注是否有反弹信号结合价格上行,抓住入场做多的潜在机会。
建议:
-
严格风控原则: 综合结合一定的止盈止损比例,为每次交易设置合理的风险控制界限,减少市场波动带来的收益冲击。
-
优化决策稳定性: 通过结合其他市场参数(如成交量、资金流向、技术指标等),进一步提升决策的准确性和连续性,确保收益与风险间的合理平衡。
三、多空比跟踪策略信号效果

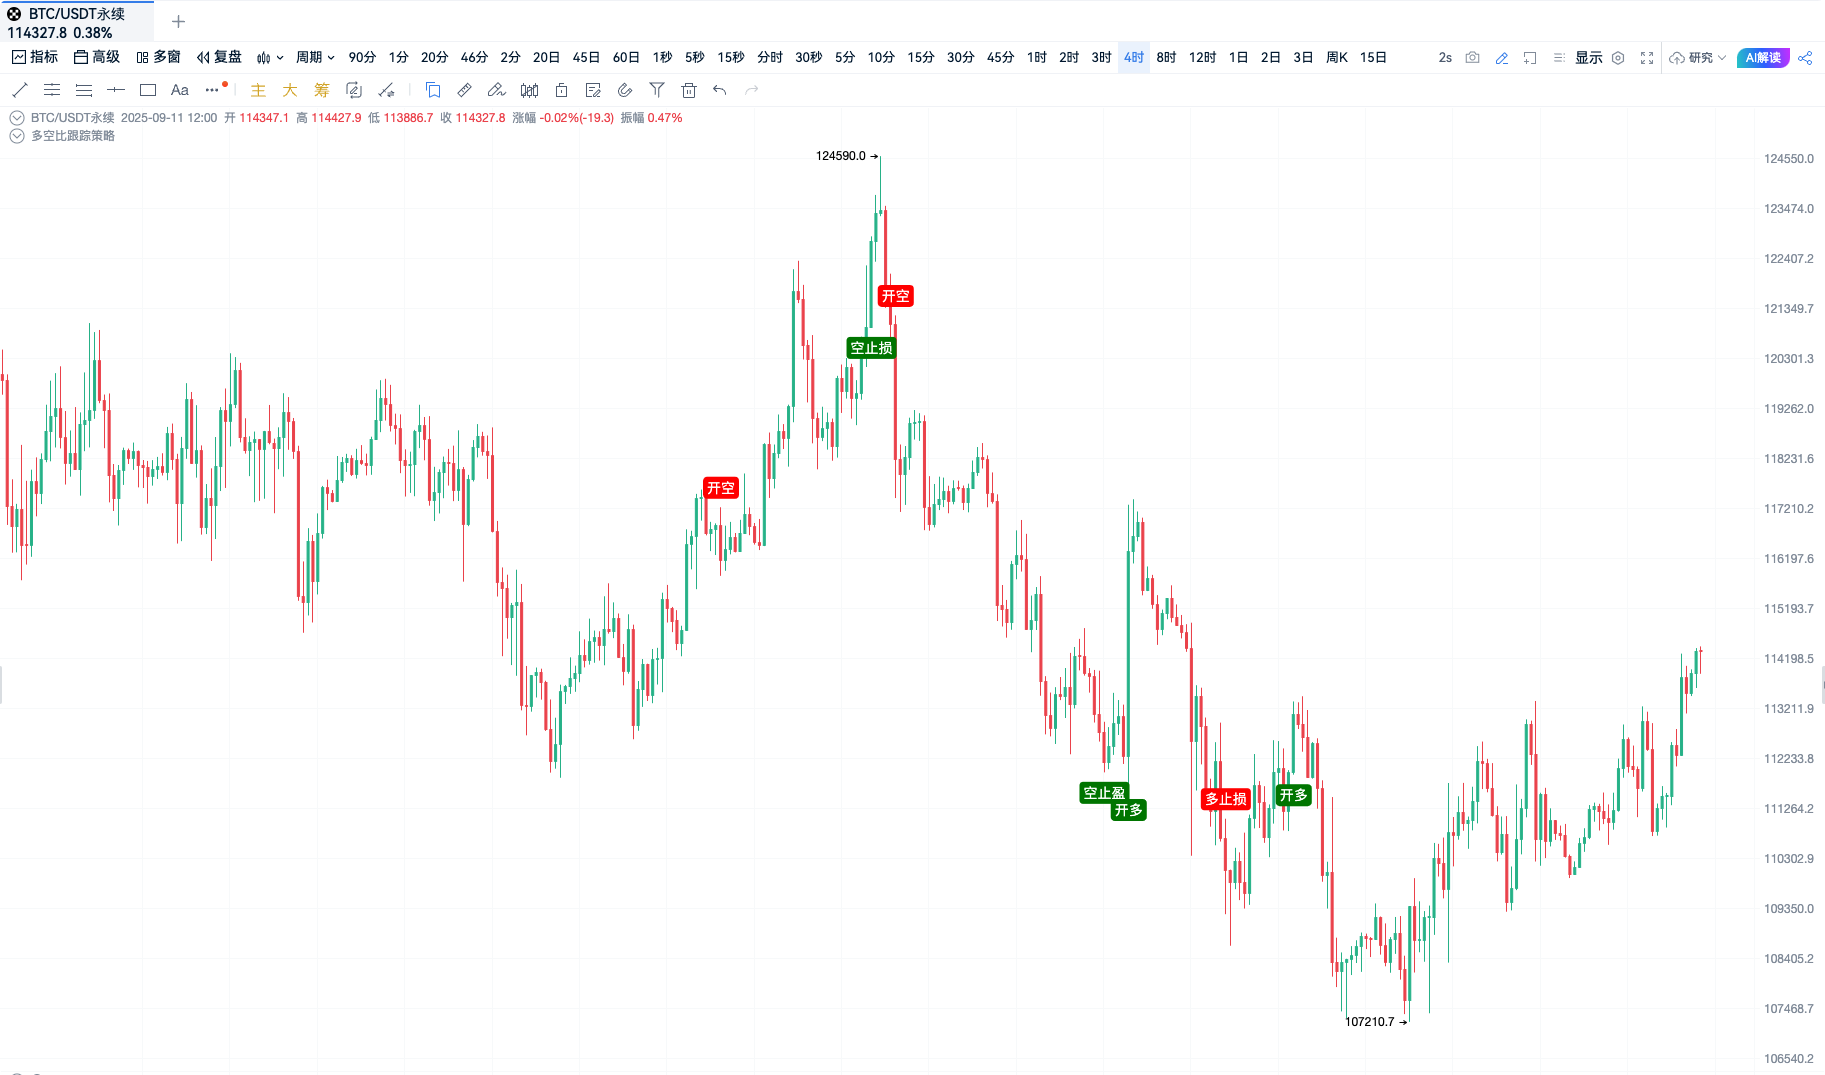
图 OKX-BTCUSDT永续合约
信号亮点:识别大趋势
四、指标源码
// @version=2
// 在这里创建您的自定义脚本
lspr = security('i:lsprbtc:okex', '5m', close)
var long_count = 0
var long_avg = 0
var long_max_profit = 0
var active_long_profit_monitor = false
var active_long_drawdown_order = false
var short_count = 0
var short_avg = 0
var short_max_profit = 0
var active_short_profit_monitor = false
var active_short_drawdown_order = false
var frozen_interval = 60 * 60
var finish_time = 0
// max_lspr = highest(lspr, 500);
// min_lspr = lowest(lspr, 500);
// lspr_ratio = (lspr - min_lspr)/(max_lspr - min_lspr)
lspr_ratio = lspr
lc = 1.6
sc = 1.08
take_profit = 0.05
stop_loss = 0.05
long = crossdown(lspr, lc) and long_count == 0 and time - finish_time > frozen_interval
short = crossup(lspr, sc) and short_count == 0 and time - finish_time > frozen_interval
long_take_profit_order = close/long_avg - 1 > take_profit and long_count == 1
long_stop_loss_order = close/long_avg - 1 < -1 * stop_loss and long_count == 1
short_take_profit_order = short_avg/close - 1 > take_profit and short_count == 1
short_stop_loss_order = short_avg/close - 1 < -1 * stop_loss and short_count == 1
exitLong(short, price='market', amount=1000)
exitShort(long, price='market', amount=1000)
enterLong(long, price='market', amount=1000)
enterShort(short, price='market', amount=1000)
alertcondition(long, title='做多', direction='buy');
alertcondition(short, title='做空', direction='sell');
plotText(long, title='long', text = '开多', refSeries = low, bgColor='green', color='white', fontSize=14, placement='bottom' ,display=true);
plotText(short, title='short', text = '开空', refSeries = high, bgColor='red', color='white', fontSize=14, placement='top' ,display=true);
exitLongPercent(long_take_profit_order or long_stop_loss_order, id = 'cond4',price='market', percent=100)
exitShortPercent(short_take_profit_order or short_stop_loss_order, id = 'cond8',price='market', percent=100)
plotText(long_take_profit_order, title='long_take_profit_order', text = '多止盈', refSeries = high, bgColor='red', color='white', fontSize=14, placement='top' ,display=true);
plotText(long_stop_loss_order, title='long_stop_loss_order', text = '多止损', refSeries = high, bgColor='red', color='white', fontSize=14, placement='top' ,display=true);
plotText(short_take_profit_order, title='short_take_profit_order', text = '空止盈', refSeries = low, bgColor='green', color='white', fontSize=14, placement='bottom' ,display=true);
plotText(short_stop_loss_order, title='short_stop_loss_order', text = '空止损', refSeries = low, bgColor='green', color='white', fontSize=14, placement='bottom' ,display=true);
long_signal = long // true or false 做多信号
short_signal = short // true or false 做空信号
active_trail = 0.03 // 上涨3%开启移动止盈
drawdown = 0.5 // 最高点回撤50%平仓
if (long_signal and long_count == 0) {
long_count := 1
long_avg := close
active_long_profit_monitor := false
}
if (short_signal and short_count == 0) {
short_count := 1
short_avg := close
active_short_profit_monitor := false
}
if (short_signal or long_stop_loss_order or long_take_profit_order or active_long_drawdown_order) {
long_count := 0
finish_time := time
}
if (long_signal or short_stop_loss_order or short_take_profit_order or active_short_drawdown_order) {
short_count := 0
finish_time := time
}
if (long_count > 0) {
profit = (close - long_avg) / long_avg
if (profit > long_max_profit) {
long_max_profit := profit
}
if (profit > active_trail and long_max_profit > active_trail) {
active_long_profit_monitor := true
}
if (active_long_profit_monitor) {
back = profit/long_max_profit
if (back < drawdown) {
active_long_drawdown_order := true
}
}
} else {
active_long_drawdown_order := false
active_long_profit_monitor := false
long_max_profit := -999999999
long_avg := 0
}
if (short_count > 0) {
profit = (short_avg/close) - 1
if (profit > short_max_profit) {
short_max_profit := profit
}
if (profit > active_trail and short_max_profit > active_trail) {
active_short_profit_monitor := true
}
if (active_short_profit_monitor) {
back = profit/short_max_profit
if (back < drawdown) {
active_short_drawdown_order := true
}
}
} else {
active_short_drawdown_order := false
active_short_profit_monitor := false
short_max_profit := -999999999
short_avg := 0
}
exitLongPercent(active_long_drawdown_order, id = '多止盈',price='market', percent=100)
exitShortPercent(active_short_drawdown_order, id = '空止盈',price='market', percent=100)
plotText(active_long_drawdown_order, title='移动止盈多单', text = '移动止盈多单', refSeries = high, bgColor='red', color='white', fontSize=14, placement='top' ,display=true);
plotText(active_short_drawdown_order, title='移动止盈空单', text = '移动止盈空单', refSeries = low, bgColor='green', color='white', fontSize=14, placement='bottom' ,display=true);
五、综合
多空比作为市场情绪与资金流向的直观反映,是识别市场趋势与潜在反转的重要参考指标。通过关注多空比的关键节点变化,结合具体市场表现,投资者可有效捕捉趋势性机会并规避潜在风险。
推荐:
1. 趋势交易: 顺势结合多空比的高低值作为参考点,配合成交量指标筛选入场机会,提高交易成功率。
2. 风险管理: 当多空比处于极端值(如 >1.6 或 <1.08)时,需密切留意市场反转信号并及时调整仓位以降低风险。
3. 动态优化: 多空比信号应与市场波动及资金流向动态匹配,通过不断优化使用策略,在复杂行情中维护高效的交易逻辑。
合理运用多空比的分析作用,不仅能够精准定位行情转折点,还能赋能交易策略,提高长期盈利能力。
加入我们的社区,一起来讨论,一起变得更强吧!
官方电报(Telegram)社群:t.me/aicoincn
AiCoin中文推特:https://x.com/AiCoinzh
群聊 - 致富群:
https://www.aicoin.com/link/chat?cid=10013
"
免责声明:本文章仅代表作者个人观点,不代表本平台的立场和观点。本文章仅供信息分享,不构成对任何人的任何投资建议。用户与作者之间的任何争议,与本平台无关。如网页中刊载的文章或图片涉及侵权,请提供相关的权利证明和身份证明发送邮件到support@aicoin.com,本平台相关工作人员将会进行核查。


