Crypto Scholar: 11.23 Ethereum (ETH) The rebound is not a reversal, recovery does not equal bottoming out, holders need to clearly see their positions and discipline at present
Repeatedly mentioned the first step of spot layout at 1650, with the second step also entering at 1550. The intermediate to long-term first target is above 3000, and it does not matter how long to hold it, in any case, it is coffin capital. The market has worn out the patience of many people, with calls for reversal after a day of rebound, and fears of a crash after a day of decline, actually being led by emotions. The daily line is still bearish, the 4-hour chart is just a repair, the two periods are not contradictory, just different levels. Before placing an order, clarify whether you are doing a short-term rebound or waiting for a trend reversal. With different periods, the stop loss and positions should be different. Contract leverage amplifies not just profits, but the costs of misjudgment. It’s better to miss a portion than to heavily bet on direction when signals are unclear; of course, excluding spot trading, contracts must prioritize risk control.
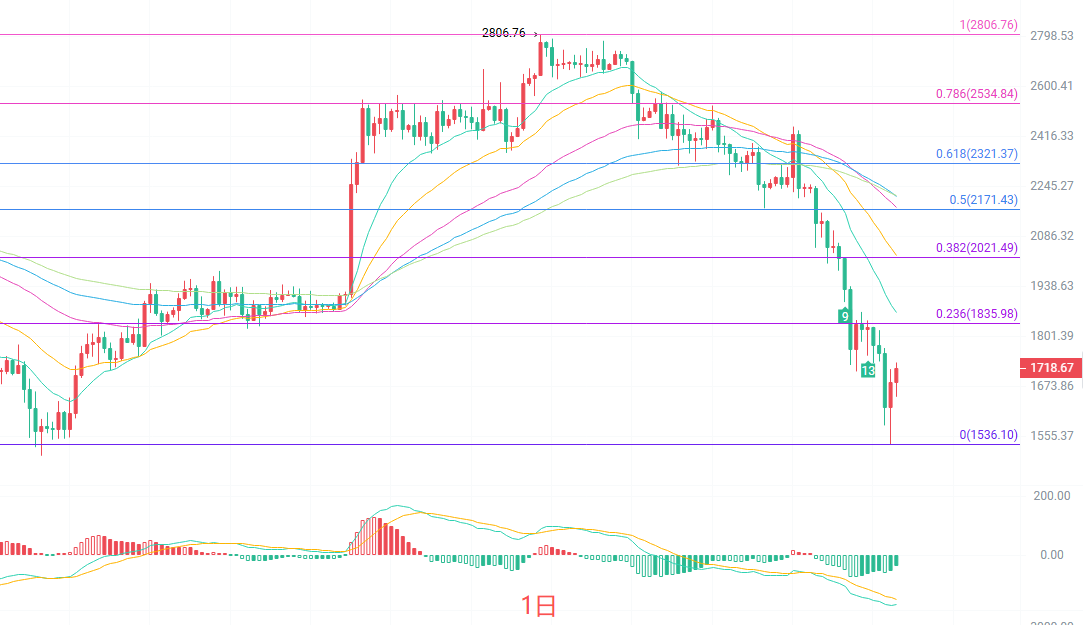
From the structural perspective of the daily candlestick, since the drop from the previous high, the current price is below all short and medium-term moving averages, which are in a bearish arrangement. The MACD operates below the zero axis, with the Bollinger Bands showing an upper band at 1976, a middle band at 2431, and a lower band at 1521, with prices close to the lower band area. Overall, the daily line is still in a weak pattern; today's bullish line leans towards a repair after an oversold condition, and a trend reversal still requires confirmation from the moving averages and indicators.
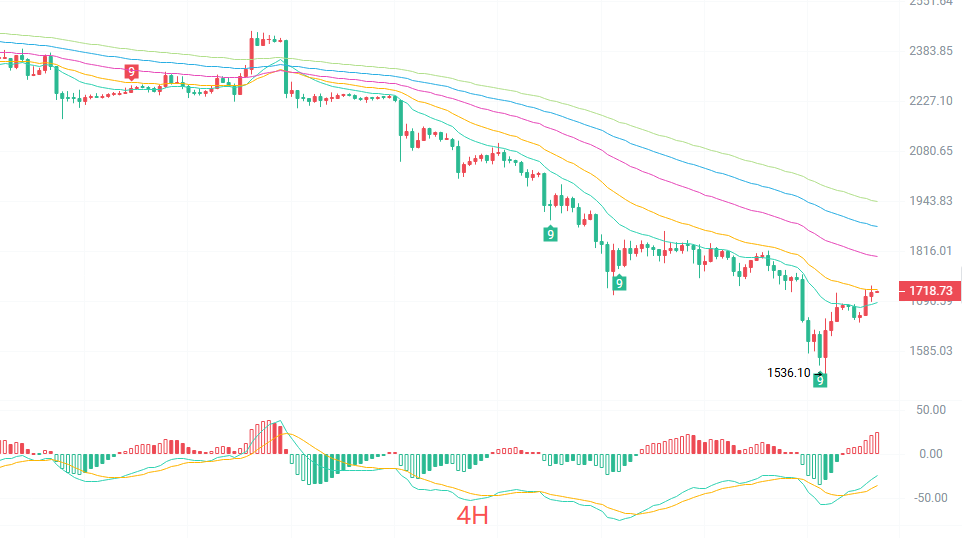
The four-hour candlestick has shown consecutive small bullish repairs after touching the low point of 1536, with the TD structure indicating a short-term signal of stopping the decline. Regarding moving averages, the EMA15 is at 1690, and the current price has re-established itself above it; however, EMA30 reports 1724, EMA60 reports 1806, EMA90 reports 1882, and EMA120 reports 1946, with upper medium and long-term moving averages continuing to press down on prices. The rebound has not changed the medium-term downward structure. The MACD has turned below the zero axis, and the bearish momentum has diminished, showing signs of a potential low-position golden cross; the Bollinger Bands show an upper band at 1819 and a lower band at 1571, with the price rising from near the lower band to just below the middle band. In summary, the 4-hour chart belongs to a short-term rebound phase after a decline, and the boundary between strength and weakness will first focus on whether EMA30 at 1724 can stabilize, with pressure concentrated at around 1725—1735.
Short-term reference:
Southern move from 1760 to 1790 stalled; stop loss at 30 points, target 1710 to 1680.
Northern move from 1690 at 1660 stopped declining; stop loss at 30 points, target 1730 to 1770.
Specific operations should be based on real-time market data. For more information, you can consult the author. There may be delays in the release of articles; suggestions are for reference only and risks are borne by individuals.
Warm reminder: The above content from the crypto scholar is simultaneously updated on major trading platforms like Binance, OKEX, Huobi, etc. For more content, you can add me as a friend on Binance OKEX and join my fan group.
免责声明:本文章仅代表作者个人观点,不代表本平台的立场和观点。本文章仅供信息分享,不构成对任何人的任何投资建议。用户与作者之间的任何争议,与本平台无关。如网页中刊载的文章或图片涉及侵权,请提供相关的权利证明和身份证明发送邮件到[email protected],本平台相关工作人员将会进行核查。