Cryptocurrency Academy: Ethereum (ETH) on November 21Short-term rebound is about to happen, but the nature of the rebound still needs this signal to be confirmed
The second has dropped below 1650, and I am laying out a long-term target of 2500-3000 with cash in hand. For spot trading, one must have idle funds. The two types of people who easily lose money in contracts are: one is the one who keeps holding long positions and adds more as the price falls, resulting in greater losses; the other sees a drop and chases shorts, just to buy at the starting point of an oversold rebound and get stopped out by a bullish candlestick. Now at the 1630 position, there are support levels at 1622, 1590, and 1503 below. Above is a series of pressure from moving averages; before the direction is established, having a light position, using stop-loss orders, and trading less is better than anything else
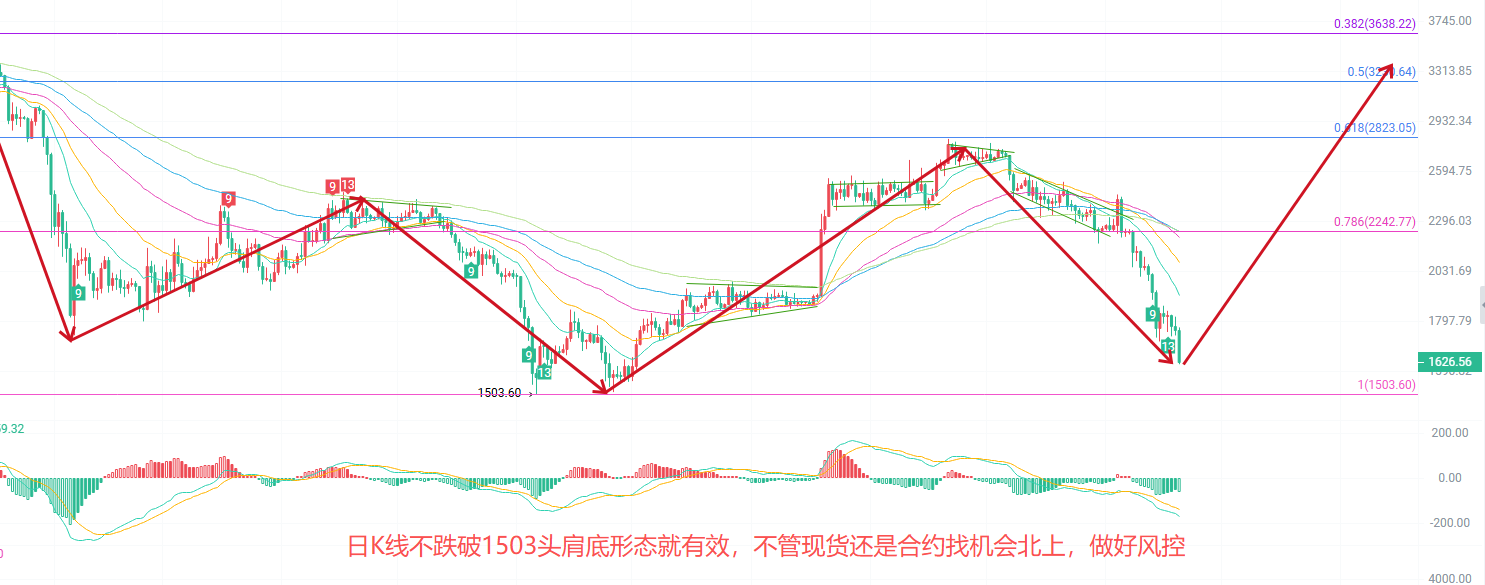
Daily K-Line hit a low of 1622, characterized by a large bearish candlestick showing high volume. From the perspective of moving average structure, the price has clearly dropped below all short, medium, and long-term EMA moving averages, forming a typical bearish arrangement, and the daily trend is still downward for now. In terms of MACD, both lines are below the zero axis and spreading down, indicating that bearish momentum is still being released, and there is no clear turning signal yet. The middle band of the Bollinger Bands is 2033, the upper band is 2475, and the lower band is 1590. The price is already close to the lower band, indicating short-term oversold conditions, but oversold does not mean a bottom is reached. First, watch if the 1622 level can hold, and if it breaks below, the next targets are the Bollinger lower band at 1590 and the previous low at 1503
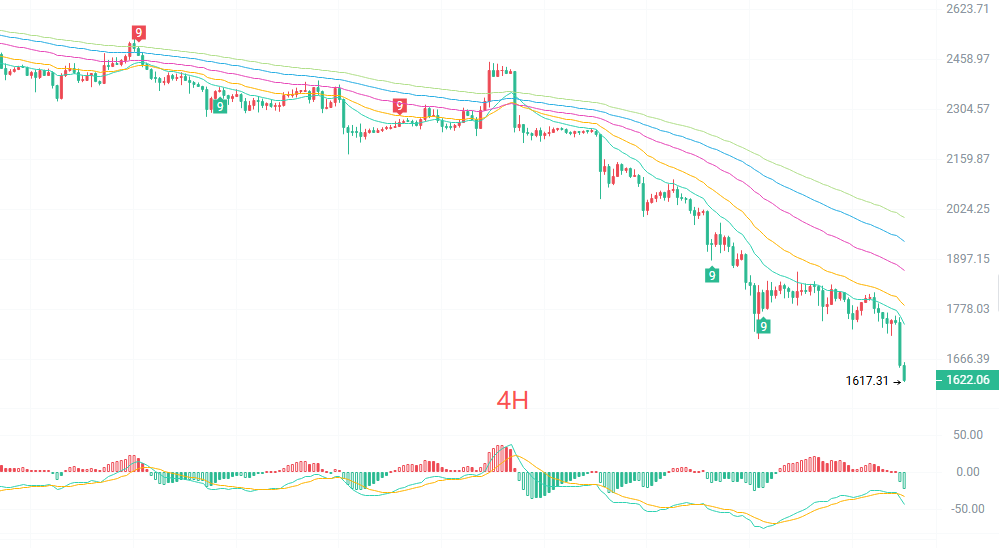
The four-hour K-line likewise has a low at 1622. The price is operating below all moving averages, with a weak pattern where the moving averages are diverging downward. The MACD lines are below the zero axis, and the green bars have narrowed compared to earlier down phases, indicating that the selling pressure is weakening, but a golden cross has not yet formed, so it can only be seen as a breather in the downtrend, not a reversal. The middle band of the Bollinger Bands is at 1768, the upper band at 1863, and the lower band at 1672. The current price has fallen below the lower band, deviating from its path, and there is a possibility of a pullback to confirm pressure at the lower or middle band. The TD indicator shows a count of 7, indicating that it has entered the oversold count, and a rebound may occur at any time, but the nature of the rebound is more about recovery and should not be viewed as a trend reversal
Short-term reference:
Move south from 1675 to 1750 with stagnation, stop loss of 30 points, target 1620 to 1590
Move north from 1620 to 1590 to stop the drop, stop loss of 30 points, target 1700 to 1750
Specific operations depend on real-time data from the market; for more information, please consult me. There may be delays in article publication; it is recommended for reference only, and risks are borne by the reader
Warm reminder: The above content from the Cryptocurrency Academy is updated simultaneously on major trading platforms like Binance, OKX, Huobi, etc. For more content, you can add me as a friend in Binance OKX to join my fan group
免责声明:本文章仅代表作者个人观点,不代表本平台的立场和观点。本文章仅供信息分享,不构成对任何人的任何投资建议。用户与作者之间的任何争议,与本平台无关。如网页中刊载的文章或图片涉及侵权,请提供相关的权利证明和身份证明发送邮件到[email protected],本平台相关工作人员将会进行核查。