Cryptocurrency Scholar: 11.21 Bitcoin (BTC)How to view the oversold signal in the downtrend? Key points for identifying the divergence of the lower Bollinger band and stabilization K-line
A low price has never been a reason to buy; a stop-loss signal is what counts; just because the price has fallen a lot doesn’t mean it will rebound immediately. When weakness grinds, patience is worth more than boldness. In this round, both those who are trapped and those who missed out, along with those repeatedly swept for losses, all have one common issue: not having a plan for what to do if they are wrong before entering the market. Understand the trend, guard your position, tighten stop-losses, and leave the rest to probability. The big pie has reached the 50,000s; there’s no need to hesitate in opening cash positions with your eyes closed, and for those prefering mid-line contract strategies, keep strong liquidations at a level where you can sleep well. For those who enjoy intraday shorting, take a look at the content.
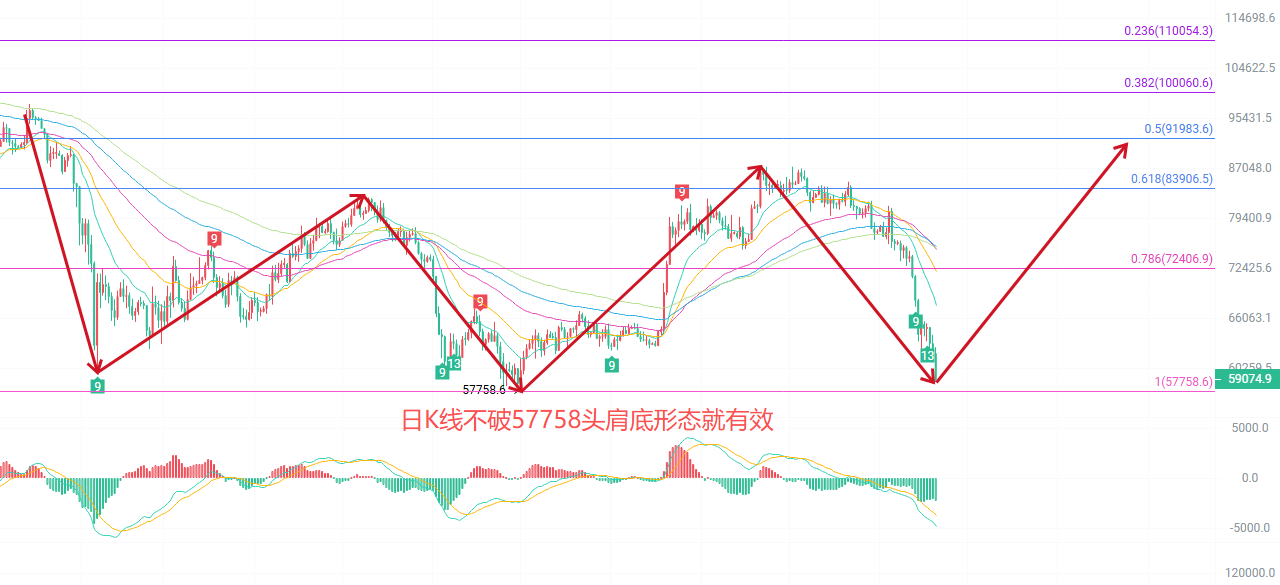
The daily K-line shows a large bearish candlestick. The price has fallen below all the EMA moving averages, and the short to medium-term moving averages are in a bearish arrangement, with pressure everywhere on rebounds. In terms of MACD, the green bars continue to enlarge, indicating that the downward momentum has not been fully released. The middle Bollinger band is at 71,087, the upper band at 83,620, and the lower band at 58,554; the price is running closely along the lower band, showing signs of being oversold in the short term, but the lower band has not flattened yet, and the trend remains weak. The overall daily pattern is a weak consolidation in a correction trend; it is not advisable to blindly try to bottom out before clear stop-loss signals appear.
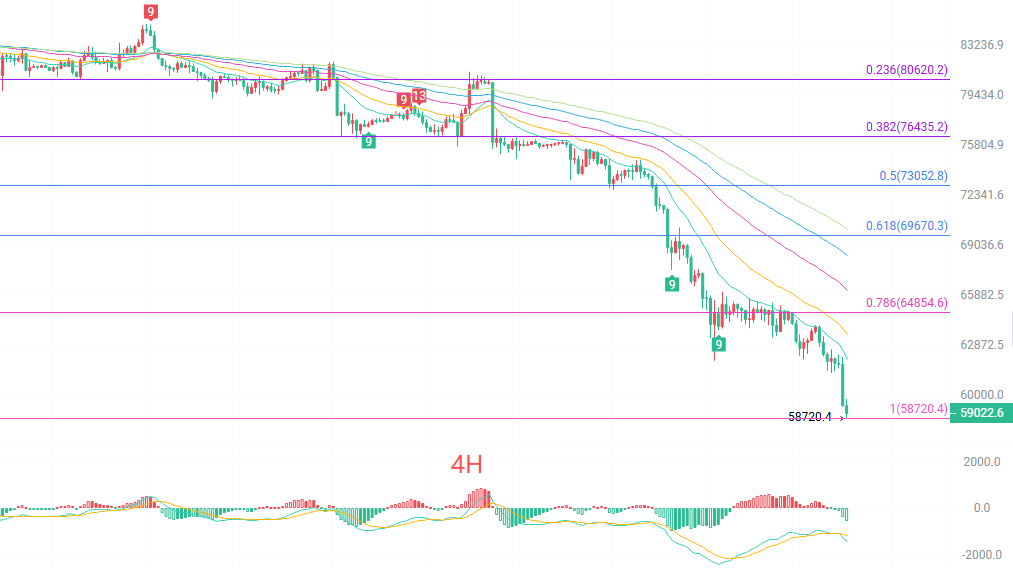
On the four-hour K-line moving average system, the price continues to decline below EMA15. The moving averages of each period are arranged in a typical bearish structure from top to bottom. MACD is still running below the zero axis, with limited rebound strength. The middle Bollinger band is at 62,884, the upper band at 65,894, and the lower band at 59,874; the price has broken below the lower band, and the channel opening is pointing downwards. In the short term, there is a sideways movement above the low point of 58,720, which is a weak breather after the decline; whether it can stabilize depends on whether this low point can be held.
Short-term reference:
Going south from 60,500 to 61,000 is stagnant, with a stop-loss of 500 points and a target of 59,000 to 57,500.
Going north from 58,000 to 58,500 is where the price stops falling, with a stop-loss of 500 points and a target of 59,500 to 60,500.
Specific operations should be based on real-time market data. For more details, you can consult the author; article publication may be delayed, and it is advised to reference at your own risk.
Friendly reminder: The above content is synchronized and updated by the Cryptocurrency Scholar across major trading platforms like Binance, Okex, Huobi, etc. For more content, you can add me as a friend in Binance and join my fan group.
免责声明:本文章仅代表作者个人观点,不代表本平台的立场和观点。本文章仅供信息分享,不构成对任何人的任何投资建议。用户与作者之间的任何争议,与本平台无关。如网页中刊载的文章或图片涉及侵权,请提供相关的权利证明和身份证明发送邮件到[email protected],本平台相关工作人员将会进行核查。