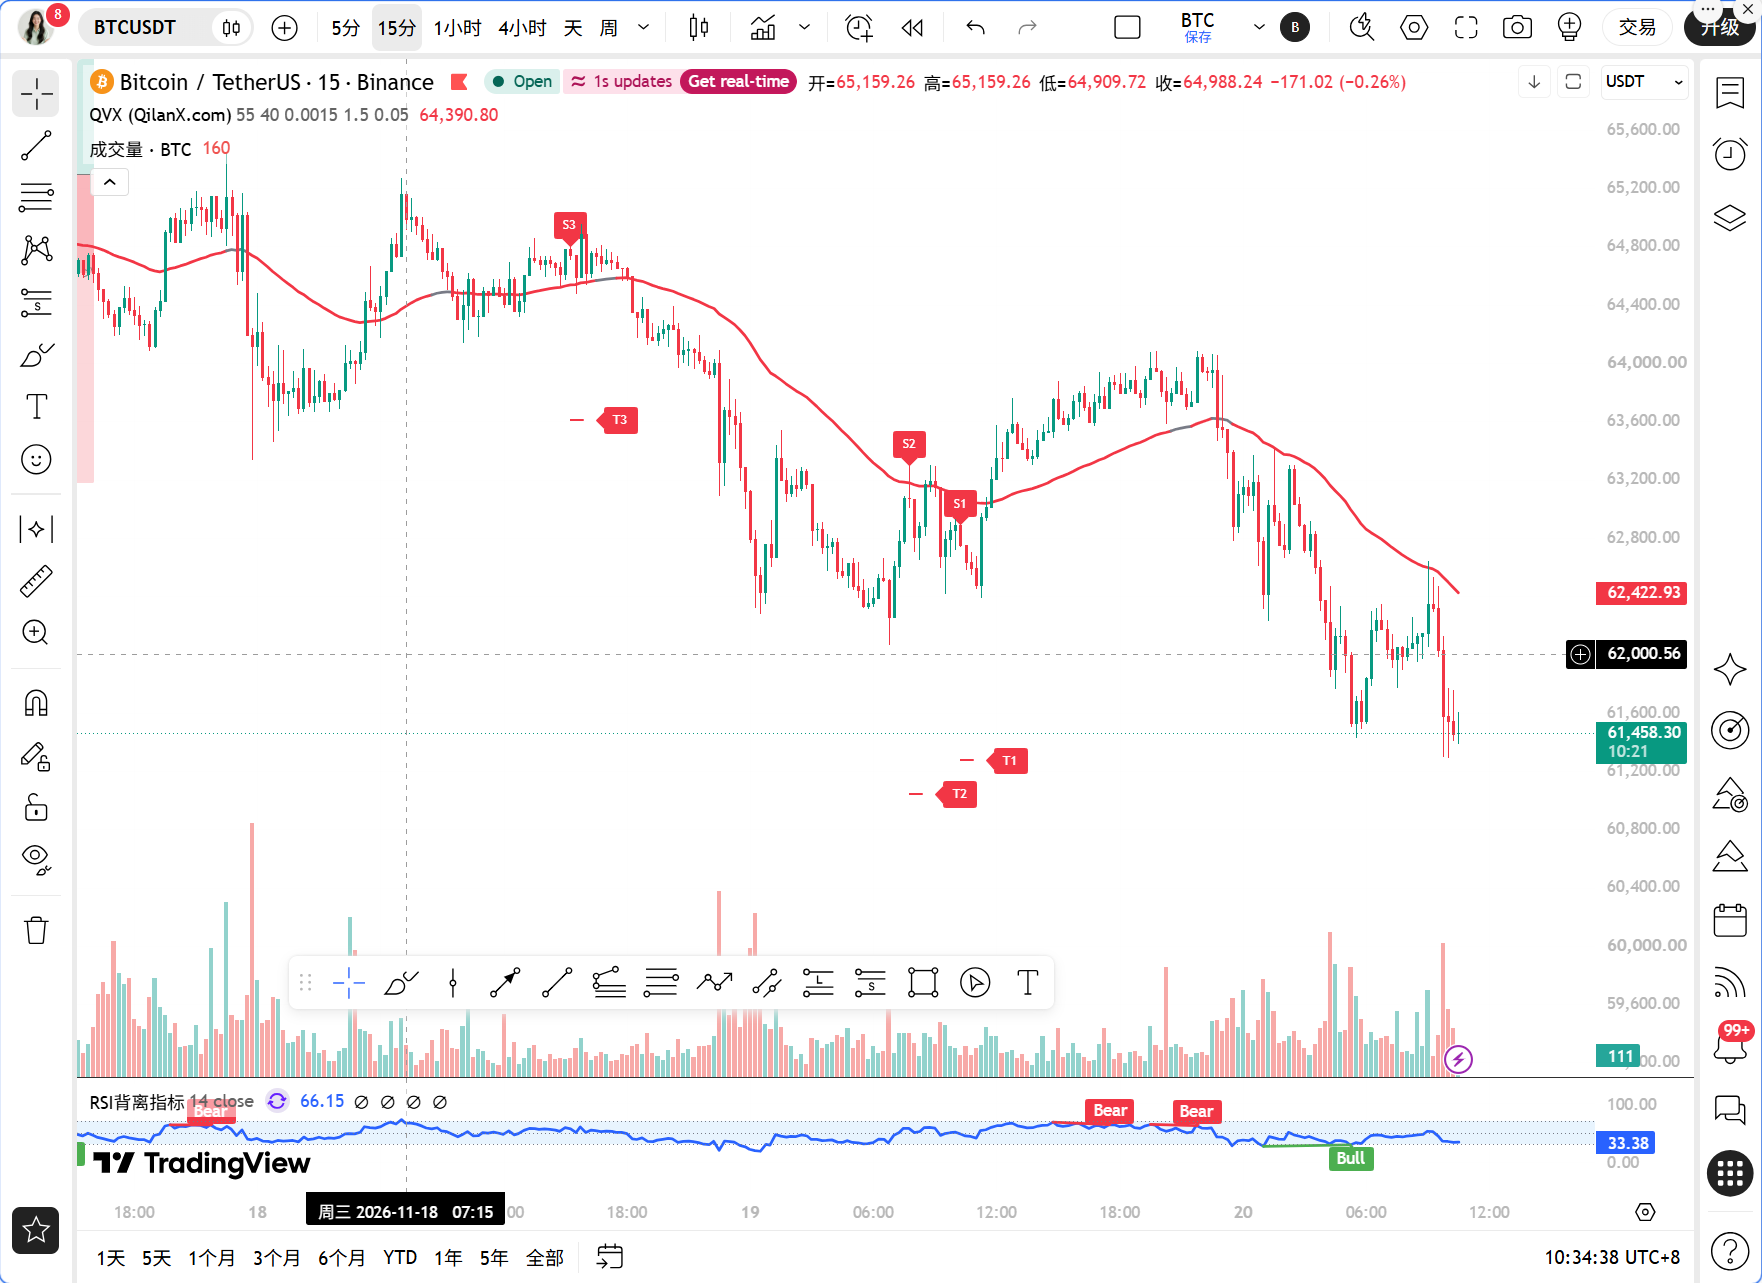
Today, there are two important pieces of news to mention first. The first is that the Federal Reserve's October minutes show that most officials support continuing interest rate hikes, with JPMorgan predicting three rate increases to 4.75% between 2026 and 2027. This is not an ordinary hawkish signal; it is pushing down the valuation ceiling of risk assets. The second piece of news is that after Bitcoin fell below $62,500, over $38.12 million was liquidated in one hour, indicating that long positions are being liquidated. Additionally, with Anthropic's IPO surging 34% on its first day and a market value exceeding $1.47 trillion, massive funds are being pulled from traditional markets, draining liquidity from the cryptocurrency market. The total market value of stablecoins has shrunk to $288.1 billion, which is a decrease of $23.25 billion from this year’s high, showing that funds are definitely exiting. Sister Qinglan has repeatedly stated in her Qinglan Cryptocurrency Class: News drives sentiment; sentiment drives short-term prices; but structure determines whether you can survive to see a reversal.
Current Price and Time
It is now November 20, 10:33 AM. The BTC price is 61,434 USDT, with a 24-hour decline of 1.93% and a BTC market share of 57.92%. The Fear and Greed Index is at 12, indicating extreme fear. This number is interesting; extreme fear often appears during retracements or at bottom areas, but it is not a buying signal on its own; it simply tells you that market sentiment has stretched to the limit. What truly matters is whether the price structure provides evidence of stabilization.
Multi-Cycle Overview
First, let's look at the daily chart. MA5=63,263.83, MA10=65,960.94, MA30=74,118.23; the moving averages are in a very standard bearish arrangement, with price below all moving averages. The MACD's DIF=-4,611.64, DEA=-3,674.66, and the histogram value is -936.99; bearish momentum is still expanding. However, the daily RSI=10.97 has entered the extreme oversold area, and historically, when the daily RSI drops to around 10, it usually means the short-term downside potential is significantly compressed, but take note, oversold conditions can stagnate, and prices can continue to trade lower while RSI stays low.
Now, looking at the 4-hour chart. MA5=62,568.72, MA10=62,872.48, MA30=64,109.74; similarly, it is in a bearish arrangement. The MACD on the 4-hour level shows a dead cross state, with DIF=-1,100.34, DEA=-1,052.38, the histogram value at -47.96; bearish momentum shows no obvious convergence. The 4-hour RSI=35.43 is a bit healthier than the daily, but it cannot be considered strong.
The 1-hour level is the core observation window of the Qinglan TPV system. MA5=61,864.67, MA10=62,100.06, MA30=62,921.49; the price is below the moving averages. The 1-hour EMA55=63,274.33, current price is 61,434 USDT, making the absolute distance to EMA55 2.91%. The 1-hour MACD's DIF=-497.90, DEA=-360.33, histogram value of -137.57; bearish momentum persists. The 1-hour RSI=23.59, nearing oversold but not extreme yet.
On the 15-minute level, MA5=61,607.61, MA10=61,905.78, MA30=62,016.17; the price runs below the moving averages. The 15-minute MACD's DIF=-224.08, DEA=-186.33, histogram value -37.75; bearish momentum exists but the histogram value is not significant. The 15-minute RSI=29.59 has already entered the oversold zone.
TPV Signal Verification
According to the rules of the Qinglan TPV system, we first determine the trend. The current price is 61,434 USDT, and with the 1-hour EMA55=63,274.33, the price is clearly below EMA55, which belongs to the bearish trend area. There is no dispute about this.
Short-selling condition verification: First, the price is pressured under the 1-hour EMA55, and over the past 8 one-hour candles, the number of close prices above EMA55 is 0/8, with 0 crossovers; the condition of continuous close prices below EMA55 is fully met. Second, we see a pressure obstruction pattern; the current price is 2.91% away from EMA55, indicative of a state far from the moving average. There is no immediate formation of valid highs followed by pullbacks, but the overall structure is under pressure. Third, the inability to rebound; the 1-hour MACD histogram value of -137.57 is still expanding, showing no signs of contraction over two consecutive cycles; the RSI=23.59 is moving from a low area, not retreating from above 70. So strictly speaking, the first condition of short-selling criteria is met; the second and third are partially met but not complete enough. The system gives a positional signal for the bearish trend area but does not provide a fresh entry short signal.
In terms of oscillation judgment, the past 8 one-hour candles have recorded 0/8 close prices above EMA55, with 0 crossovers; the price distance to EMA55 is 2.91%, which far exceeds the 0.3% threshold, clearly not meeting the oscillation conditions, and the system determines it as a unidirectional trend, currently a unidirectional bearish trend.
Here, Sister Qinglan wants to specifically remind: The TPV system does not easily give reversal signals in a unidirectional trend. Although the daily RSI=10.97 is extreme, there is no evidence of stabilization in the 1-hour and 4-hour charts through bottom formations, long lower shadows on expanding volume, or consistently contracting MACD histograms. In other words, oversold does not equal reversal; the system currently does not provide a long signal.
On-Chain/Fundamentals
The Fear and Greed Index is at 12, indicating extreme fear. The total market value of stablecoins is at $288.1 billion, which has shrunk by $23.25 billion from this year’s high, indicating funds are exiting. BTC high-cost liquidations are continuing, putting downward pressure on the accumulation zone. The Binance hot wallet attacker transferred 108,000 ETH worth $195 million; although this is an ETH event, the cross-market selling concerns will affect BTC. Four major whales withdrew 13,408 ETH worth $23.73 million from three platforms, which is more of a hoarding behavior, but the volume is insufficient to offset the overall outflow of funds. The Hong Kong Securities and Futures Commission warned that Hyperliquid has been added to the list of suspicious trading platforms, putting pressure on the sentiment in the DeFi perpetual segment. The Sky stablecoin PSM is involved in $518 million of illegal transactions, and $2.7 billion in USDC reserves face freezing risks; compliance risks for stablecoins are rising. Overall, the funding situation is bearish, sentiment is extremely fearful, but extreme fear itself does not constitute a buying rationale.
Key Support and Resistance Levels
The first resistance level above is the 1-hour EMA55=63,274.33; this is the dividing line for the TPV system between bullish and bearish. If the price cannot hold above it, the bearish structure remains intact. The second resistance level is formed by the 1-hour MA30=62,921.49 and 4-hour MA5=62,568.72, roughly in the $62,500 to $62,900 USDT range. The first support level below is near $61,400 USDT, which is the current price range and a position for short-term bullish and bearish contest. The second support level looks at the integer level of $61,000 USDT; if it breaks, the next level looks at $60,500 USDT. The previous low area at the daily level needs to be closely monitored, as with the daily RSI=10.97; any instance of significant selling could potentially be the last drop, but it could also mark the beginning of an accelerated decline. The distinction lies in whether there are signs of significant selling stalling.
Trading Approach
Direction: The current TPV system indicates a bearish trend area, with the main direction leaning bearish but no aggressive shorting.
Entry Conditions: For short trades, wait for the price to rebound to the $62,500 to $62,900 USDT resistance zone, look for long upper shadows or topping formations, while simultaneously watching for the 1-hour MACD histogram to contract for two consecutive cycles or for RSI to fall back from high positions, and only consider lightly shorting when all three conditions are met. For long trades, one must wait for two consecutive one-hour candles to close above EMA55=63,274.33 while also seeing a bottom formation or long lower shadow with expanding volume, along with the 1-hour MACD histogram contracting for two consecutive cycles, and only consider going long when all three conditions are met. Currently, neither direction meets the complete conditions, so the strategy is to observe and wait, without taking any active positions.
Stop Loss: If shorting, the stop loss should be placed above 63,274.33 USDT, specifically above the 1-hour EMA55, as breaching EMA55 signifies the breakdown of the bearish structure. If going long, the stop loss is set below $61,000 USDT; if it breaks below the integer level, it indicates a failure to stabilize.
Target Levels: The first target for shorting looks at $61,000 USDT, the second target looks at $60,500 USDT. The first target for going long is at $62,568.72 USDT, the second target looks at $63,274.33 USDT.
Sister Qinglan has consistently emphasized in her Qinglan Cryptocurrency Class that the value of the TPV system lies not in prediction but in filtering out emotional trading through rules. Today, with a daily RSI=10.97, many people may feel compelled to catch a falling knife, but the system tells you that the 1-hour price is still 2.91% away from EMA55, the bearish structure is intact, and there are no stabilization signals. Be patient, wait for signals, wait for structure, and wait for the TPV system to provide clear entry conditions.
Risk Warning
Extreme fear combined with extreme oversold daily RSI; any instance of significant selling could potentially lead to a reversal. Strictly implement stop losses and do not hold onto losing positions.
Follow Qinglan Cryptocurrency Class to grasp more trading opportunities! Welcome to visit the official website www.qinglan.org
📊 Qinglan TPV Trading Strategy Backtest Reference
🕒 Last Backtest Time 11-20 07:00:01
Total Analysis: 5,290 Backtest: 5,139 Accuracy Rate: 75.9% (3,899/5,139)
免责声明:本文章仅代表作者个人观点,不代表本平台的立场和观点。本文章仅供信息分享,不构成对任何人的任何投资建议。用户与作者之间的任何争议,与本平台无关。如网页中刊载的文章或图片涉及侵权,请提供相关的权利证明和身份证明发送邮件到[email protected],本平台相关工作人员将会进行核查。