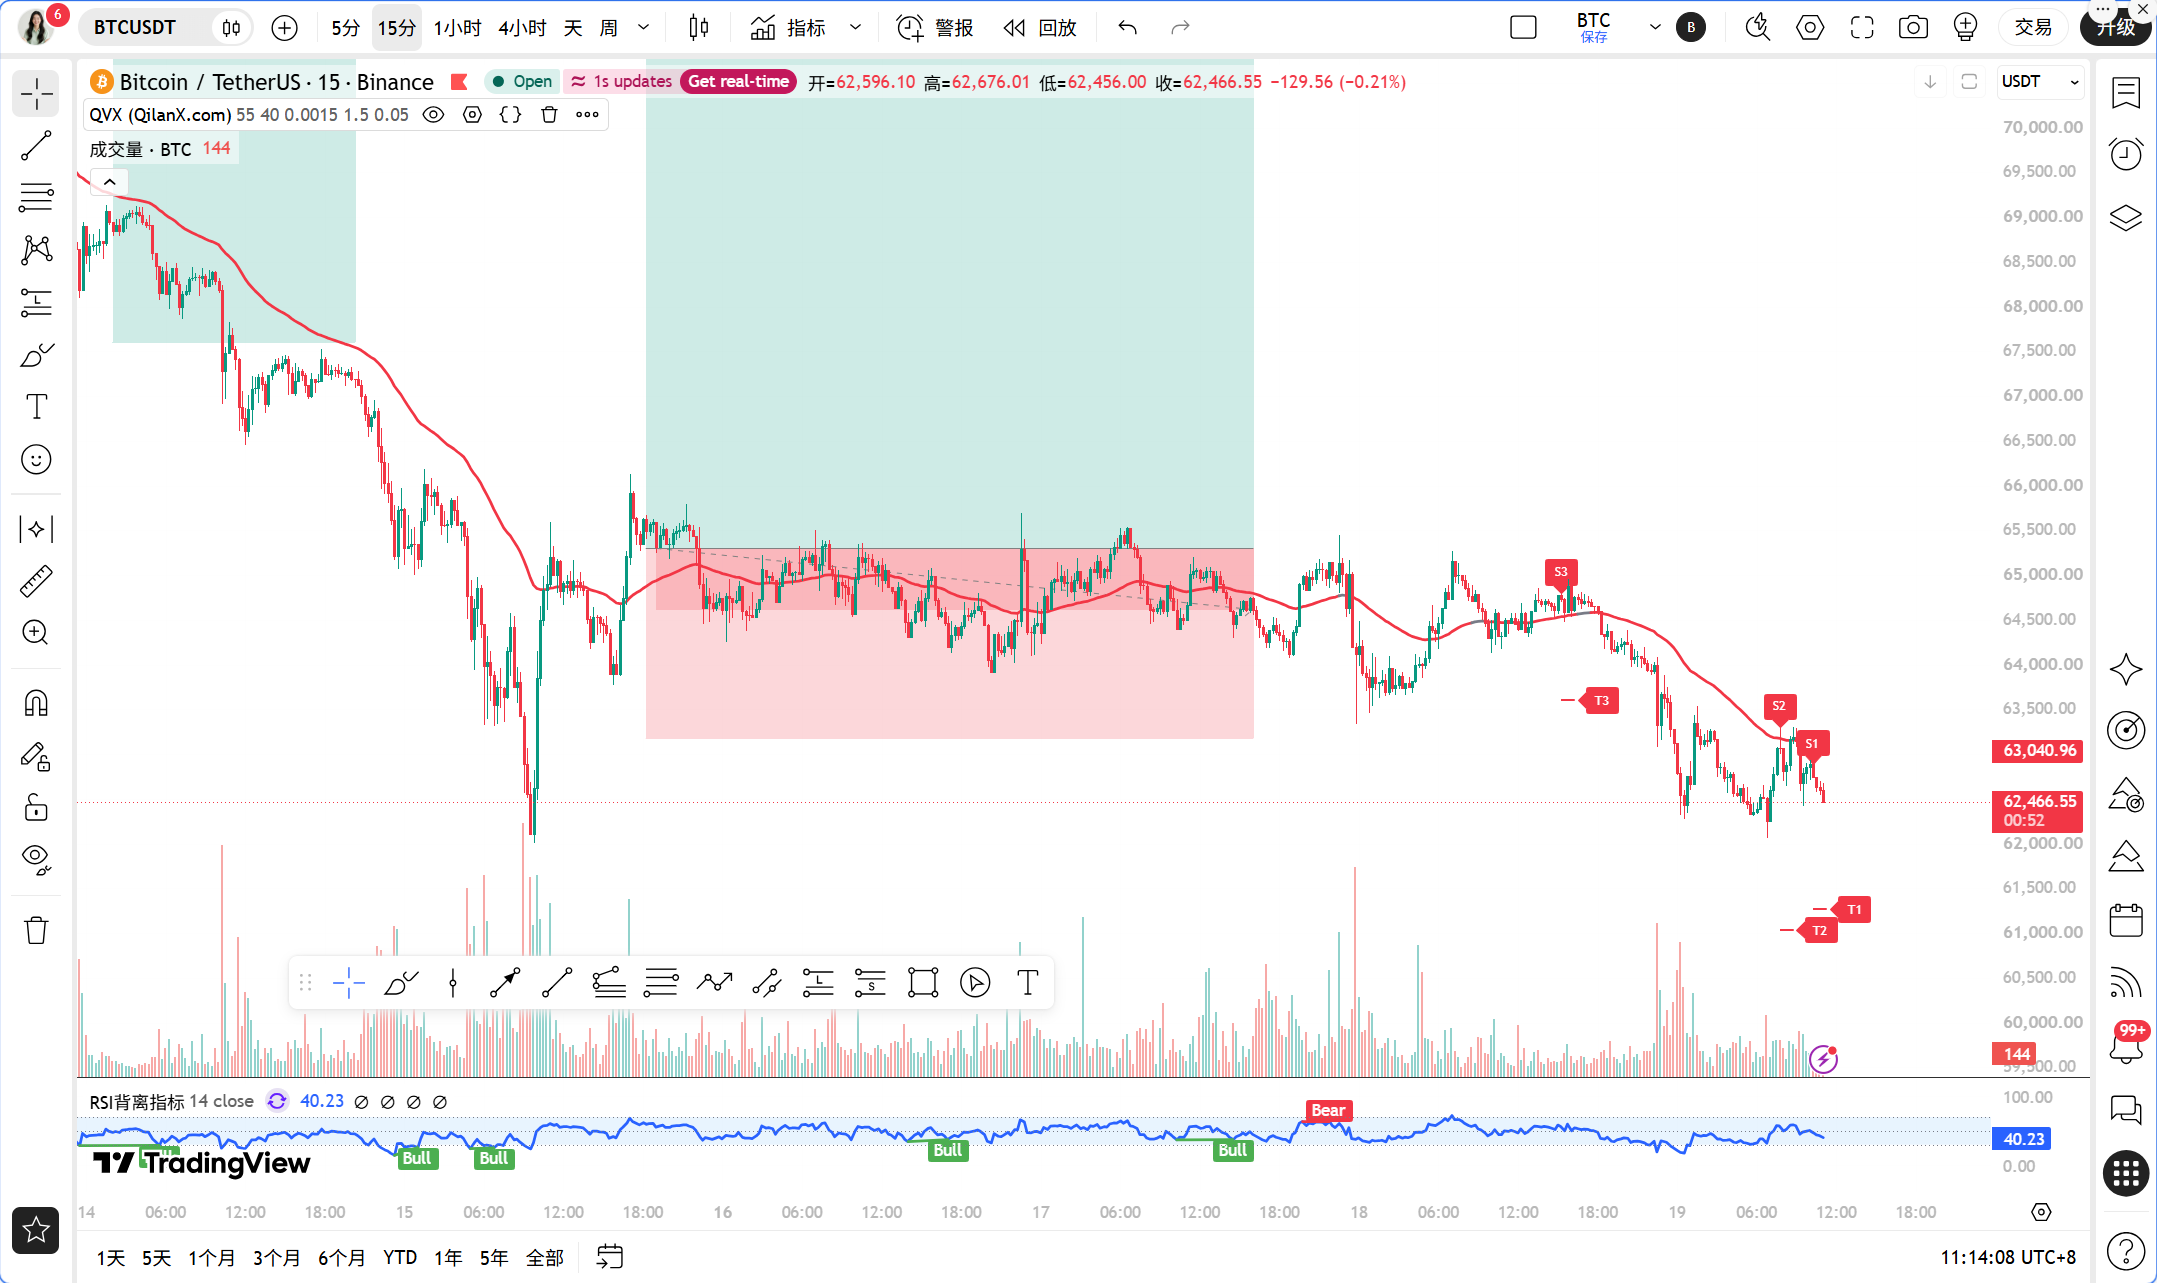
This morning, two pieces of news directly dropped market sentiment to freezing point. The first was a public warning from Federal Reserve Governor Waller about worsening inflation, clearly stating that a rate hike of 50 basis points might be necessary in December. This hawkish statement immediately caused U.S. stock futures to relinquish gains, and both gold and cryptocurrencies fell simultaneously, while the dollar index reached a new high since April 2025. The second piece of news reported that Bitcoin fell below the $62,500 mark, with over $38.12 million liquidated within an hour. Aguila Trades had to stop losses on nearly $100 million in BTC long positions, incurring a loss of $478,000. The signal from large whales cutting losses and exiting the market is very clear. Moreover, the Strategy perpetual preferred stock STRC has once again uncoupled and the increase in holdings has slowed, indicating that marginal buying support is being weakened. Sister Qinglan has repeatedly emphasized in the Qinglan Crypto Class that a combination of macro liquidity tightening and leverage liquidation often does not end with just one spike; it must be verified with systematic rules rather than relying on feelings to catch the bottom.
Current Price and Time
The current time is November 19 at 10:55, with the latest BTC quote at 62,678 USDT, showing a 24-hour fluctuation of -2.86% and a BTC market share of 57.99%. The Fear and Greed Index is at 10, indicating extreme fear. This position is quite delicate; the price has dropped below the previous short-term psychological level of $62,500, and long leverage has been cleared, but there is no sign that panic has completely been released.
Multi-Cycle Status Overview
Daily Level: MA5=64185.51, MA10=67266.28, MA30=74896.59, with the moving averages showing a standard bearish arrangement, and the price is far below all short-term moving averages. MACD values are DIF=-4387.42, DEA=-3429.71, and bars=-957.71, with bearish momentum still expanding. However, the daily RSI is only 11.60, which is a very rare oversold reading, indicating that the mid-term decline has entered an extreme zone. The rebound is like a tightly compressed spring, but being tightly compressed does not mean it will spring back immediately; the inertia of the trend remains.
4-Hour Level: MA5=63169.51, MA10=63800.57, MA30=64702.25, with the price also operating below the moving averages. Notably, the MACD bars=29.37 have turned positive, with DIF=-1136.49 above DEA=-1165.86, indicating signs of momentum recovery at the bottom in the 4-hour level, while RSI=33.24 is slowly rebounding from a low level. This is the only slightly warming signal in the current market, suggesting that the downward momentum at the 4-hour level is exhausting, but it is still not enough to confirm a reversal.
1-Hour Level: MA5=62808.60, MA10=62804.86, MA30=63803.10, EMA55=63927.62. The current price of 62,678 is clearly under pressure below EMA55, with an absolute margin of 1.95% from EMA55. MACD values are DIF=-440.07, DEA=-422.81, and bars=-17.26, with bearish momentum still present but not exaggerated. RSI=32.77 is close to oversold but not extreme. The 1-hour structure is in a standard bearish trend area.
15-Minute Level: MA5=62760.02, MA10=62876.63, MA30=62708.91, with short-term moving averages starting to entangle, and the price fluctuating around MA30. MACD shows a death cross, with DIF=-32.59, DEA=-25.75, and bars=-6.84, while RSI=47.41 has returned to neutral. The 15-minute chart shows low-level oscillation and recovery after a decline, with signs of short-term stabilizing but limited strength.
TPV Signal Verification
First, look at the trend positioning. The current price of 62,678 is below the 1-hour EMA55 of 63,927.62, clearly indicating a bearish trend area, which is the first layer of filtering in the TPV system with no dispute on the direction being bearish.
Next, check if the three conditions for short selling are simultaneously met. Condition one: the price is under pressure below the 1-hour EMA55 and must have two consecutive 1-hour candlesticks closing lower than EMA55. From the oscillation auxiliary data, in the last 8 1-hour candlesticks, the number of closes above EMA55 is 0/8, with no crossings, so this condition is completely met and very solid. Condition two: resistance formation is encountered, and the current price has repeatedly tested the range between 62,800 and 63,000 without being able to stand above, categorizing it as a pressure state after hitting an effective high point and retreating. Condition three: weak rebounds; with the 1-hour MACD bars=-17.26 still negative, the RSI=32.77 has not rebounded above 50, indicating insufficient rebound momentum. All three conditions are basically met, confirming the effectiveness of the bearish structure.
However, Sister Qinglan wants to remind about a key detail: The oscillation auxiliary data shows that the current price is 1.95% away from EMA55, far exceeding the 0.3% oscillation threshold, and with zero crossings in 8 candlesticks, it indicates that this is not an oscillating market, but a unidirectional bearish trend. In a unidirectional trend, the success rate for going short is higher than that for catching a bottom against the trend, which is the core logic of the TPV system.
At the same time, it is necessary to observe the counter signals: the 4-hour MACD bars have turned positive and the daily RSI=11.60 shows extreme overselling, suggesting that the slope of the decline could slow down. It's necessary to wait for a rebound to resistance levels before taking action on shorting, rather than chasing directly at low levels.
On-chain/Fundamentals
The Fear and Greed Index is at 10, indicating extreme fear. Historically, this reading often corresponds to phase bottom areas, but a bottom is a range, not a point, and extreme fear can last for several days or even weeks. BTC's market share of 57.99% is at a relatively high level, indicating that capital is concentrating to seek refuge in BTC, with altcoins under heavier pressure. A 24-hour drop of 2.86% alongside a $38.12 million liquidation within an hour indicates that leverage cleansing is ongoing. Whale Aguila Trades had to stop losses on nearly $100 million in long positions, incurring a loss of $478,000, which serves as direct evidence of insufficient bullish confidence. The Strategy preferred stock STRC has uncoupled by about 4%, and the increase in holdings has slowed, indicating that the marginal buying from the largest institutional buyers is weakening. Arbitrage capital is flowing from cryptocurrency basis to U.S. stocks with an 11% annualized yield, showing liquidity being withdrawn. Overall, the capital factor leans bearish, but the extreme fear itself is a contrarian indicator that requires confirmation from technicals before acting.
Key Attack and Defense Levels
The first resistance above is in the range of 62,800 to 63,000, which is the first hurdle formed by the 1-hour MA5 and MA10 cluster and the initial rebound. The second resistance is in the range of 63,800 to 63,930, which is the resonance area of the 1-hour MA30 and EMA55; this is the dividing line for long and short in the TPV system. Until the price stands above here, any rebound can only be defined as a repair. The first support below is at the round number of 62,000, with the second support in the range of 61,500 to 61,800. If the 62,000 level is broken, panic selling may accelerate.
Trading Thoughts
Direction: Bearish trend area, main idea is to short on rebounds, do not attempt to catch the bottom actively.
Entry Conditions: Wait for the price to rebound to the range of 63,600 to 63,900, that is close to the 1-hour EMA55 but unable to stand effectively, observing whether the 1-hour candlestick shows long upper shadows or bearish engulfing patterns. Simultaneously, MACD bars have not turned positive, and RSI is retreating below 50. When all three resonate, enter to short. If the price directly drops below 62,000 and confirms its closing on the 1-hour, one may follow up lightly after a pullback to 62,200 to 62,400, but reduce the position size by half.
Stop Loss: Set the short position stop loss above 64,300, which is about 0.6% above the 1-hour EMA55, allowing enough room for a false breakout; breaking below the stop loss means the bearish structure is broken, and one must exit.
Target Levels: First target 62,200, second target 61,500, third target 60,800. After reaching the first target, reduce the position by half and move the stop loss to the break-even price to let profits run.
If a reverse situation occurs, that is, if the price consistently closes above 63,930 for 2 consecutive 1-hour candlesticks and with volume, then the bearish perspective is invalidated, and one should stay on the sidelines, waiting for a pullback confirmation before considering going long. At that time, the Qinglan Crypto Class will promptly update the signals.
Risk Warning
The extreme oversold daily RSI of only 11.60 may trigger a violent rebound at any time; be sure to wait for the rebound to position and strictly stop loss, and do not heavily speculate at low levels.
Pay attention to the Qinglan Crypto Class, let's grasp more trading opportunities together! Welcome to visit the official website www.qinglan.org
📊 Qinglan TPV Trading Strategy Backtest Reference
🕒 Last Backtest Time 11-19 07:00:01
Total Analysis: 5266 Backtest: 5139 Accuracy: 75.9% (3899/5139)
免责声明:本文章仅代表作者个人观点,不代表本平台的立场和观点。本文章仅供信息分享,不构成对任何人的任何投资建议。用户与作者之间的任何争议,与本平台无关。如网页中刊载的文章或图片涉及侵权,请提供相关的权利证明和身份证明发送邮件到[email protected],本平台相关工作人员将会进行核查。