Liying Chat Currency: Latest market analysis of 11.19 Bitcoin (BTC) and Ethereum (ETH)
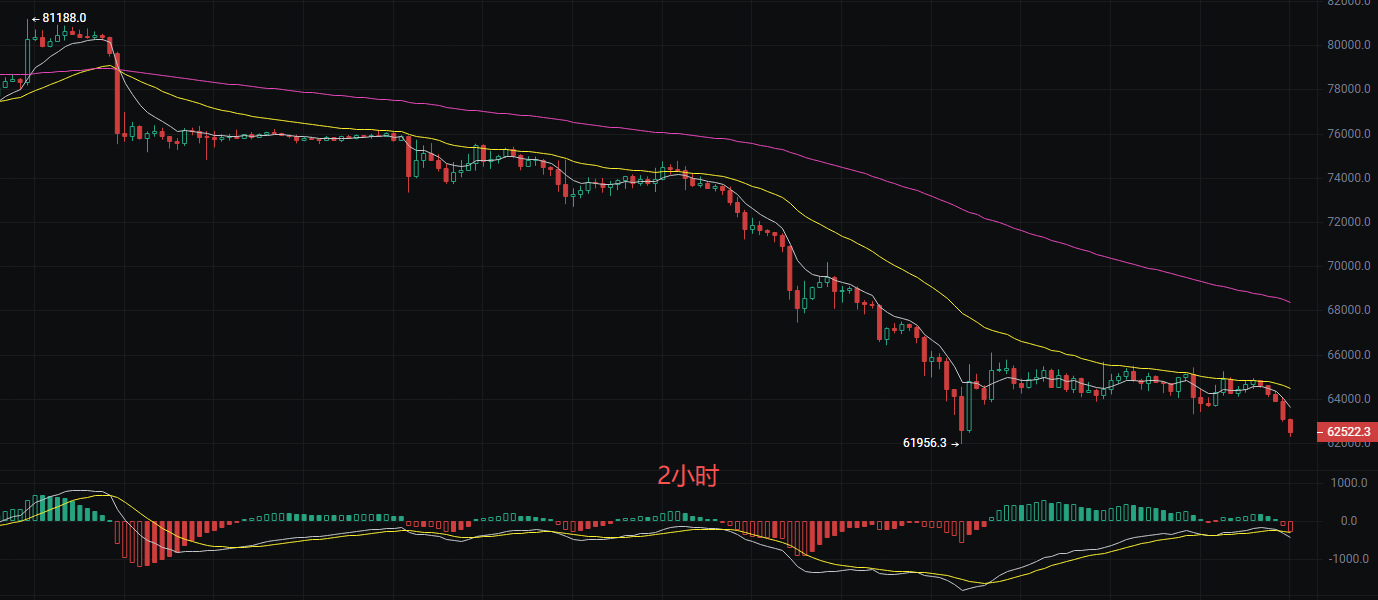
Family! The current price of Bitcoin is 62500, gasping for breath and going down the slope. Having come down from the peak of 81188, it has almost halved, and is now swaying around 62300. At this time, many newcomers want to jump in to catch the bottom as they see it drop a lot, but Liying has to throw a bucket of cold water on you: Don’t think it can’t drop anymore. The current market situation is like boiling a frog in warm water, dropping a little every day, bouncing back then dropping again. This kind of subtle decline is the most exhausting, and there is no obvious sign of large capital entering the market; everyone is waiting and watching, the technical aspect is completely under the control of bears. The EMA moving average system shows a perfect bearish arrangement, and the Bollinger Bands' opening is down, with bearish momentum yet to be fully released. The MACD indicators DIF and DEA are running in a death cross below the zero axis; although the bullish momentum is slightly emerging, its strength is very weak and cannot change the overall downward trend, this is very likely just a consolidation of the downward continuation.
Long and short strategy:
Preferred strategy to short: Stop-loss at 65200 above, target 63000-62500 at 63600 - 64500
Secondary strategy for entry: Current price 62300 or a pullback to 61500 not breaking, stop-loss: Definitely stop-loss if it breaks below 61000
Target: Short-term view 63500
Ethereum
Family, the current price of Ethereum is 1755, it is currently experiencing a continuous subtle decline, feeling like riding a downhill bus with no brakes, no one can hold on. Many people are thinking, "Since it has dropped so much, isn’t it time to catch the bottom?" But look at the candlestick chart, one bearish candle after another falls down, with almost no decent rebound, what does this indicate? It indicates that the bear's strength is still very strong, and bulls are completely unable to organize a counterattack. The moving average system shows a perfect bearish arrangement, MACD: Although DIF and DEA are below the zero axis, the bearish momentum continues to be released. The mid-track of the Bollinger Bands at 1804 is pressing down, with the price running closely to the lower track at 1760, which is a typical characteristic of a very weak unidirectional decline, meaning there is a risk of a continued violent drop at any time.
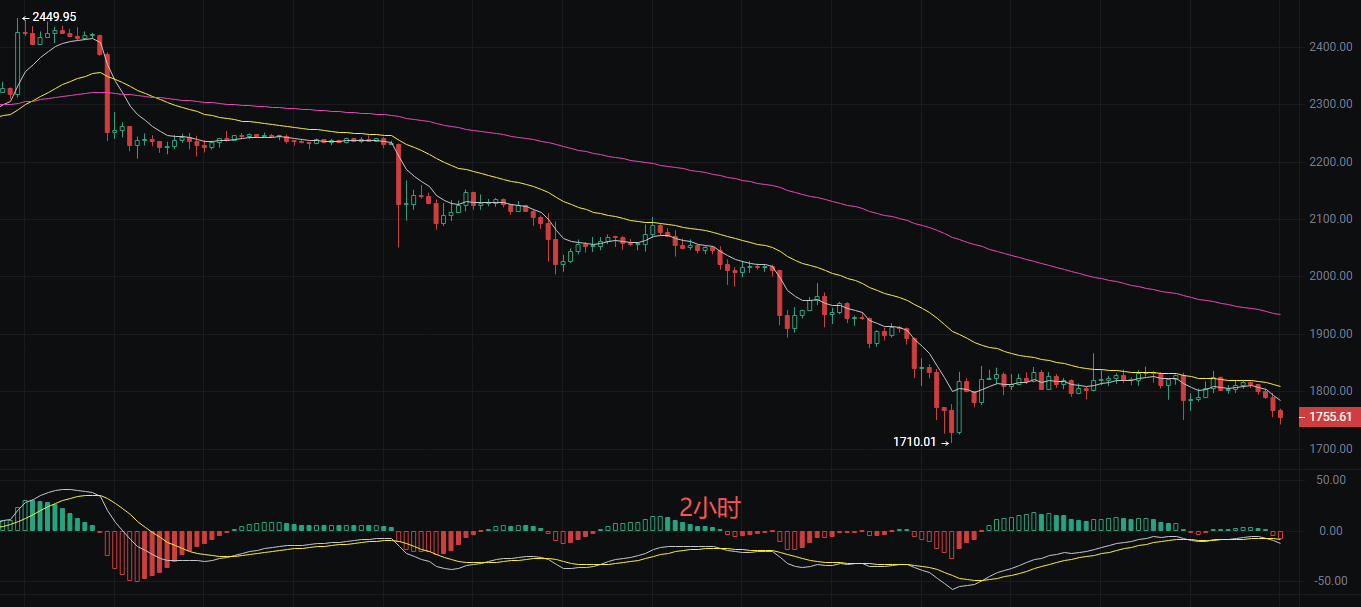
Short position 1780-1810 to short. Stop-loss 1825, target looking at 1650 after breaking the previous low
Long position 1750-1720 to try longs, stop-loss 1690, target 1800. In an extremely weak market, newcomers should be cautious about catching falling knives
The above content is exclusively created by Liying, please indicate the source when reprinting! Article publication review has delay, the market changes rapidly, the above suggestions are for reference only, risks are to be borne by oneself.
免责声明:本文章仅代表作者个人观点,不代表本平台的立场和观点。本文章仅供信息分享,不构成对任何人的任何投资建议。用户与作者之间的任何争议,与本平台无关。如网页中刊载的文章或图片涉及侵权,请提供相关的权利证明和身份证明发送邮件到[email protected],本平台相关工作人员将会进行核查。