Crypto Circle Academician: The trend of Ethereum (ETH) on 11.19 has not turned strong, momentum has not been exhausted: The most stable framework to cope with the current Ethereum market
In this wave of pullback, many people have held on, while the bulls have been waiting for a rebound daily, only to find themselves buried deeper; the bears have had a comfortable time, but as the price drops, they are increasingly afraid to chase, fearing they might step into a pit of a sharp rebound. The current price is around 1770, neither up nor down, which is the most likely to provoke impulse. This article does not offer comforting words, but directly lays out the daily K line and four-hour base cards: where the moving averages are pressing, where the indicators are at, what the support and resistance levels are, how to choose between long and short if really needed, and where to place stop-losses. You can treat it as a pre-market checklist; first, clearly understand the terrain before deciding whether to enter the market, because I personally entered at 1760, now with a stop-loss, even if wrong, it’s okay
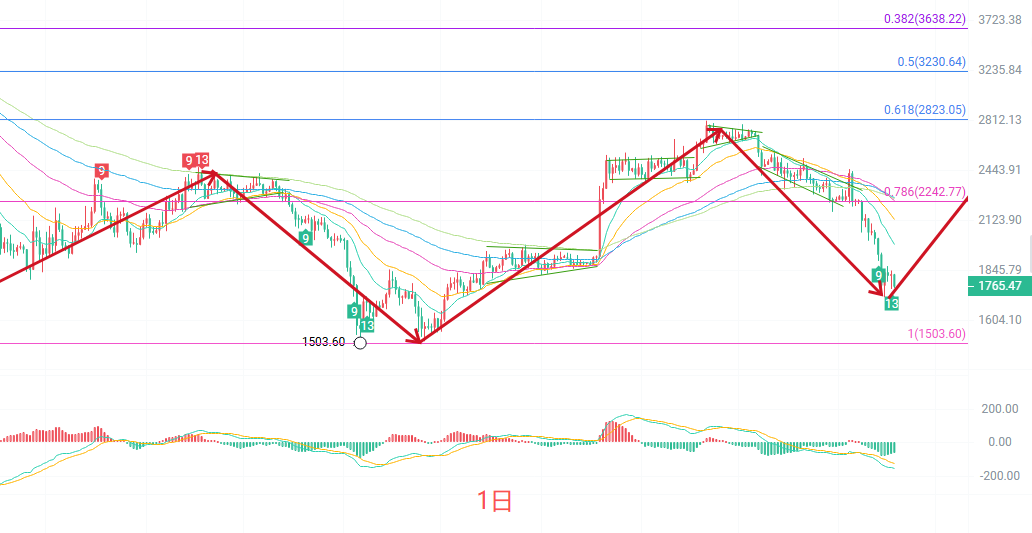
The daily K line entity's bearish candle penetrates the recent narrow consolidation range. In terms of moving averages, the price operates below all EMA five-day moving averages, with the moving averages from top to bottom exerting layered pressure, presenting a typical bearish arrangement in the medium term. As for the MACD, the green bars are still being released, with momentum biased to the downside. The middle track of the Bollinger Bands is at 2088, the upper track is at 2481, and the lower track is at 1695, the price is already close to running on the lower track. Overall, the daily trend remains weak, but close to the lower track and the previous dense area, one should guard against technical rebounds after further declines and should not blindly chase shorts at low levels
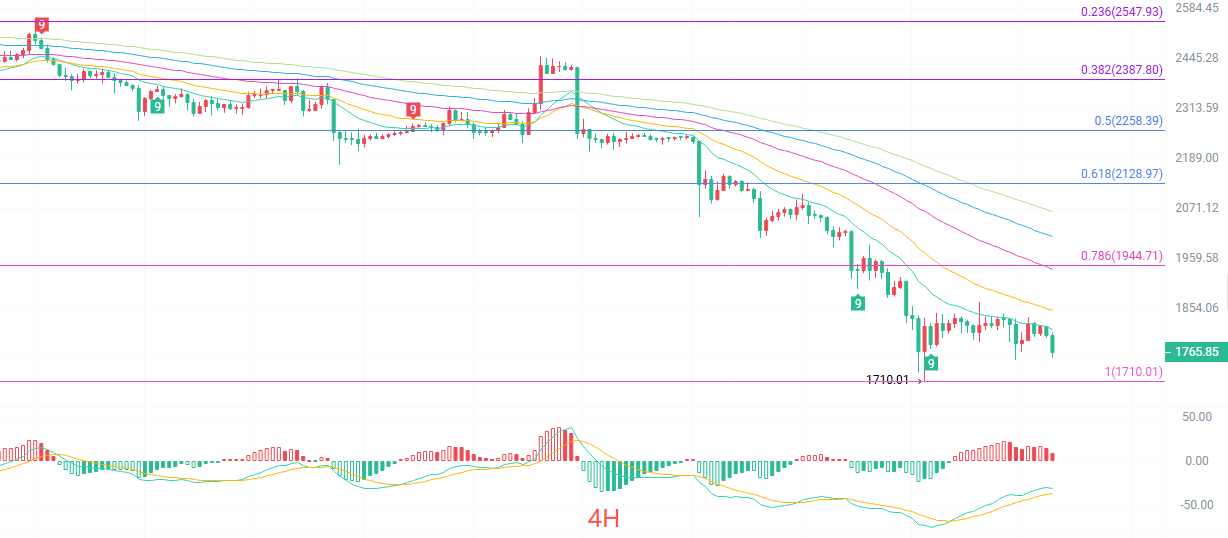
The four-hour K line touched the lower shadow line at 1755 before slightly pulling back. In terms of moving average structure, EMA15 at 1811 and EMA30 at 1799 are sitting just above the current price not far away, EMA60 at 1936, EMA90 at 2007, EMA120 at 2064 are all hanging high, limiting the short-term rebound space layer by layer. As for the MACD, the green bars are clearly converging, with a pattern of a golden cross forming at low levels, indicating that short-term selling pressure is weakening. The middle track of Bollinger Bands is at 1814, the upper track at 1846, and the lower track at 1781, the current price slightly breaking below the lower track; the previous low at 1710 is the last short-term defense line for the bulls. Overall, it belongs to a weak repair amidst the downward trend, with the decline slowing but the structure has not yet reversed
Short-term reference:
Southbound from 1800 to 1830 stagnating, stop-loss 30 points, target 1770 to 1750
Northbound from 1760 to 1740 stopping the decline, stop-loss 30 points, target 1800 to 1830
Specific operations should be based on real-time market data; for more details, you can consult the author, the article may have a delay in publication, and it is recommended for reference only, risk is self-borne
Warm reminder: The above content from the Crypto Circle Academician is synchronized and updated on major trading platforms such as Binance, OKEx, Huobi, etc. For more content, you can add me as a friend in Binance OKEx and join my fan group
免责声明:本文章仅代表作者个人观点,不代表本平台的立场和观点。本文章仅供信息分享,不构成对任何人的任何投资建议。用户与作者之间的任何争议,与本平台无关。如网页中刊载的文章或图片涉及侵权,请提供相关的权利证明和身份证明发送邮件到[email protected],本平台相关工作人员将会进行核查。