Cryptocurrency Scholar: The daily bearish arrangement of Bitcoin (BTC) has not changed as of November 19. Can the low-level golden cross on the four-hour chart end this round of decline?
After a sharp drop, there is always a desire to pick a bottom, which is human nature, but a significant drop is never a reason to buy; structural stabilization is. Currently, the four-hour green bars are narrowing, while the daily line remains suppressed below the moving averages, indicating a phase where both long and short positions can be taken but are not easy to execute, making it easy to get hit on both sides. In such a market condition, it is advisable to reduce trade frequency, better to miss a bounce than to heavily bet in the direction when the signals are unclear. If you can’t hold the stop-loss and become anxious when looking at the market, the best action is to wait and see, and I am doing the same.
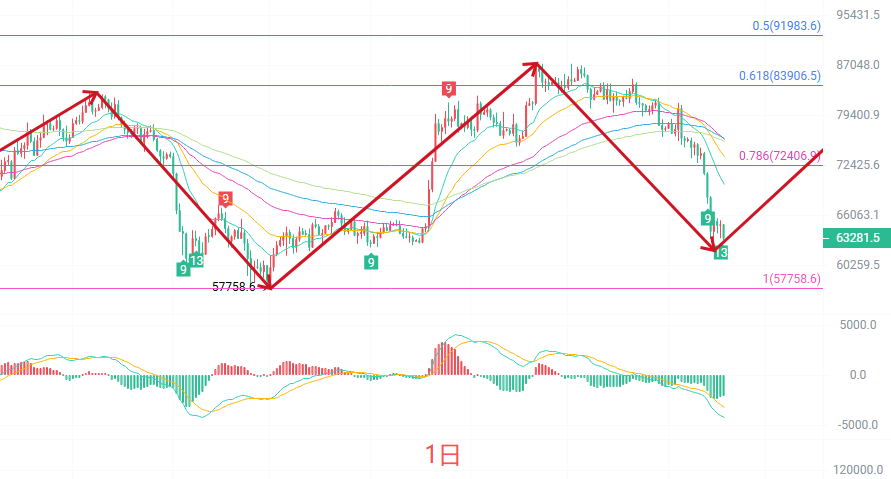
The daily candlestick chart shows a retreat from the rebound high around 81000, with consecutive bearish candles, and the latest daily candlestick has dropped below all short- to medium-term EMA moving averages, displaying a clear bearish arrangement, with prices operating at the lowest levels. In terms of MACD, the green bars continue to expand, and momentum remains bearish; the lower Bollinger Band at 62058 has been pierced downwards and then retraced, with the overall channel opening downwards. The daily chart shows a weak downward trend, and there has been no clear signal of stabilization in the rebound.
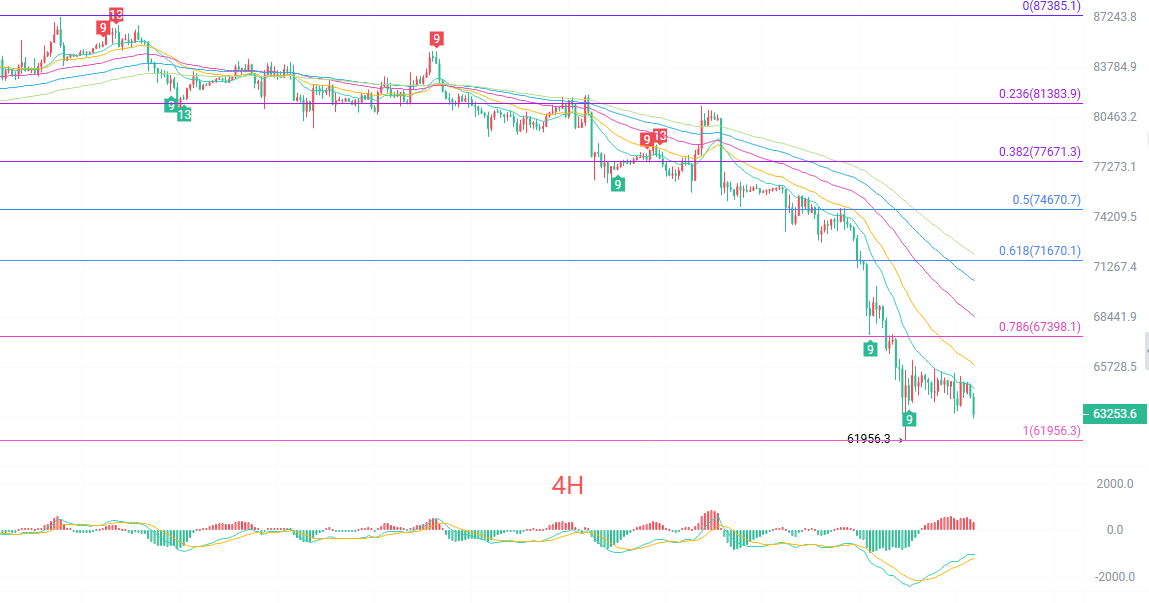
The four-hour candlestick chart briefly touched a low of 61950 before showing a small rebound, but the strength of the rebound is limited, and it is still being suppressed by the five-day EMA moving average. The short-term moving averages are converging downwards above, indicating a typical weak consolidation after a drop. Although the green bars of MACD show signs of narrowing, a golden cross has not yet formed; the lower Bollinger Band at 63694 has the price running close to it, while the middle band at 65547 forms the first resistance at the top. At the four-hour level, it is still in a bottom formation observation period, and before breaking out of the reversal structure, any rebound should be treated as a weak pullback.
Short-term reference:
Downward from 64500 to 65000 faces resistance; stop-loss at 500 points, target at 64000 to 63000.
Upward from 62500 to 62000 stops falling; stop-loss at 500 points, target at 63500 to 84500.
Specific operations should be based on real-time market data. For more detailed information, you can consult the author. There may be delays in article publication, and suggestions are for reference only; risk is to be borne by the individual.
Reminder: The above content is synchronously updated by the cryptocurrency scholar on major trading platforms such as Binance, OKEx, Huobi, etc. For more content, you can add me as a friend in Binance OKEx to join my fan group.
免责声明:本文章仅代表作者个人观点,不代表本平台的立场和观点。本文章仅供信息分享,不构成对任何人的任何投资建议。用户与作者之间的任何争议,与本平台无关。如网页中刊载的文章或图片涉及侵权,请提供相关的权利证明和身份证明发送邮件到[email protected],本平台相关工作人员将会进行核查。