Liying Chat Coin: Latest Market Analysis of Bitcoin (BTC) and Ethereum (ETH) on 11.19
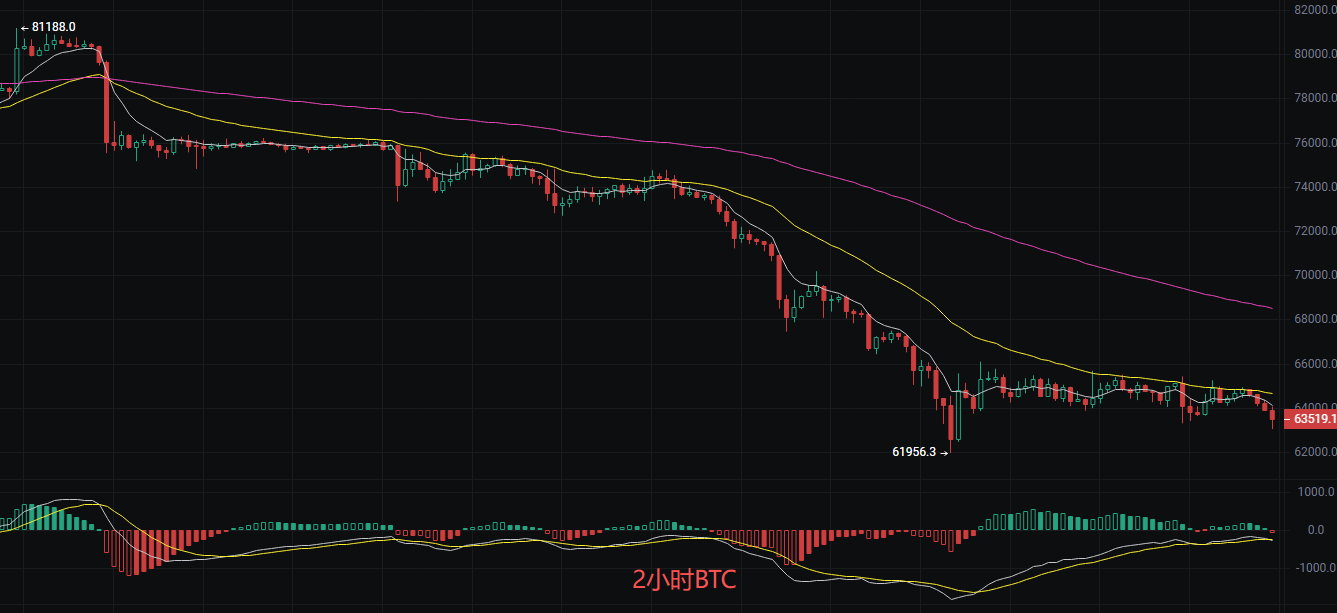
Family! The current price of Bitcoin is 63500, and the market really feels chilling. It’s lifeless. Many brothers who previously chased high prices probably can’t sleep now, wondering if it will drop further. To be honest, the current market looks like a dead pond, where there are grasped positions above. A slight increase will cause countless people to rush to sell to break even. What we normal retail investors fear the most right now is buying the dip only to end up in the middle of a decline. The current trend is a slow downward trend with no clear signal of stopping. The technical indicators are in a very complete bearish formation, showing no signs of reversal. The moving average system is in a bearish arrangement with all three lines diverging downwards. The MACD double lines are operating below the zero axis, continuing the descending state after a dead cross, indicating that while the downward momentum has eased, the bulls are powerless to resist. The price is currently operating below the mid-band of the Bollinger Bands at 64452, and the lower band at 63561 is on the verge of danger. If the closing price falls below the lower band, it will open up new downward space.
Bull and Bear Strategy:
Long position entry: 63560-63600 Stop loss: 63000 Target: 64400-64650
Short position entry: 64200-64400 Stop loss: 65000 Target: 63000-62000
Ethereum
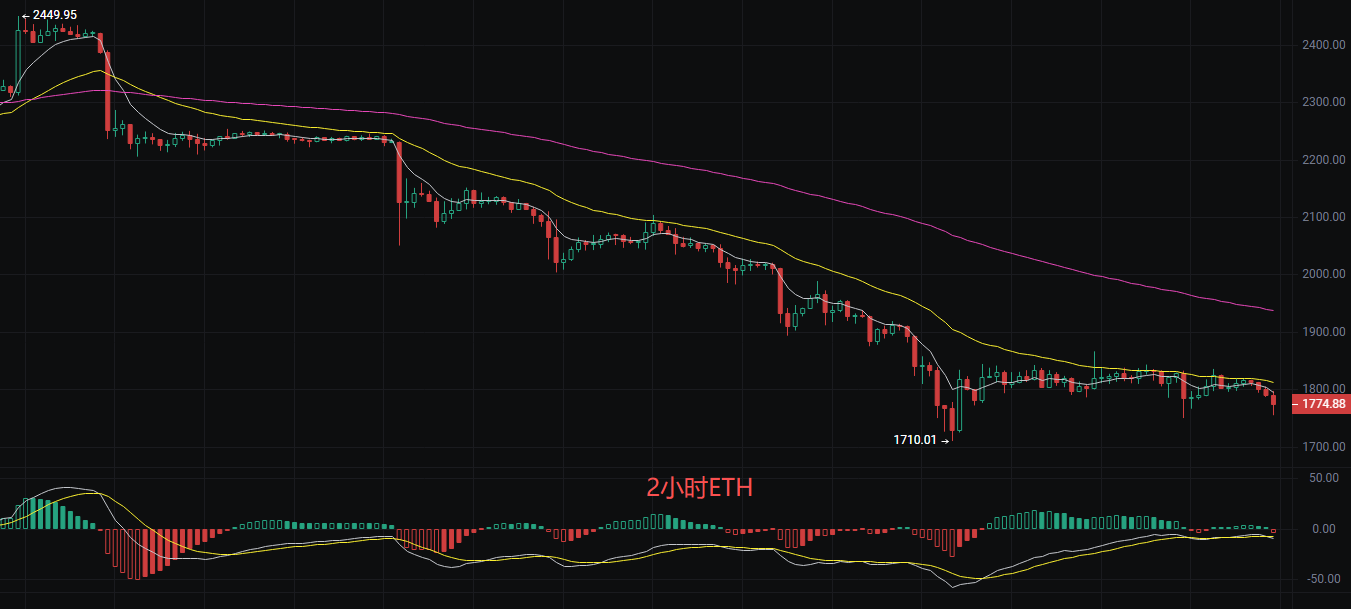
Family! The current price of Ethereum is 1774, and this trend can be said to be a very clear downward channel. A typical bearish arrangement. In the past few days, it has been consolidating sideways, not continuing to fall sharply, but the strength of the rebound is also very weak, unable to even touch 2000. To put it bluntly, it is now a weak market dominated by bears, and it is difficult for bulls to turn things around. From a technical indicator perspective, the signals are very consistent and bearish. The EMA7 crosses below EMA30 forming a dead cross, and the price is being suppressed by all medium to long-term moving averages, indicating heavy trapped positions above. The MACD indicator has temporarily weakened its downward momentum, but the double lines have not formed a golden cross, and the market is still in a weak bottom-finding phase. The mid-band of the Bollinger Bands is moving down, with the opening facing down, and the price is operating near the lower band at 1774. This suggests that 1773 is on the edge of extremely weak support, and if it falls below the lower band, it may trigger a new round of accelerated declines. Overall, the indicators show that the market is in an extremely weak state, and any rebound is merely a trap for bulls.
Weak Sideways Strategy: Focus on shorting at highs and support longs at lows.
Short position: Enter on the rebound at 1795-1800, stop loss at 1825, target 1710-1680.
Long position: Lightly test longs at the current price of 1770-1775, stop loss below 1700, target 1800-1820.
Risk Control: Before stabilizing above 1850, short at highs, and heavy positions are strictly prohibited.
The above content is exclusively created by Liying, please indicate the source when reprinting! Article publishing review has a certain delay, the market changes rapidly, the above suggestions are for reference only and risks are borne by the individual.
Warm reminder: The above content is only from Liying's official account: Crypto Training Camp, created by the author. The ads at the end of the article and in the comments section have nothing to do with the author; please discern carefully. Thank you for reading.
免责声明:本文章仅代表作者个人观点,不代表本平台的立场和观点。本文章仅供信息分享,不构成对任何人的任何投资建议。用户与作者之间的任何争议,与本平台无关。如网页中刊载的文章或图片涉及侵权,请提供相关的权利证明和身份证明发送邮件到[email protected],本平台相关工作人员将会进行核查。