Cryptocurrency Scholar: The Ethereum (ETH) rebound on 11.17 is a loss-reduction window, not a reason to chase. In a weak and volatile market, common trading wisdom is often overlooked.
The initial strategy for cash remains unchanged. The second step at 1500, with short-term contract traders primarily concerned with two questions: whether the rebound can be chased and whether the pullback can be caught. Those who are stuck at high positions are waiting to break even, and those who are in cash are waiting for positions. Both bulls and bears are pulling back and forth at this price level. In a volatile market, it is most taboo to trade based on feelings; shout reversal if it rises slightly, shout crash if it falls slightly, which results in getting hit from both sides. Next, let’s get straight to the point: first read the daily candlestick to set the general direction, then switch to the four-hour chart to find the rhythm, and finally lay out the triggering range for longs and shorts, stop-loss levels, and target levels.
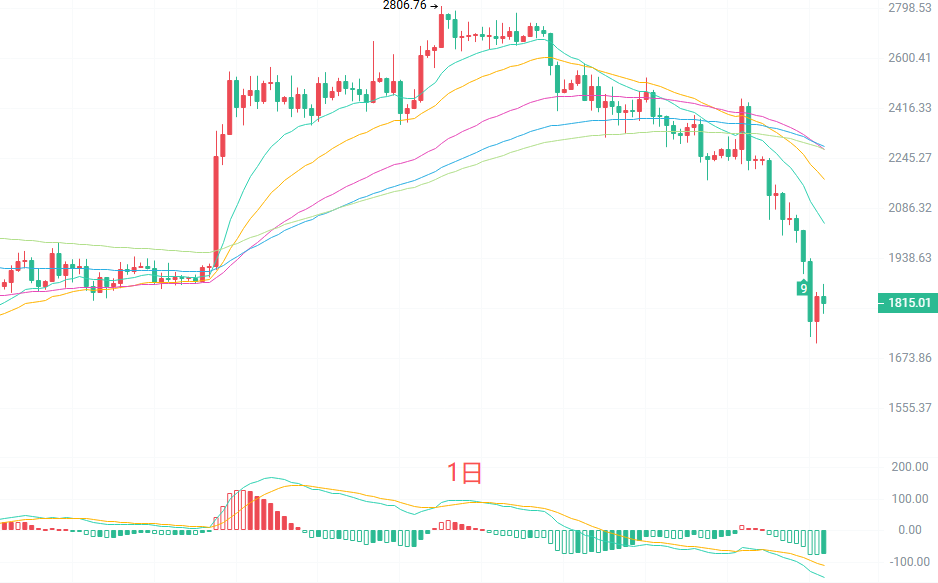
The daily candlestick is running below EMA15 at 2049, EMA30 at 2176, EMA60 at 2276, and other periodic moving averages. The short and medium-term moving averages are in a bearish arrangement, and the daily trend remains weak. In terms of MACD, both lines are positioned below the zero line, and the momentum has not yet shown a clear reversal. The middle band of the Bollinger Bands is at 2139, the upper band at 2499, and the lower band at 1779, with the price running close to the lower band, which falls into a weak range of volatility. The previous low of 1503 remains a long-term reference below, and in the short term, we need to observe whether the 1779 line can hold; there is currently no reversal structure visible on the daily level, with the rebound being more qualitatively regarded as a weak repair.
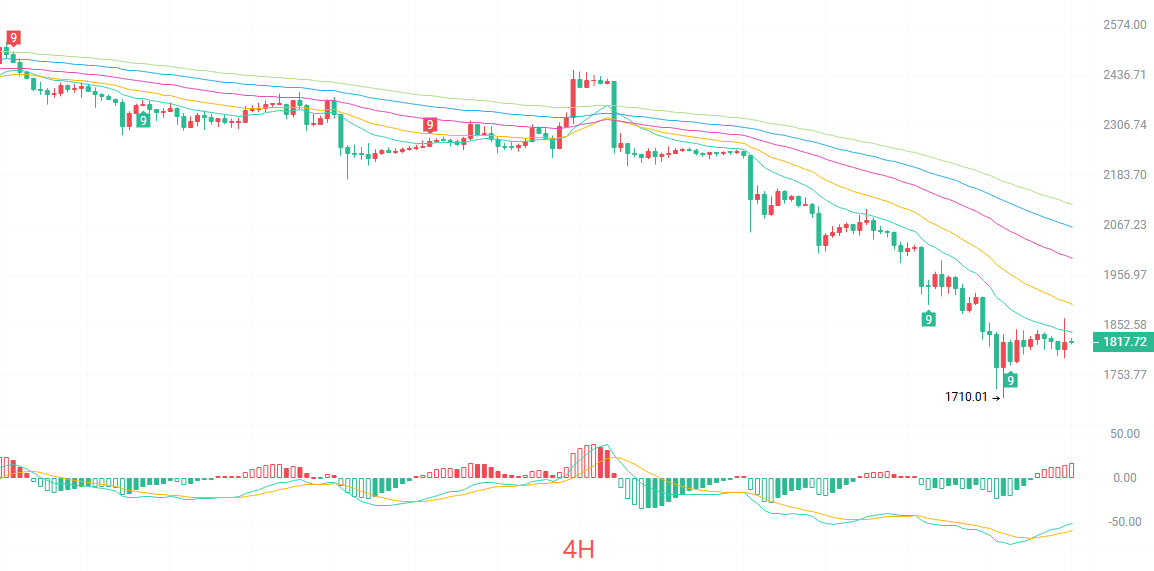
On the four-hour candlestick moving average level, EMA15 is at 1842, EMA30 is at 1901, and EMA60 is at 1999, with the price standing below the short-term moving averages, and the mid-term moving averages continuing to exert downward pressure, with the rebound strength not yet reversing. MACD is in a low area, with the dual lines showing signs of low convergence and attempting to turn up, representing a preliminary recovery signal after overselling, but it cannot yet confirm the formation of a golden cross. The middle band of the Bollinger Bands is at 1853, the upper band at 1965, and the lower band at 1741, and the price is oscillating between the middle and lower bands, with no breakout from the range yet. A TD sequence of 9 counts has appeared in the low area, indicating that there is a possibility of repeatedly building a bottom; first, look at whether it can recover between 1842 and 1854, and below, pay attention to two support levels at 1786 and 1741.
Short-term reference:
For movements down from 1840 to 1880, target a stop-loss of 30 points, with a target of breaking down from 1850 to 1800 looking at 1750.
For movements up from 1780 to 1740, target a stop-loss of 30 points, with a target of breaking up from 1820 to 1860 looking at 1930.
Specific operations should be primarily based on real-time data from the market. For more details, please consult the author. There may be a delay in the publication of the article; recommendations are for reference only and risks are borne by the reader.
Friendly reminder: The above content from the Cryptocurrency Scholar is updated simultaneously on major trading platforms such as Binance, Ouyi, Huobi, etc. For more content, you can add me as a friend in Binance Ouyi to join my fan group.
免责声明:本文章仅代表作者个人观点,不代表本平台的立场和观点。本文章仅供信息分享,不构成对任何人的任何投资建议。用户与作者之间的任何争议,与本平台无关。如网页中刊载的文章或图片涉及侵权,请提供相关的权利证明和身份证明发送邮件到[email protected],本平台相关工作人员将会进行核查。