Scholar of the Coin Circle: The Pullback Trap in the Downward Trend of Bitcoin (BTC) on November 17: Why it Cannot Return to the Moving Average, and the Bounce Should Be Treated as a Repair
We start with the first step of spot layout, the second step is 55000. When the trend is downward, two mistakes are most easily made: first, when it drops a little, one thinks "it's the end," frequently buying the dip and getting repeatedly trapped; second, when it bounces a little, one thinks "it's reversed" and chases it at the resistance level. Currently, the daily line is bearish and the four-hour line is oversold; essentially, it is a repair window within a weak situation, not a confirmation of trend reversal. Capital management always comes before directional judgment. Stop-loss is not to create trouble for oneself but to leave an opportunity for the next entry. The market does not lack opportunities; what is lacking is the capital to stay alive and wait for those opportunities.
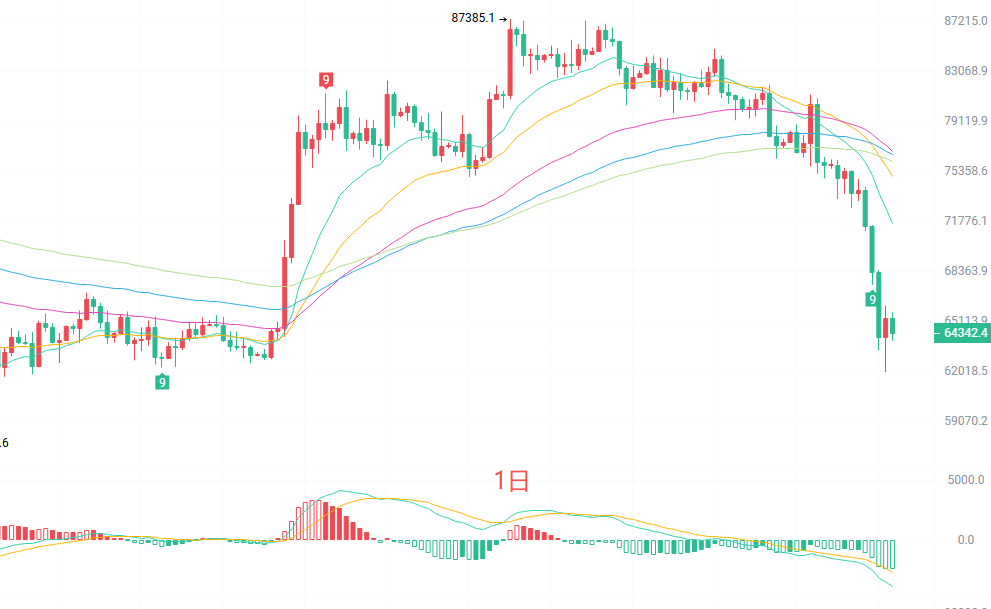
The daily K-line has fallen below all short, medium, and long-term moving averages pressed above the price, belonging to a typical bearish arrangement. The MACD double line operates below the zero axis, and the green bars are still being released; the bearish momentum on the daily line has not yet completely exhausted. The Bollinger Bands have a downward opening, with the price closely adhering to the lower band at 64470, and the mid-band at 74320 constitutes distant resistance. Overall, the daily line is still in a downward trend; although there is overselling near the lower band, before it re-establishes above the moving averages and the mid-band, the bounce should be treated more as a repair, and blind bottom-fishing is not advisable.
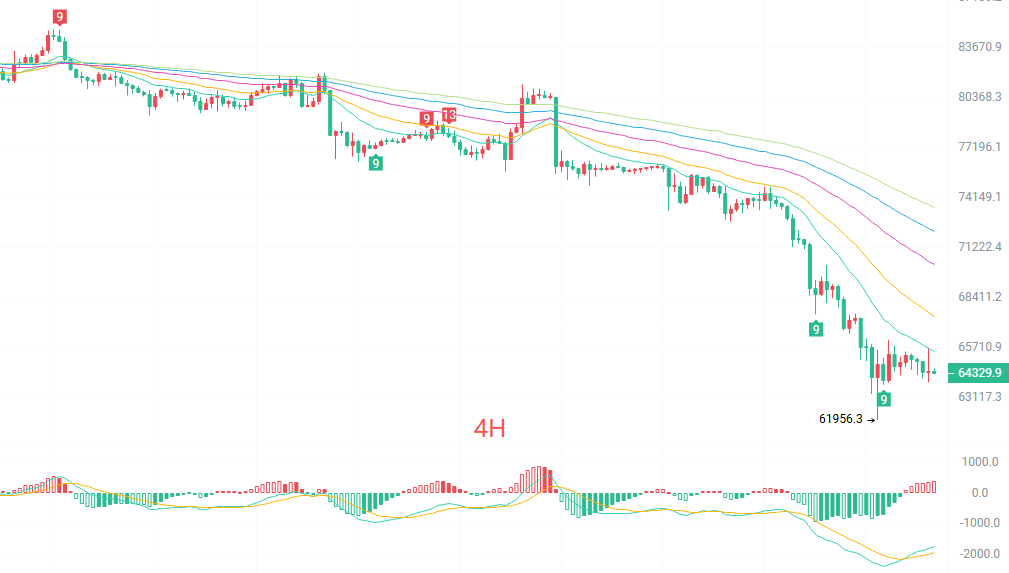
The four-hour K-line is located below all short and medium-term moving averages. The short-term bounce first faces the dual pressure of EMA15 and the Bollinger mid-band at 66008. The green bars below the MACD zero axis are notably converging, and there are even slight signs of turning red, indicating that after consecutive declines, the short-selling momentum has somewhat diminished, and there is a short-term demand for oversold repair. The lower band of Bollinger is at 62652, and this round's low point at 61956 constitutes support from below. Structurally, the four-hour line is still in a weak consolidation after the decline; the strength of the bounce determines whether it will build a continuation platform or produce a decent pullback, so it is necessary to observe whether the pressure zone at 65658–66008 can break through with volume.
Short-term reference:
For southbound position, 66000 to 66500 is stagnant, with a stop-loss of 500 points, target 65000 to 64300, breaking at 63000.
For northbound position, 62500 to 62000 stops the decline, with a stop-loss of 500 points, target 63500 to 84500.
Specific operations should be based on real-time market data. For more information, you can consult the author. The article may have a delay in publication, so it is suggested for reference only and the risk is borne by yourself.
Warm reminder: The above content is synchronized and updated by the scholar of the coin circle on major trading platforms such as Binance, OKEx, Huobi, etc. More content can be found by adding me as a friend in Binance OKEx and joining my fan group.
免责声明:本文章仅代表作者个人观点,不代表本平台的立场和观点。本文章仅供信息分享,不构成对任何人的任何投资建议。用户与作者之间的任何争议,与本平台无关。如网页中刊载的文章或图片涉及侵权,请提供相关的权利证明和身份证明发送邮件到[email protected],本平台相关工作人员将会进行核查。