After the market closed on November 1, BTC's weekly closing price was approximately $74,900, right near the 52-week moving average (around $76,100). At this point, the coin price had been running above the 52-week moving average for eight consecutive weeks, marking its first retest of this bull-bear dividing line. The previous weekly review quantitatively analyzed this position using the self-developed “52-week moving average confirmation method” and came to the conclusion that the market had reached a critical time window: whether the bull-bear transition could continue depended on whether the following two conditions were met. Until these conditions are confirmed, we still consider this round of market action as an oversold rebound and advise against premature optimism.
On the daily chart, BTC began its adjustment on September 21, and by the time of the last weekly review, it had lasted nearly 50 trading days without a single decent small-scale corrective rebound. At that time, the coin price was nearing the $72,500–$73,000 range, where it encountered three significant support levels: an ascending trendline (around $72,000), the 0.5 Fibonacci retracement level (at $72,610), and the “momentum boundary model” (between $72,510 and $73,120). We judged that, barring external disturbances, the probability of the market bottoming out and showing a small ii wave rebound here was very high.
However, contrary to our expectations, systemic risks surged last week, and BTC broke through the aforementioned support with a long bearish candlestick on high volume, subsequently plummeting for three consecutive trading days, causing market sentiment to plunge into extreme panic. The weekly K line produced a significant bearish candlestick with a decline of 13.98%, and the coin price effectively broke below the 52-week moving average. Thus, the bull-bear transitional market declared a failure, and the market returned to a bearish phase.
Altcoins also suffered. HYPE dropped 8.61% over the week, with a maximum fluctuation of 27.92%, dipping as low as $60 during trading, finally closing at $68.11, just above the long-term ascending trendline, giving the bulls a glimmer of hope.
After the sharp downturn, the next question is: where will BTC's decline stop? Has a major turning point signal already appeared? Can HYPE’s long-term ascending trend hold? This week's review will analyze the situation using Cheng theory’s structural analysis, the “daily turning point monitoring system,” and the three-line support system, along with proposed strategies for this week.
Core trading viewpoints for this week:
• Analysis of BTC’s weekly chart structural trends (details in the first part)
• Analysis of BTC’s daily chart structural trends (details in the second part)
• Predictions for BTC this week and strategies for medium and short-term operations (details in the third part)
• Analysis of HYPE’s daily chart structural trends (details in the fourth part)
• Predictions for HYPE this week and strategies for short-term operations (details in the fifth part)
I. Analysis of BTC’s Weekly Chart Structural Trends
After the market closed on November 1, BTC’s weekly closing price was recorded at approximately $74,900, situated near the 52-week moving average (around $76,100). At that time, we utilized our custom-built “52-week moving average confirmation method” with its three quantitative principles (details in previous weekly review) to conduct a detailed analysis of the market trend, concluding that the price had returned to the 52-week moving average after running above it for eight weeks, indicating that the market had reached a key time window. We pointed out that whether the market could continue its bull-bear transition depended on whether the subsequent two conditions were met, thus assessing the market as an oversold rebound at that time.
Last week, driven by systemic risks, prices quickly broke through multiple support levels and declined sharply, leading to a bearish K line with a drop of 13.98%. With the coin price effectively falling below the 52-week moving average, the bull-bear transitional market declared a failure, and the market returned to bearish territory.
Next, we will use the Cheng theory analysis system to perform a detailed breakdown of the current weekly chart structure.
1. Review of the Weekly Assessment from August 24
As illustrated in Figure 1: This was our first introduction of the Cheng theory technical system to analyze BTC's weekly chart structure. At that time, the market was in a (3-4) rebound phase, with prices approaching the upper bound of the range (dotted box) near $82,850. We held a clear view that this upper bound constituted a short-term bull-bear dividing line; even if the price briefly broke through (upward pressure seen at $90,000), the probability was very high that the (3-4) rebound phase would terminate in this area, after which the market was expected to enter a potential (4-5) adjustment phase (marked by the green arrows in the figure), with prices likely adjusting downwards towards the range median or lower bound for support (details in the August 24 weekly review). Nearly three months later, our judgments have been validated by the actual market performance.
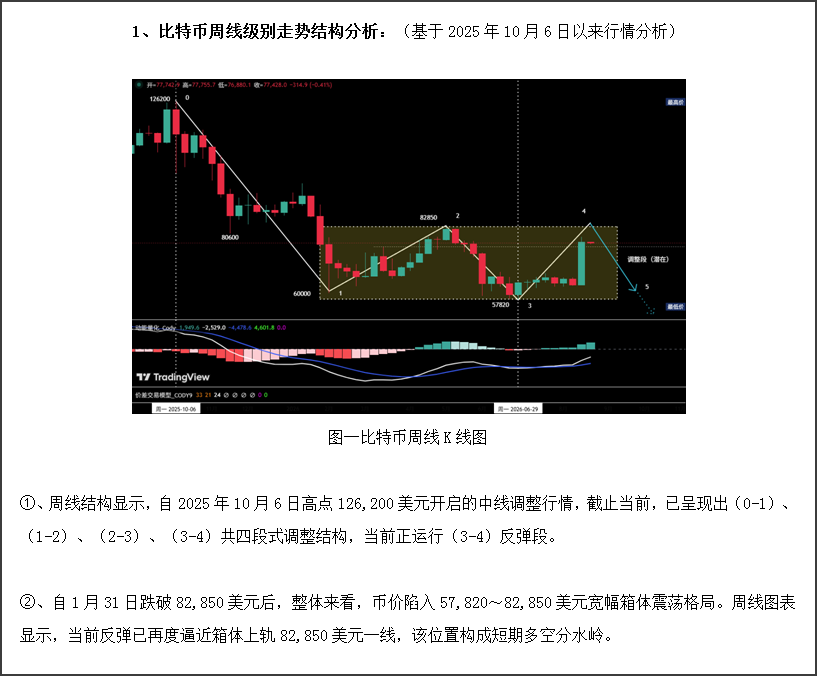 Figure 1 Weekly Review Image Display (August 24 Weekly Review)
2. Analysis of Current Weekly Chart Structure
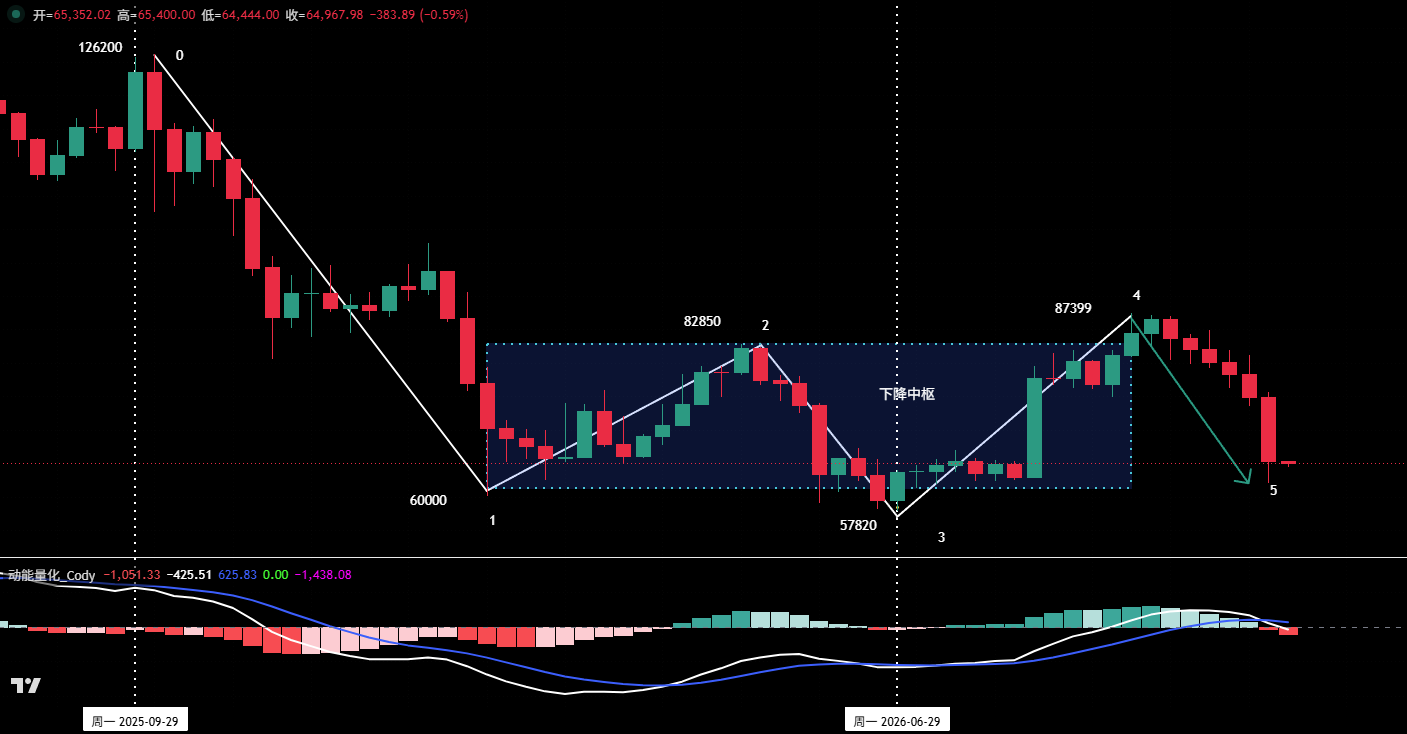
Figure 2 BTC Weekly K Chart
① Panorama of the Adjustment Structure
As shown in Figure 2, since the mid-line adjustment began from the high point of $126,200 on October 6, 2025, the weekly framework has presented five segmented adjustment structures: (0-1), (1-2), (2-3), (3-4), (4-5), and currently, we are operating in the (4-5) adjustment phase.
② Construction of the Descending Center
• Based on the three overlapping segments: (1-2), (2-3), and (3-4), they construct a descending center.
• Center upper bound: approximately $82,850; lower bound: approximately $60,000.
• The entry segment into the center is (0-1), while the potential exit segment from the center is (4-5).
③ Forecasting the Subsequent Trend After Exiting the Potential Center (4-5)
Path 1: Strong support near the lower boundary of the center. If endpoint 5 subsequently finishes in the $57,820–$60,000 range, it indicates a failure to establish the center exit segment, and the probability of maintaining a range-bound oscillation pattern will be high, waiting for the oscillation to conclude before selecting a direction.
Path 2: If the price at endpoint 5 breaks below the previous low of $57,820, it signifies the establishment of the center exit segment. From the analysis of our self-built “momentum quantification model,” if the coin price sets a new low in this round of adjustment, in terms of both downward momentum and volume dimensions, there will be a significant level of bottom divergence. Hence, even if a new low is set, the downward adjustment space is relatively limited.
II. Analysis of BTC’s Daily Chart Structural Trends
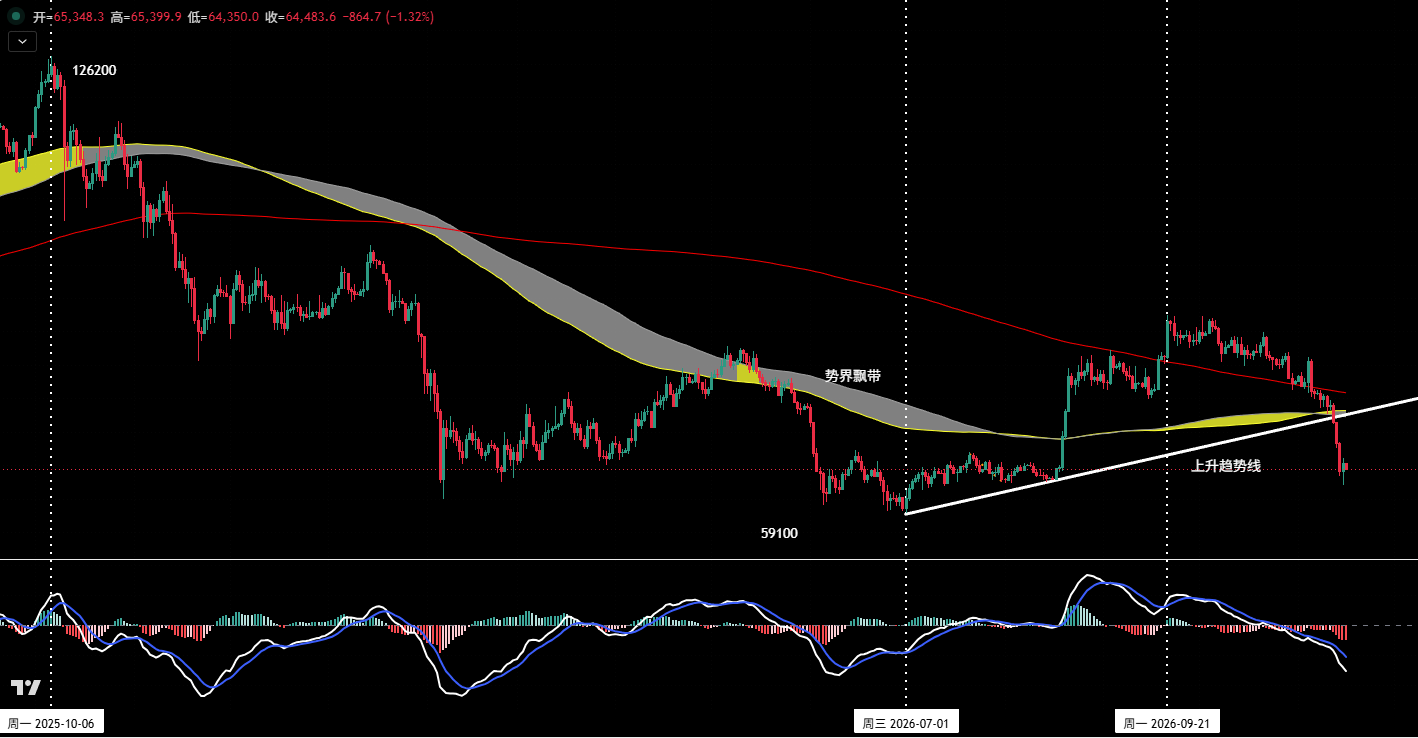 Figure 3 BTC Daily K Chart
1. Review: Last Weekly Assessment Retrospective
As shown in Figure 3, in the last weekly review, we made the following judgment: BTC started its adjustment on September 21, and now it had lasted nearly 50 trading days without a single small corrective rebound. At that time, the coin price was approaching the $72,500–$73,000 range, nearing a dense area of multiple technical supports.
• Ascending Trendline: Formed by connecting the July 1 low of $57,820 with several key lower points, located around $72,000;
• Fibonacci Retracement Levels: 0.5 level at $72,610, 0.618 level at $69,120;
• Self-Developed “Momentum Boundary Model”: Upper bound at $73,120, lower bound at $72,510.
Based on the aforementioned support structure, we believed that barring external news disturbances, the probability of the market bottoming out and stabilizing in this area and showing a small ii wave rebound was very high.
However, things did not go as hoped. Under the impact of systemic risks, the coin price sliced through the aforementioned multiple supports with a long bearish candlestick, then plummeted directly for three trading days, leading to extreme panic in the market sentiment.
2. Self-Developed “Daily Turning Point Monitoring System,” a Major Turning Point Assessment Tool
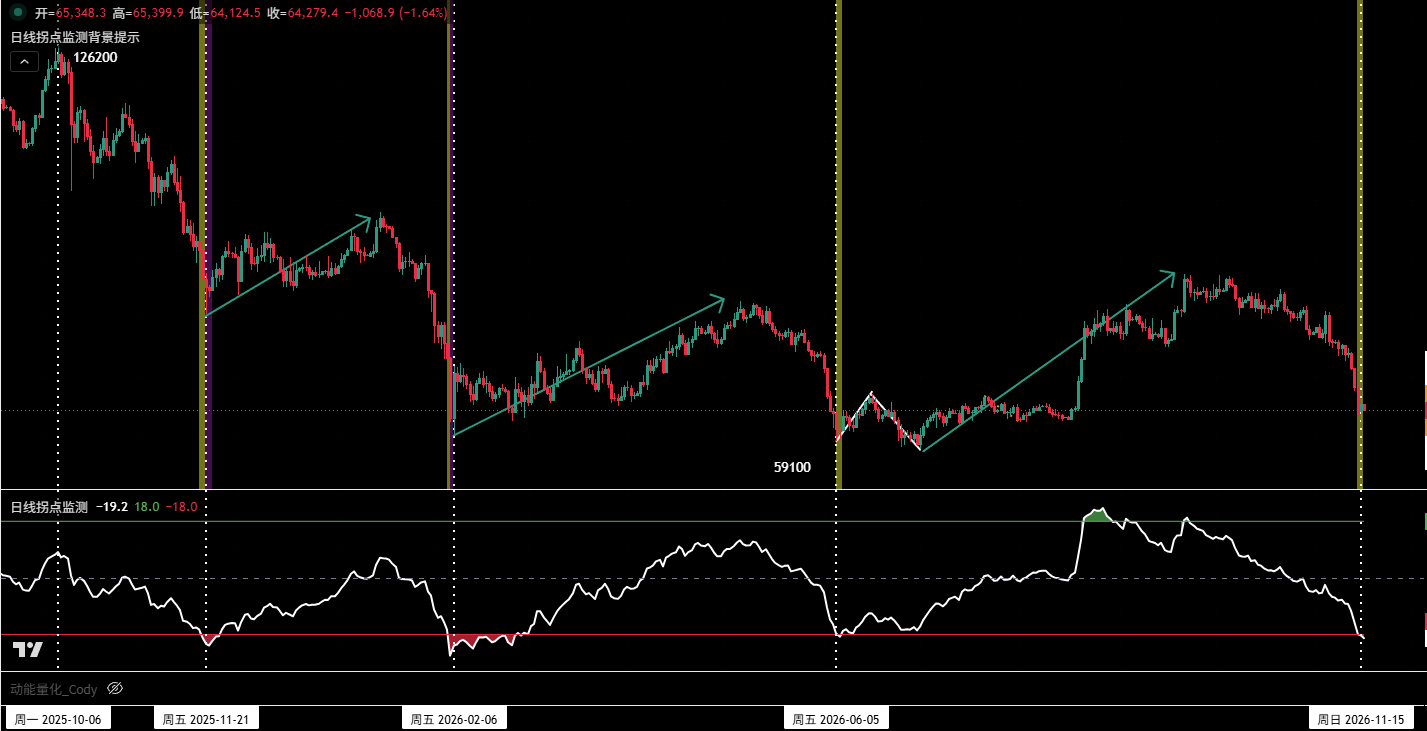
Figure 4 Daily Turning Point Monitoring System
① Model Composition and Applicable Scenario
This monitoring system begins with changes in energy from both the momentum and volume dimensions, and overlays the market panic index, to jointly construct a set of turning point monitoring models for peaks and troughs. This model is suitable for daily chart environments and is specifically used to capture larger level turning points; it shows relatively better identification results in extreme market conditions of sharp declines or sharp rises.
② Functional Signal Explanation
• Yellow Background Signal (Daily Bottom Area): When the market experiences a sharp decline, once the system detects that the price has entered the daily bottom area, it issues a yellow background signal in the K chart, displaying corresponding values simultaneously.
• Purple Background Signal (Deep Bottom Area): When the market experiences a sustained decline, once the system detects that the price has entered the deep bottom area, it issues a purple background signal in the K chart, displaying corresponding values simultaneously.
3. Case Analysis
As shown in Figure 4, since BTC's adjustment began from the high point of $126,200 in October 2025, the “Daily Turning Point Monitoring System” has captured and validated three major level turning points with a success rate of about 70%. Currently, we have received a fourth signal.
① Case Analysis One
• Time: November 21, 2025
• Phase Low Point: Near $80,636
• Background Signal: Yellow → Purple
• (Turning Point) Depth Index: -16.5 → -21
• Subsequent Trend: $80,636 rebounded to $97,925; lasting about 54 trading days, with an increase of 21.4%.
② Case Analysis Two
• Time: February 6, 2026
• Phase Low Point: Near $60,000
• Background Signal: Yellow → Purple
• (Turning Point) Depth Index: -16.5 → -24.7
• Subsequent Trend: $60,000 rebounded to $82,850; lasting about 89 trading days, with an increase of 38.1%.
③ Case Analysis Three
• Time: June 5, 2026
• Phase Low Point: Near $59,111
• Background Signal: Yellow
• (Turning Point) Depth Index: -17.7 → -18.7
• Subsequent Trend (divided into three phases):
First Phase: From $59,111 to $67,300 (approximately 13.85% rebound);
Second Phase: From $67,000 to $57,820 (bottom testing);
Third Phase: From $57,820 rebounding to $87,399; lasting about 108 trading days; with a total increase of 47.9%.
The two low points (at $57,820 and $59,111) are 2.2% apart (around $1,291).
④ Case Analysis Four (currently ongoing)
• Time: November 15, 2026
• Phase Low Point: Near $62,000 (not yet determined)
• Background Signal: Yellow
• (Turning Point) Depth Index: -18 → -18.8
• Subsequent Trend: Unknown.
III. Predictions and Strategies for BTC This Week
1. Predictions for BTC’s Market Trends This Week
This week’s core viewpoint: Focus on whether the market can find a bottom and stabilize in the $57,820–$60,000 region.
2. Core Resistance Levels
• First resistance zone: $67,300–$69,000 (previous important level)
• Second resistance zone: $72,500–$73,000 (previous important level)
• Third resistance zone: $75,500–$76,000 (previous important level)
3. Core Support Levels
• First support level: $60,000–$62,000 (previous important support level)
• Second support level: Near $57,820 (previous important low)
• Third support level: Near $54,500 (previous important low)
4. Strategies for this Week (excluding sudden news impacts)
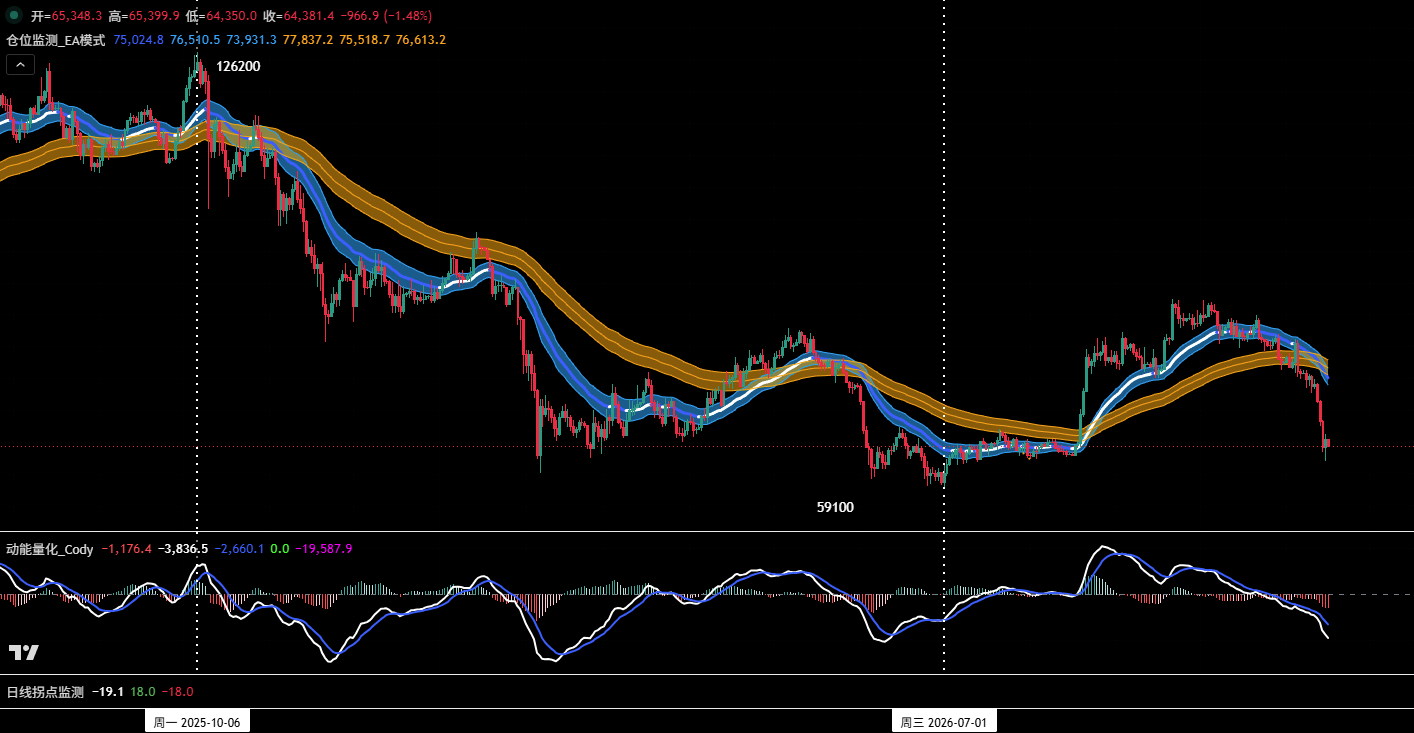 Figure 5 BTC _ Daily K Chart: (Position Monitoring Model)
① Medium-term Strategy: Stay in Cash
As shown in Figure 5, the current coin price has effectively fallen below the “position monitoring channel.” Considering the current market environment and the position, the medium-term strategy will primarily be to remain in cash.
② Short-term Strategy: Mainly Stay in Cash
For the short term, we will similarly remain in cash and wait for the market to clarify its direction before taking action.
IV. Analysis of HYPE’s Daily Chart Structural Trends
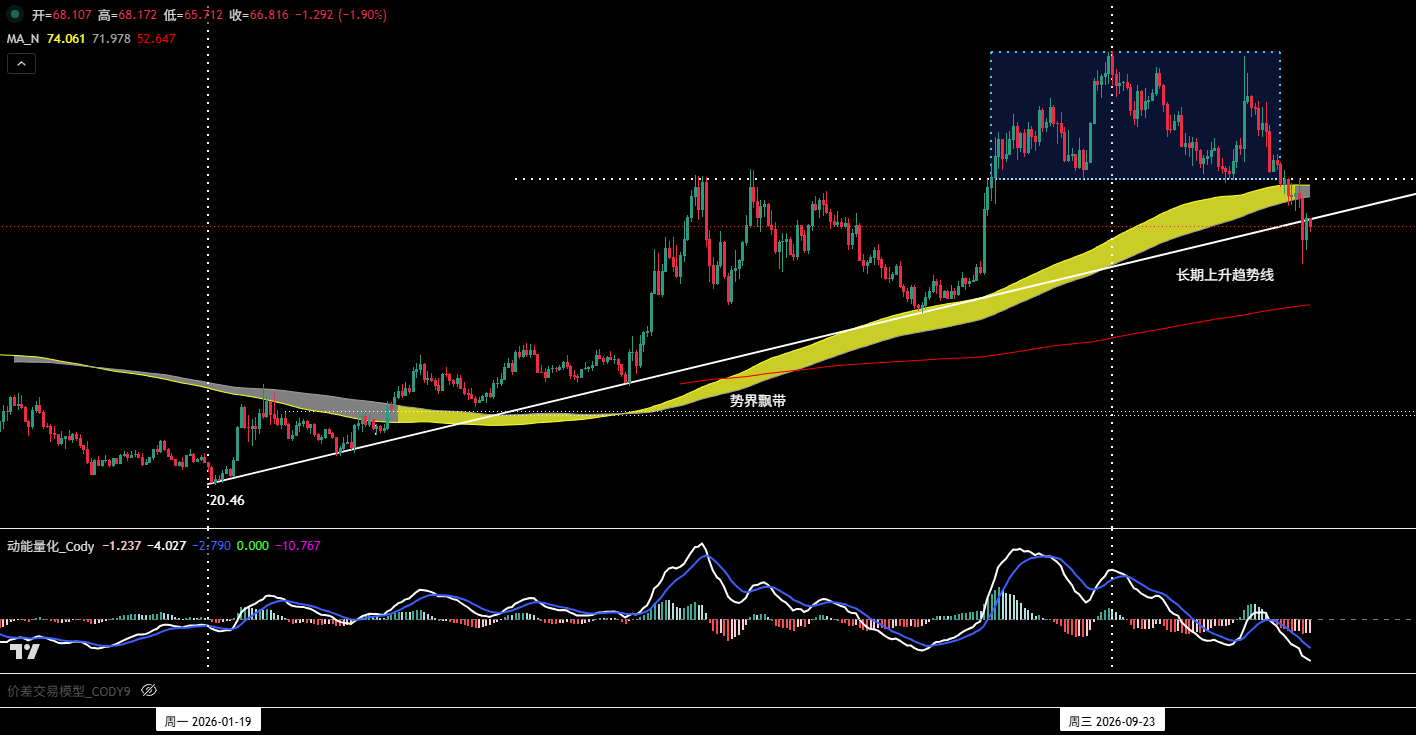
Figure 6 HYPE Daily K Chart
1. Review of Last Week’s Market: The Last Defense Line Still Holds Some Hope
As shown in Figure 6, in the last weekly review, we built a three-line support system from trend direction to the bullish lifeline to make layered assessments of HYPE's price points. The three defense lines, from high to low, are:
① Lower edge of the range: near $75;
② Self-developed “momentum boundary model”: upper bound near $74; lower bound near $71;
③ Long-term ascending trendline: near $68.
Last week, the market experienced systemic adjustments, and HYPE also faced pressure. It closed at $68.11, dipping to as low as $60 during trading; the weekly decline was 8.61% with a swing of 27.92%. The weekly line showed a long lower shadow K line, closing accurately above the long-term ascending trendline, indicating that the bulls still have a glimmer of hope.
2. Analysis of the Current Trend Structure
① Last week's K line had a long lower shadow, with a shadow length of $8 (about 12% of the closing price). A long lower shadow generally indicates strong buying support below, signaling bullish resistance. But caution is warranted regarding a potential bearish rebound. Prices may retest the low of the shadow (around $60) to confirm the validity of that support. Therefore, a “lower shadow” does not equal “stabilization.”
② The current price has fallen below the lower bound of the “momentum boundary,” but it has not yet entered an effective confirmation phase. We always regard the “momentum boundary” as a criterion for determining trend direction. If the upward trend persists, bulls should use the support of the long-term ascending trendline to quickly launch a counterattack to break above the upper bound of the boundary to reconfirm the bullish market; otherwise, the trend assessment will gradually weaken.
③ The long-term ascending trendline is the last line of defense for the bulls. As long as the weekly chart does not close below that line with an actual body, the current market remains within the framework of an upward trend; conversely, if the subsequent weekly close effectively loses that line, the current uptrend that started from the January 21 low of $20.14 may come to an end.
V. Predictions and Short-term Operation Strategies for HYPE This Week
1. Predictions for HYPE’s Market Trends This Week
① Core Resistance Levels:
• First resistance level: Near $71 (lower bound of the boundary)
• Second resistance level: $74–$75 range (upper bound of the boundary, lower edge of the range)
• Third resistance level: Near $82.5
② Core Support Levels:
• First support level: Near $68 (long-term ascending trendline)
• Second support level: Near $60 (key low)
• Third support level: $50–$52 range (key support area)
③ Core Viewpoints for This Week:
This week we will focus on whether the price can hold above the long-term ascending trendline.
2. Short-term Operation Strategy for HYPE This Week
This week will primarily be to remain in cash and watch.
VI. Special Reminder
1. When opening a position: Set an initial stop-loss immediately.
2. When profit reaches 1%: Move the stop-loss to the entry cost price (break-even point) to ensure capital safety.
3. When profit reaches 2%: Move the stop-loss to the position where profit is 1%.
4. Continuous Tracking: After that, for every additional 1% profit, move the stop-loss by 1% to dynamically protect and lock in profits.
The financial market is ever-changing; all market analyses and trading strategies must be dynamically adjusted. All viewpoints, analytical models, and operational strategies mentioned in this article stem from personal technical analyses and are for personal trading logs only—not to be construed as any investment advice or operational basis. Market risks exist; investments should be made cautiously, do not base decisions on this.
免责声明:本文章仅代表作者个人观点,不代表本平台的立场和观点。本文章仅供信息分享,不构成对任何人的任何投资建议。用户与作者之间的任何争议,与本平台无关。如网页中刊载的文章或图片涉及侵权,请提供相关的权利证明和身份证明发送邮件到[email protected],本平台相关工作人员将会进行核查。


