A coin suddenly skyrockets to the trending list, with big bullish candlesticks filling the screen. Your hand is almost ready to hit the order button, but a thought crosses your mind: Is it still a good time to enter? I usually pull my hand back first, to see if there are any trades following this surge, and where it might hit selling pressure. I cannot decide where to enter now based on how much it has already risen, nor can I tell where to retreat if I make a mistake.
First find unusual movements, then see if there's any follow-through
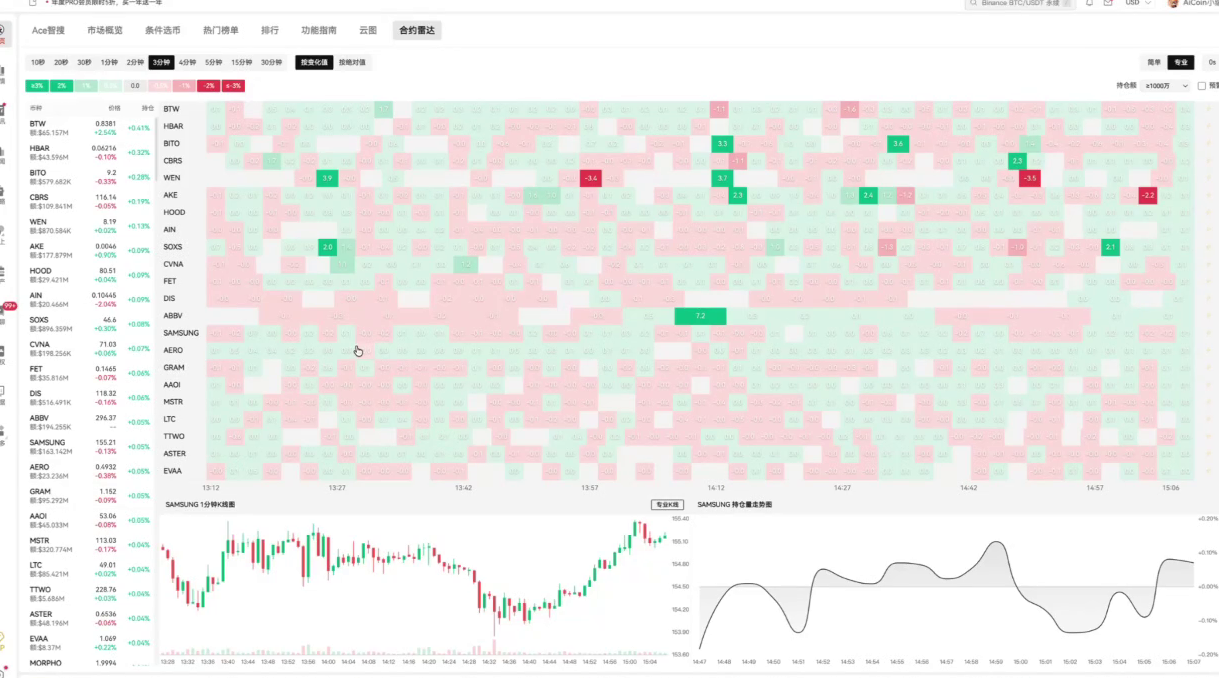
I start from the contract radar on the homepage, looking at the 5-minute chart; if the market is moving quickly, I narrow the window a bit more. In this demonstration, I used the filter condition of a trading volume greater than ten million. After identifying a coin showing activity, I compare its recent trading volume over the past 24 hours with the previous few days. If the price is still pushing upwards but the short-term volume has cooled down, I'll wait a little longer. For coins suddenly rising on the list, I also check the news and social media section for any updates. If I can't find anything, I'll just leave the reason blank for now.
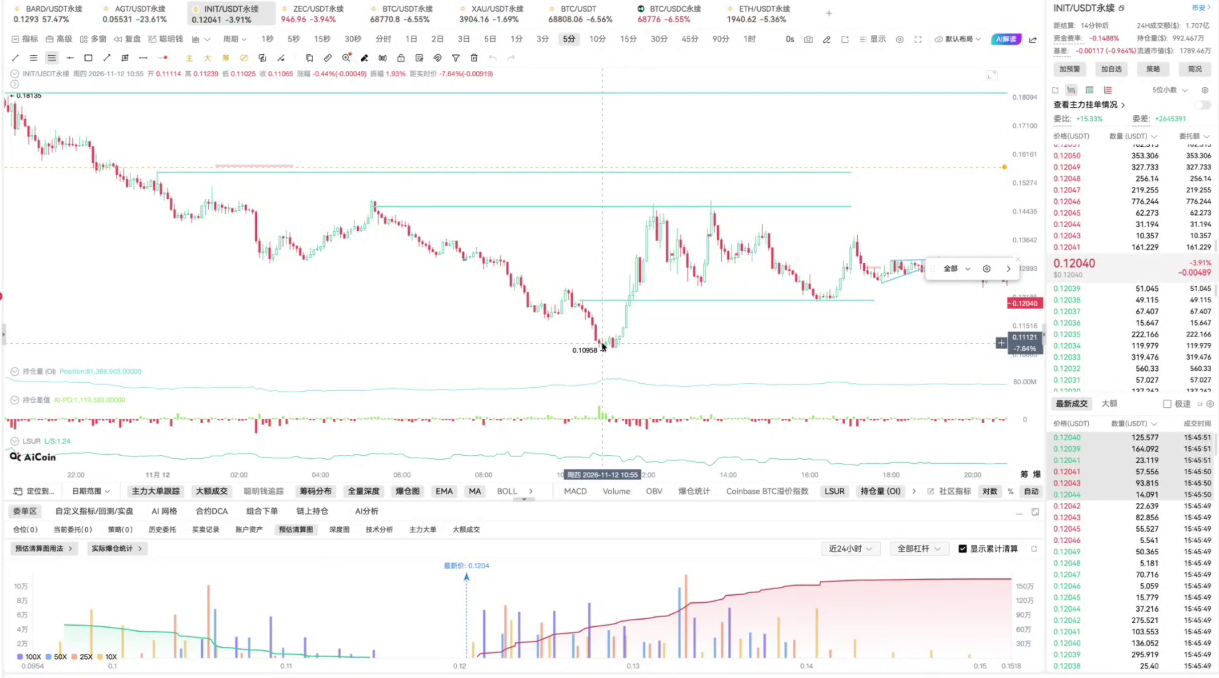
Then I compare the open interest (OI) with the long-short ratio (LSUR). OI indicates how many contracts are still open for trading, as each contract has both long and short positions. If the LSUR is below 1, it indicates that there are more short accounts within the statistics. As for how much capital is on each side, you can't determine that by looking at just the number of accounts. When OI is rising and LSUR stays below 1, I'll switch back to the candlestick chart, check where the price is heading, and see if any trades accompany it. For BTC and smaller coins with thinner orders, I will analyze them separately.
Keep a little width on resistance levels
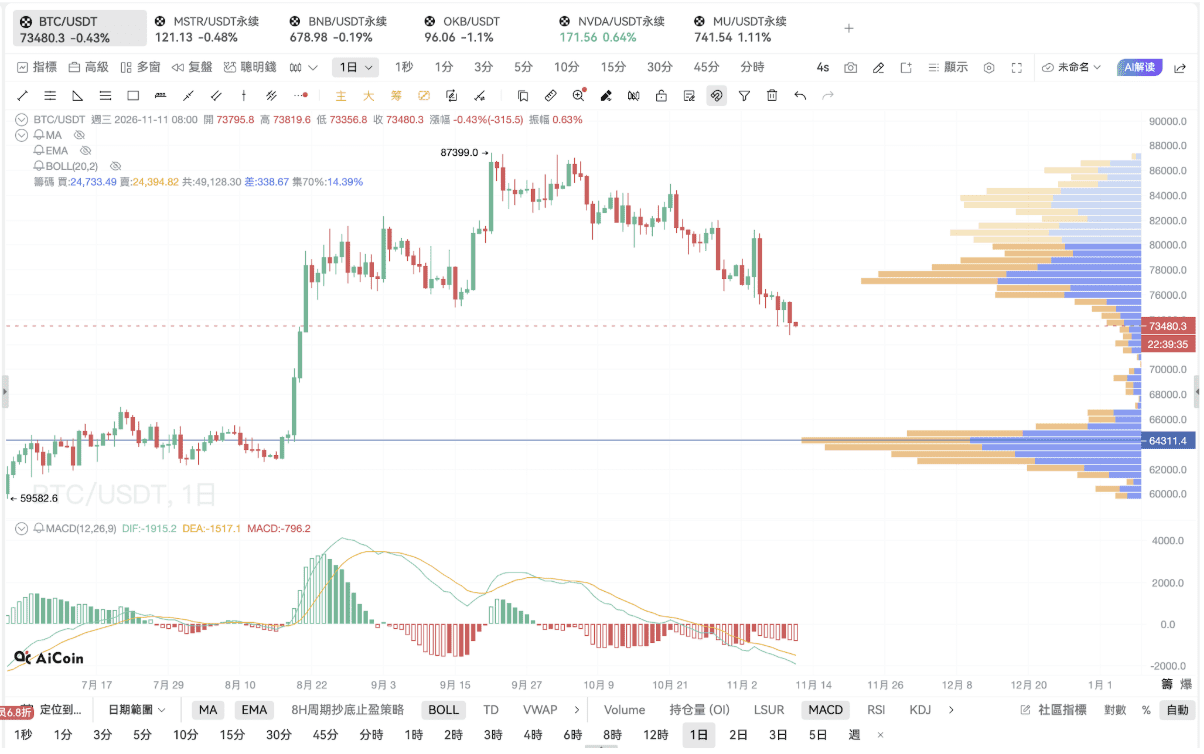
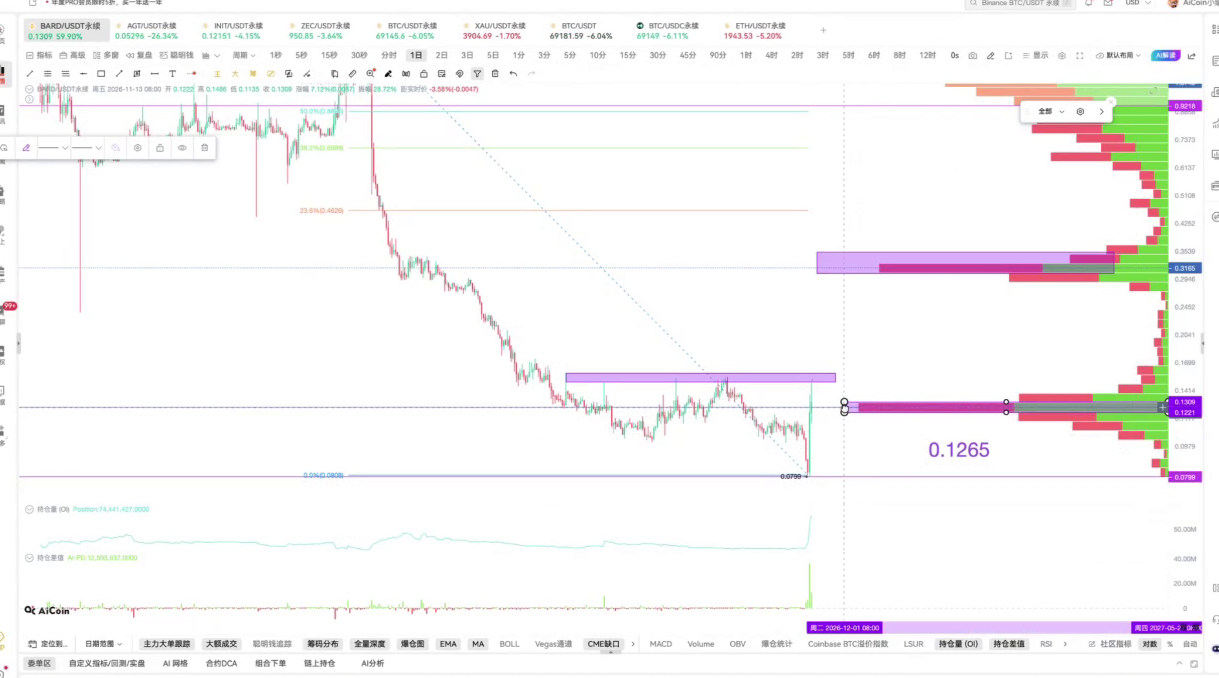
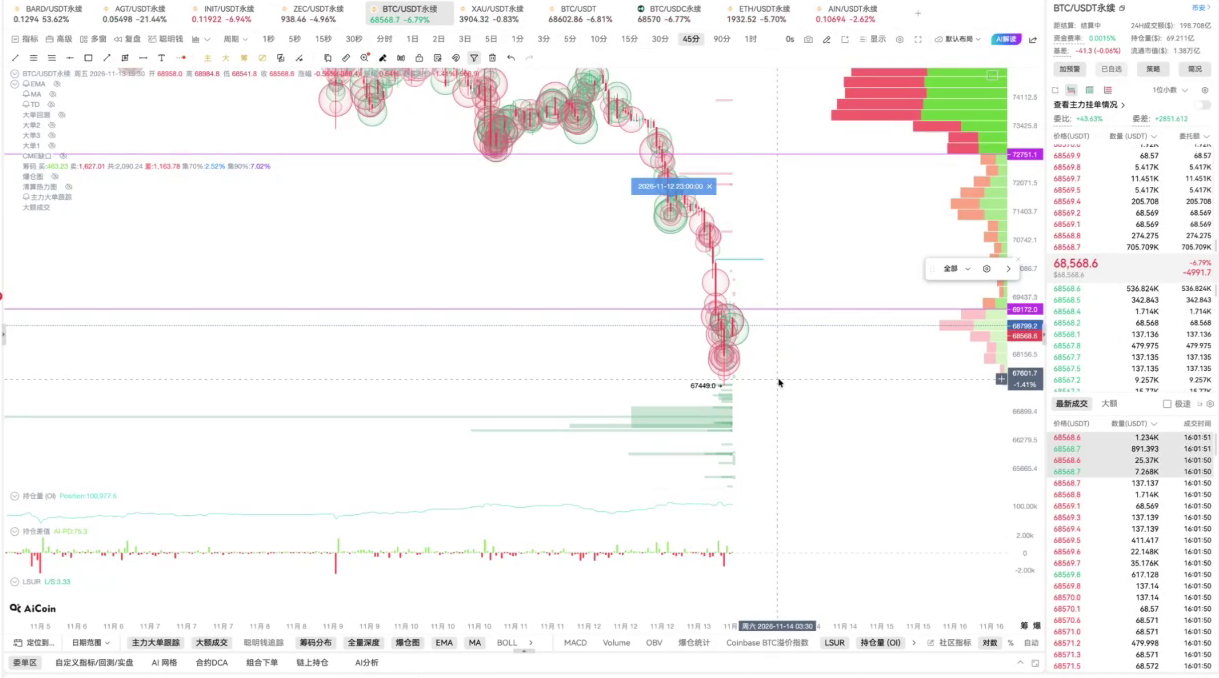
Taking BARD as an example, I will expand the chart to a larger timeframe, marking previous highs and lows, long wicks, and points where several attempts to rebound have failed, then overlay the distribution of chips to see where transactions were dense near those prices. When the price comes up from below, I pay attention to whether there is selling pressure. If the price is at the upper range, I'll look to see if there are buyers stepping in during the pullback. I'm more accustomed to defining a range, and I'll wait to see how the market reacts when we get to that area.
A wall looks big, but how much has been traded?
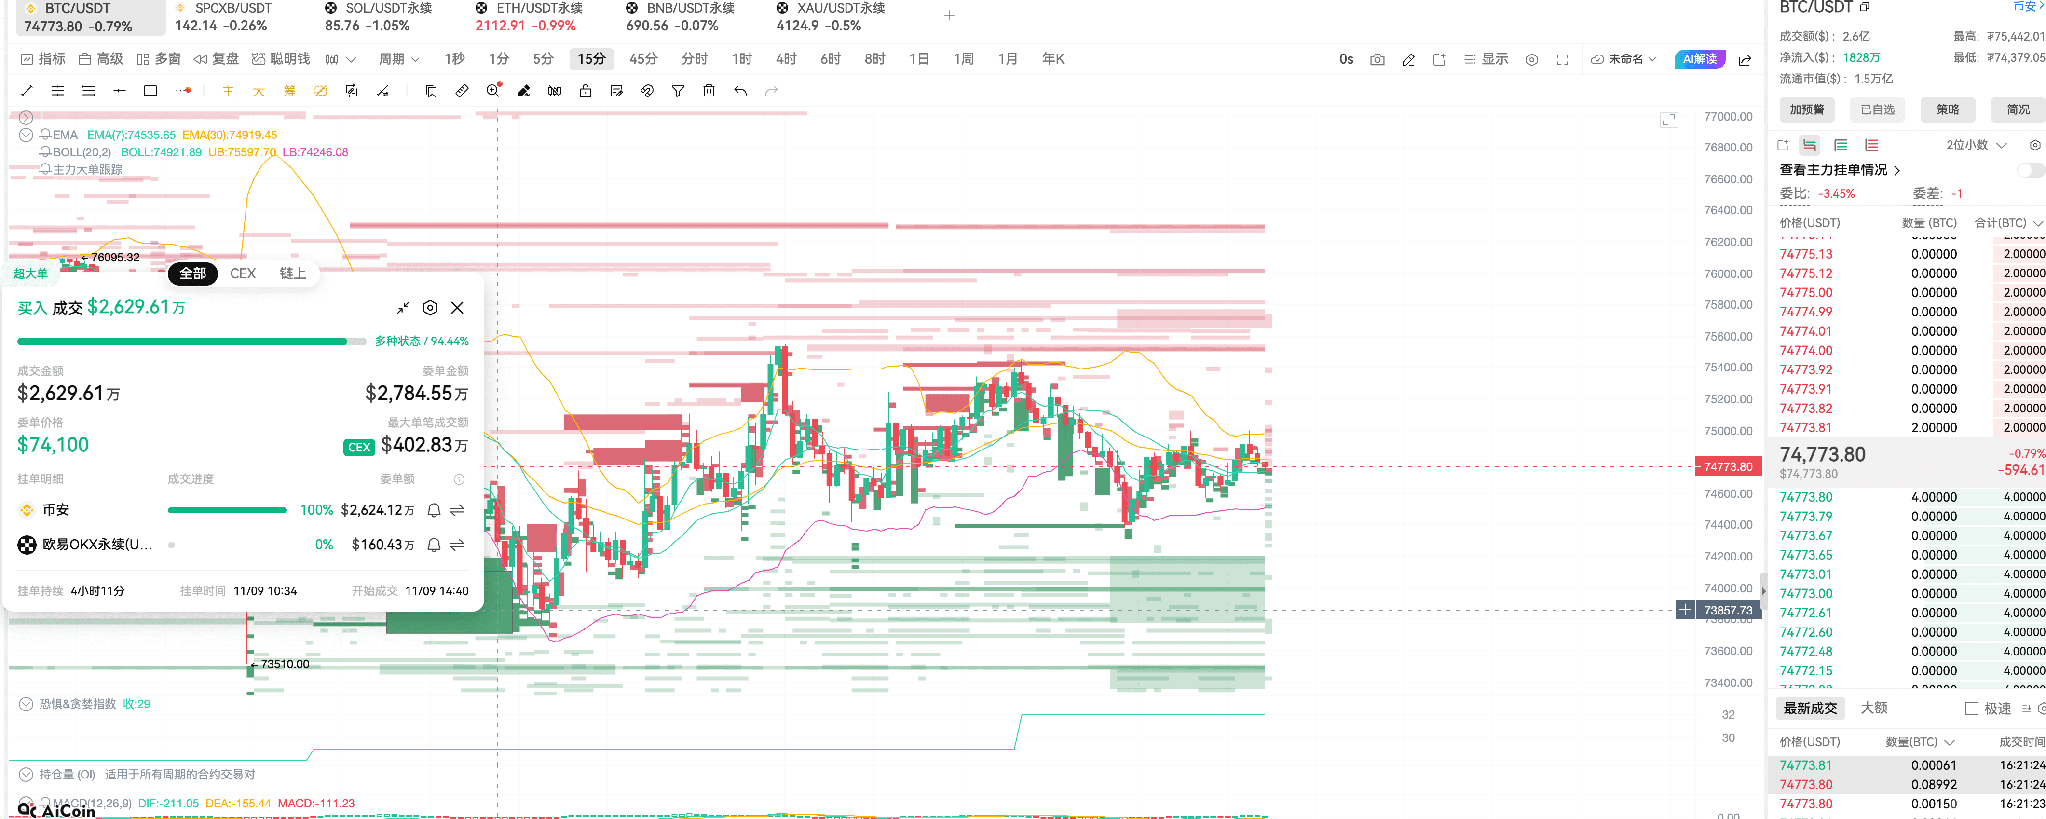
The long red and green wall on the order book represents limit orders placed in advance. The buy order in the chart is quite noticeable, but at the time the trading progress was 0%. Once the price approaches, I check whether it remains there, gets gradually eaten away, or is pulled down altogether. Even if I hit the buy wall, whether it can hold depends on actual transactions and price reactions.
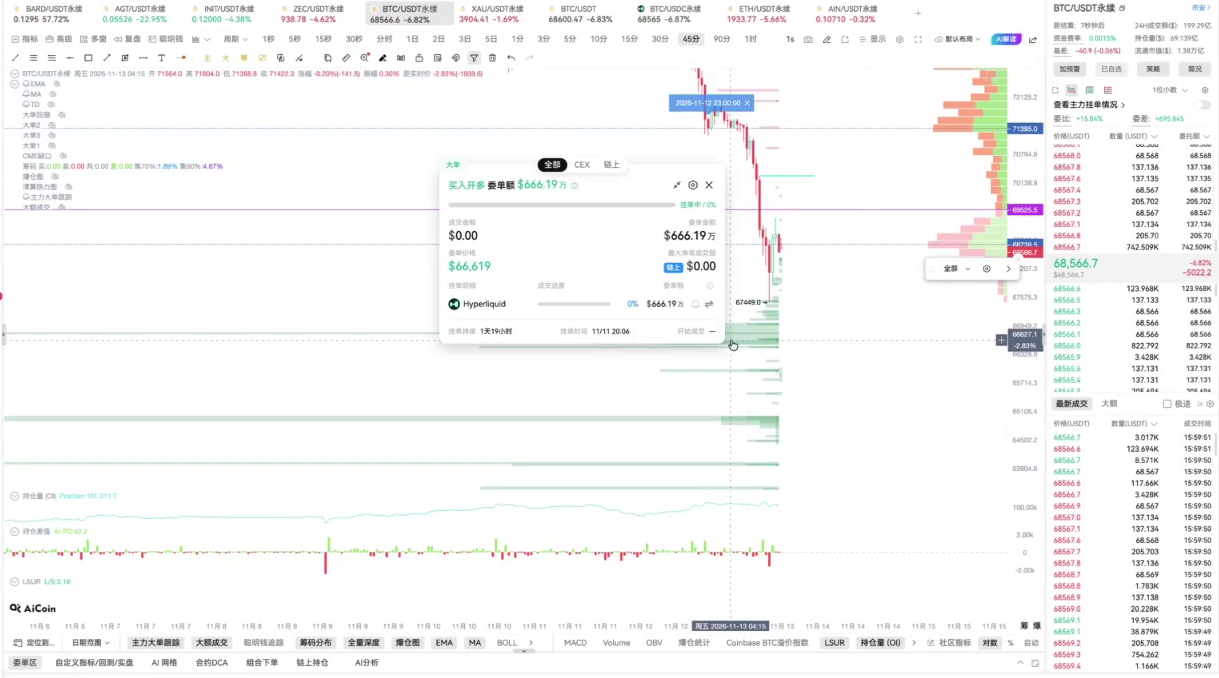
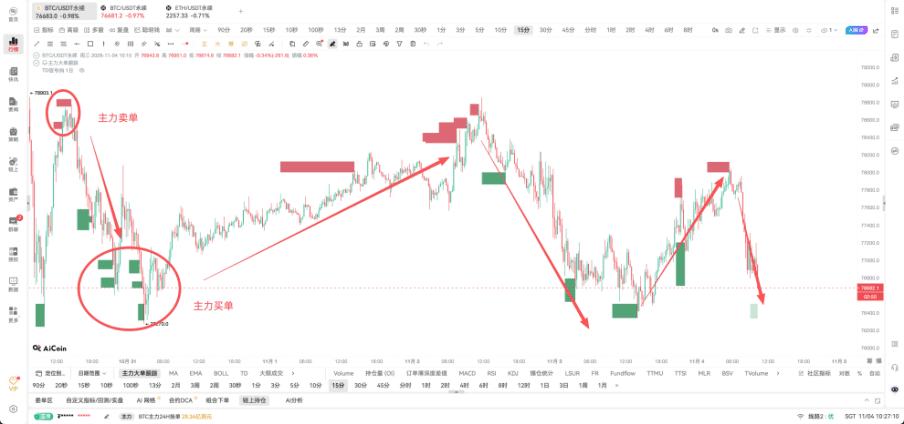
When analyzing mainstream coins like BTC, I track major orders alongside large trades. The former looks at the entries and exits, while the latter’s bubbles correspond to transactions that have already occurred. If the price hits a selling wall, I check for continuous active buying to absorb orders, and whether the price can still move up after that. Just looking at one order or bubble doesn’t tell me who is buying or selling or if it’s the same group of people—the market may not answer that.
In the moment of the surge, wait for the closing line
In a live stream, I analyzed a historical movement of AGT, with two resistance levels at around 0.08 and 0.085. During the session, there was a spike through the resistance level, but the closing didn’t stay above it, and the subsequent rebound failed to reclaim that position. When encountering such a chart, I prefer to wait for the closing of the selected timeframe before determining whether it can hold during a pullback or if it can reclaim the level on a rebound. Before opening a position, I make sure to clarify how the market should behave, so I know when to abandon my original judgment.
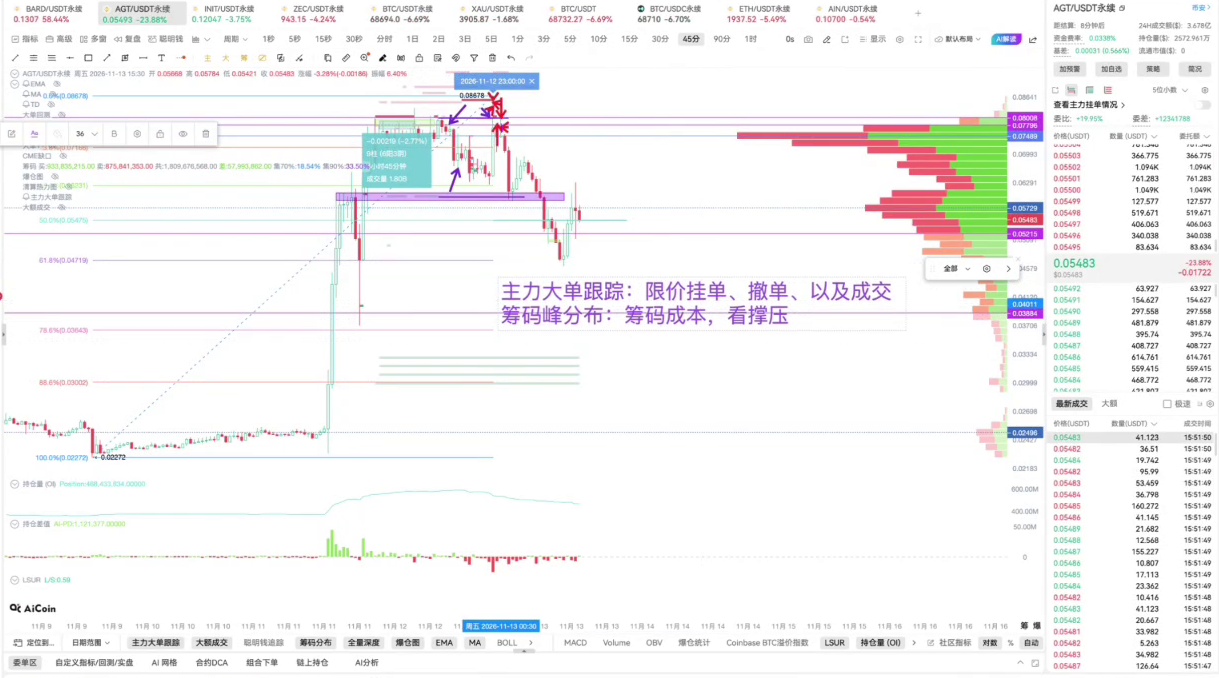
If I can't find an obvious order wall, I will use Fibonacci retracement to supplement my analysis. If I want to see support during a pullback after a rise, I'll pull from the low to the high of that segment. If I want to see resistance during a bounce after a fall, I'll pull from the high to the low. For something like 0.618, I will mark it first and then observe whether there are buyers or selling pressure as the price approaches.
Estimation of liquidation charts can also help me find target ranges. When the liquidation bands on both sides are obviously asymmetrical, I will note the edges of the dense areas first. When the price hits that, I wait for the closing to see if a new liquidation band forms. After concentrated liquidations, the market might reverse, so I’ll think ahead about how to exit when approaching the target.
The next time I see a hot coin surging on the list, I'll still ask myself these three questions: Are transactions keeping pace? Where are the recent supports and resistances? Given how it has performed, when do I need to admit I was wrong? If I can’t answer these, I let that big bullish candlestick fly for a while first.
Currently, there are daily live broadcasts; feel free to keep following AiCoin friends! Reserve a spot in advance👇
https://www.aicoin.com/zh-Hans/live/list?tab=upcoming
Join our community to discuss and become stronger together!
Official Telegram community:
AiCoin Chinese Twitter:
Hype rebate:
https://app.hyperliquid.xyz/join/AICOIN88
Binance rebate:
https://jump.do/zh-Hans/xlink-proxy?id=3
Invitation code: aicoin668
Coinbase rebate:
https://jump.do/xlink?checkProxy=true&proxyId=25
Invitation code: Y8L23JL
免责声明:本文章仅代表作者个人观点,不代表本平台的立场和观点。本文章仅供信息分享,不构成对任何人的任何投资建议。用户与作者之间的任何争议,与本平台无关。如网页中刊载的文章或图片涉及侵权,请提供相关的权利证明和身份证明发送邮件到[email protected],本平台相关工作人员将会进行核查。