Good morning, teammates, I am Qinglan Jie. This morning, two pieces of news hit us, each more heartbreaking than the last. The first, mining management software security vulnerabilities were exposed, 64,000 mining machines and 13EH/s computing power were hijacked and redirected. Although the Bitcoin protocol itself remains intact, mining confidence has been severely hurt. The second, North Korean hackers FaceDealer scheme stole 400 million US dollars in cryptocurrency assets over 18 months, frequent security incidents have directly intensified market risk aversion and capital outflow. Combined, these two news items, along with the extreme fear reading of only 10 on the fear and greed index, have brought market sentiment down to freezing point. But I want to remind everyone, the freezing point of sentiment does not equal the freezing point of price; we only recognize data and system signals.
Current Price and Time
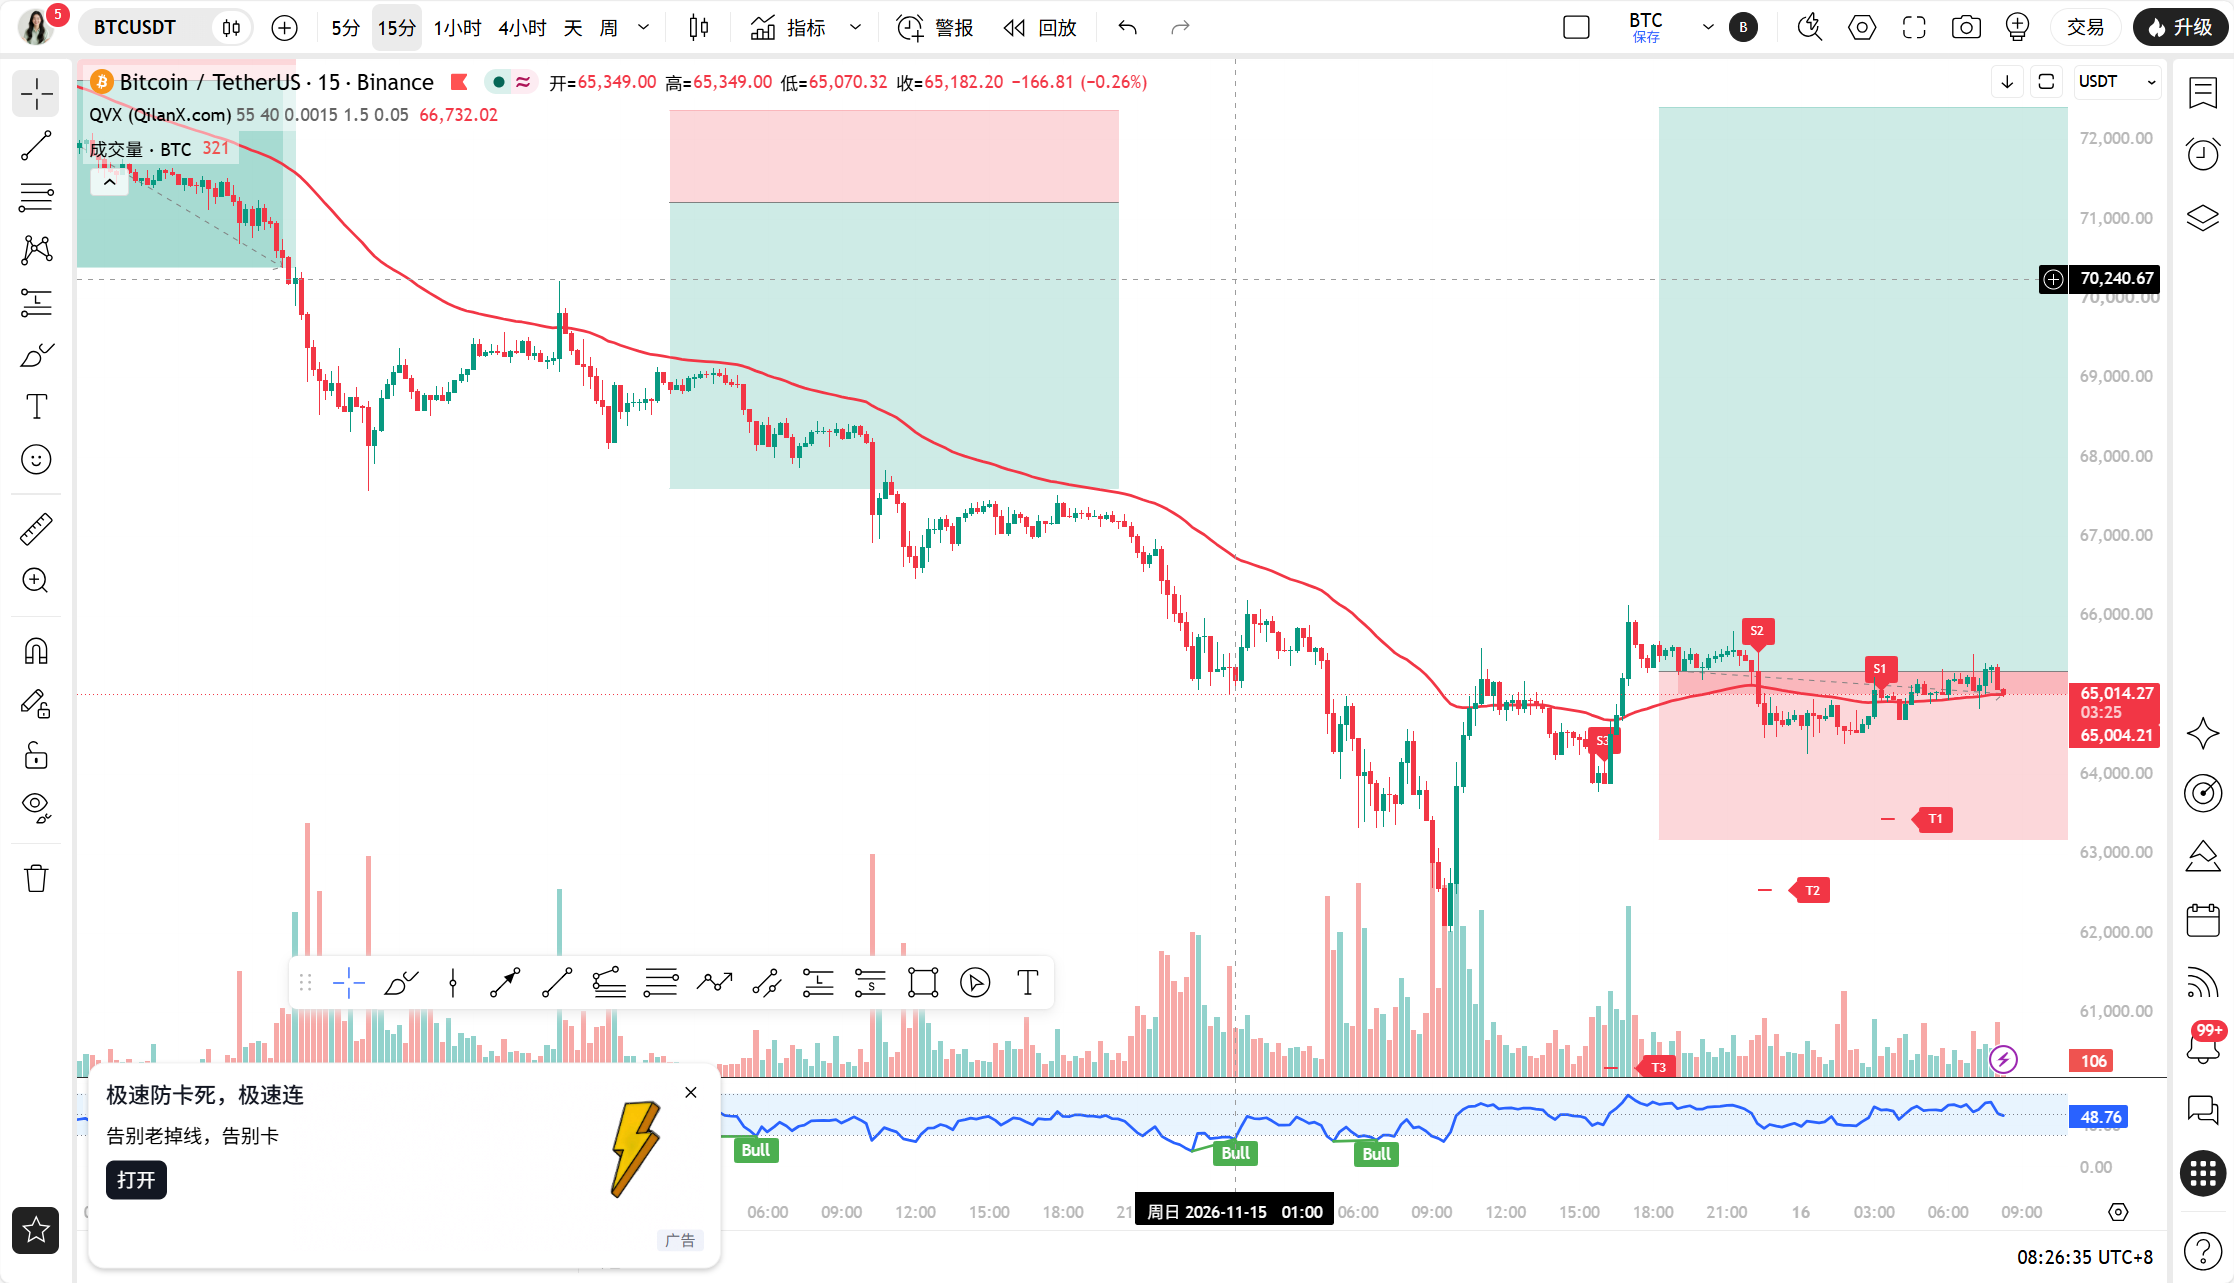
The current time is November 16, 08:26, with the BTC price at 64986 USDT. The 24-hour price change is 1.26%, and the market share is 59.34%. The price has been struggling from the low point area in July, with the daily RSI having crashed to 24.42, 4-hour RSI at 30.30, 1-hour RSI at 38.86, and 15-minute RSI at 44.36. Short cycle is undergoing repair, while the long cycle is still in deep waters. In this position, the most critical mistake is to bottom fish based on feelings.
Multi-Cycle State Overview
First, let's look at the daily chart. Daily MA5=66852.21, MA10=70815.97, MA30=76779.66, the moving averages are in a very standard bearish arrangement, with the price well below all three moving averages. On the daily MACD, DIF=-3804.45, DEA=-2672.92, bars=-1131.53, the negative bars are still expanding, and there are no signs of a golden cross. The daily RSI 24.42 is in the oversold zone, but oversold can become more oversold, and there is no evidence of a reversal in the daily bearish trend.
Next, look at the 4-hour chart. 4-hour MA5=65076.76, MA10=64984.20, MA30=68998.44, the short moving averages are starting to flatten and mingle, with the price tangled around MA5 and MA10, but MA30 is still high up, creating pressure. On the 4-hour MACD, DIF=-2018.56, DEA=-2121.80, bars=103.24, note that this is a positive bar, indicating that the 4-hour level's downward momentum is weakening and repair is needed, but both DIF and DEA are in the deep water area below the zero line, indicating this is just a rebound repair in a bearish trend, not a reversal.
At the 1-hour level. 1-hour MA5=65142.39, MA10=64939.98, MA30=64766.10, the short moving averages are showing the early signs of a bullish arrangement, with the price between MA5 and MA10. On the 1-hour MACD, DIF=-124.54, DEA=-229.26, bars=104.71, the positive bars continue, indicating there is rebound momentum at the 1-hour level. 1-hour RSI at 38.86 is weak but not oversold. The critical dividing line is here, 1-hour EMA55=66067.51, with the current price at 64986, a gap of 1.64% remains to EMA55, and the price is below EMA55.
At the 15-minute level. 15-minute MA5=65172.24, MA10=65167.27, MA30=64956.75, the moving averages are flat and mingling. On the 15-minute MACD, DIF=65.20, DEA=68.72, bars=-3.52, which just issued a death cross, indicating that short-term momentum is weakening. 15-minute RSI at 44.36 is neutral but weak. The 15-minute level presents high-level oscillations falling after a rebound.
TPV Signal Verification
According to the core rules of the Qinglan TPV system, we will verify each condition. Trend positioning first: the current price of 64986 is less than the 1-hour EMA55 of 66067.51, clearly indicating it is in the bearish trend zone. This point is indisputable.
Long conditions verification: The first condition requires two consecutive 1-hour candlestick closing prices greater than EMA55, the current closing price is 1.64% below EMA55, which does not meet the requirement. The second requires stable support, at the 1-hour level, there is MA30 support around 64766, but lacks clear signals of long lower shadows or bottom formations. The third, which states that downward momentum is weakening, is signaled by the continuation of the positive bar on the 1-hour MACD, and the RSI rising from a low position counts as a positive, but the first two hard conditions are not met, thus the long conditions are invalid.
Short conditions verification: The first condition requires two consecutive 1-hour candlestick closing prices to be less than EMA55. This one is satisfied, as the price has been below EMA55 continuously. The second requires pressure to face resistance, with the price rebounding to around 65172 (15-minute MA5) facing resistance and falling back, and the 15-minute MACD death cross indicates signs of resistance. The third states that rebound power is weak; the 1-hour MACD continuation of the positive bar does not currently satisfy this condition, indicating that rebound momentum has not entirely waned. Therefore, the short conditions are also not fully established, falling within the rebound repair phase of the bearish trend, pursuing a short position can easily lead to a hit.
Handling Oscillating Markets: Among the past 8 1-hour candlesticks, there are 0/8 closing prices above EMA55, and the number of crossings is 0, while the current price is 1.64% away from EMA55, which is far greater than the 0.3% threshold. The system clearly rules: does not comply with oscillation threshold, it is in a one-way trend. The direction of the one-way trend is bearish.
On-chain/Fundamentals
Fear and greed index stands at 10, extreme fear. This reading often corresponds to phase bottom areas historically, but note that it refers to areas, not points; extreme fear can last for several weeks. BTC's 24-hour change is 1.26%, indicating a weak rebound. The market share is 59.34%, and funds are not significantly flowing into altcoins, still taking refuge in BTC.
News and fund signals are very divided. On the bearish side: Coinbase Bitcoin premium index has been negative for 53 days, and US buying remains weak; there has been a net inflow of over 12,600 BTC into CEX in the past 7 days, with Binance leading, as a large influx of BTC into exchanges typically suggests an increase in selling intentions; Peter Brandt warns that a head and shoulders formation has formed. On the bullish side: CZ buys on dips and denies rumors of selling, Saylor again sends tracker signals hinting at continued accumulation, and Bisonte expects significant inflation decline next month. However, it should be noted that AguilaTrades increased by 1,000 BTC with 40 times leverage long positions reaching 130 million US dollars, and high leverage long positions are concentrated; if prices continue to drop, it may trigger a chain liquidation, which poses the largest short-term risk.
Key Attack and Defense Levels
Upper first resistance level: 1-hour EMA55 at 66067.51, this is the dividing line of the TPV system's long and short, and also the lifeline that I have repeatedly emphasized. If the price cannot hold above this, any rebound is just a repair. Second resistance level: daily MA5 at 66852.21, which is the first suppression at the daily level.
Lower first support level: 1-hour MA30 at 64766.10, as well as around 64984.20 for the 4-hour MA10, the current price is tangled in this range. Second support level: the psychological barrier at the round number of 64000. Third support level: the 58000 low point area mentioned in the news; if 64000 fails to hold, 58000 is the next target.
Trading Thoughts
Direction: Bearish trend zone, with the main idea of shorting on rebounds, and not actively bottom fishing for longs.
Entry conditions: Wait for the price to rebound to around 1-hour EMA55, specifically in the 66000 to 66100 range, and signal for resistance emerges from the 15-minute or 1-hour level, such as a top formation, a long upper shadow, bearish engulfing signals, along with a shortening of the 1-hour MACD positive bars before entering a short position. If the price directly breaks below 64766 and consecutively closes 2 1-hour candlesticks below, a light position can be pursued short, but with half the position size.
Stop-loss: Set the stop-loss for short positions above EMA55 specifically at 66200 USDT, which means if the 1-hour closing price stabilizes above EMA55, then stop-loss and exit; do not hold onto losing positions.
Target level: First target 64766 USDT, second target 64000 USDT, third target around 58000 USDT. Reduce half the position when reaching the first target, and adjust the stop-loss to protect profits on the remaining position.
If extreme conditions arise and the price stabilizes above 66067.51 with two consecutive 1-hour candlestick closes above it, the TPV system will switch to a bullish trend zone, at which point reevaluation will follow the long conditions without premature judgments.
Risk Warning
High-leverage long positions concentrated against extreme fear, any spike may trigger chain liquidations; strictly control position sizes, and stopping losses is always more important than targets.
Follow Qinglan Crypto Classroom to seize more trading opportunities! Welcome to visit the official website www.qinglan.org
📊 Qinglan TPV Trading Strategy Backtest Reference
🕒 Last Backtest Time 11-16 07:00:02
Total Analysis: 5149 Backtest: 5139 Accuracy Rate: 75.9% (3899/5139)
免责声明:本文章仅代表作者个人观点,不代表本平台的立场和观点。本文章仅供信息分享,不构成对任何人的任何投资建议。用户与作者之间的任何争议,与本平台无关。如网页中刊载的文章或图片涉及侵权,请提供相关的权利证明和身份证明发送邮件到[email protected],本平台相关工作人员将会进行核查。