Liying Bitcoin Chat: 11.16 Bitcoin (BTC) and Ethereum (ETH) Latest Market Analysis
Family! The current price of Bitcoin is 64750, how many people have turned from waiting to break even into cutting losses? But just yesterday, the price stopped falling around 62000, and with several consecutive bullish candlesticks, it slowly climbed back to 64640. Although it has only increased by 1.17%, this is the first time since the recent decline that it has returned above the short-term moving average. To put it bluntly, the most panicked period may have passed, but who dares to say that a bottom has been found now? The moving average system is still in a bearish arrangement with prices being pressed by three layers. The MACD has shown a key typical bullish crossover with the DIF crossing above the DEA. The price has rebounded from the lower track of 62871 to just below the middle track of 65658, and the bandwidth has begun to converge. The compression of volatility often breeds a change in trend. On the daily chart, 61956 is the lifeline for this round.
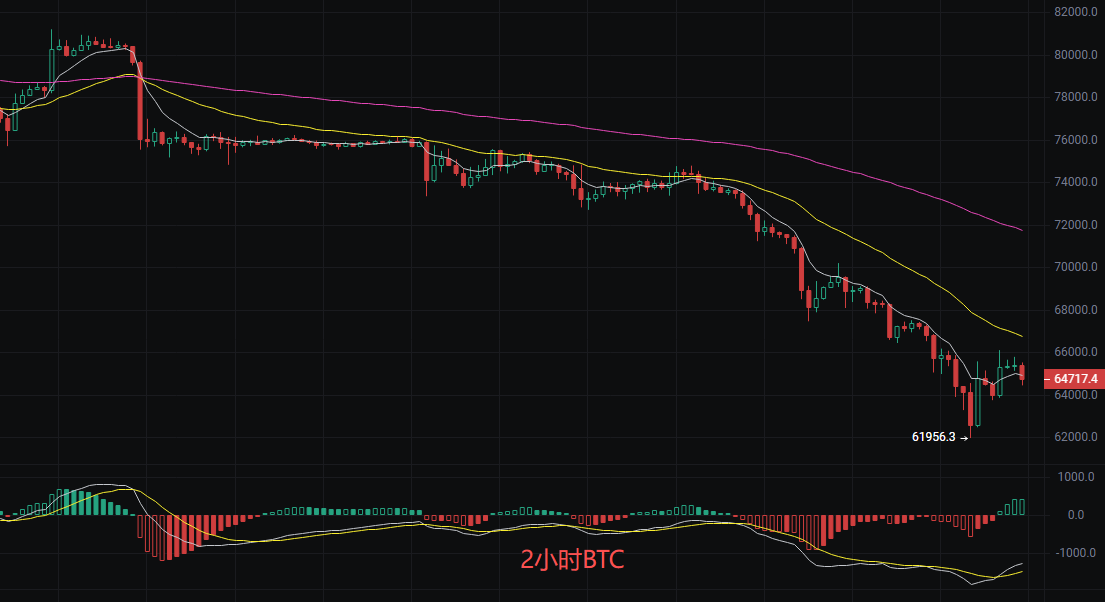
Bullish: Try entering long positions in batches from 64000-64300, with a stop loss at 61800, target 65600→66700, take profit partially.
Bearish: Short from 66700-67000, with a stop loss at 68200, target 64000→62000.
Position less than 20%, leverage less than 5 times. In a volatile market, only trade at the ends of the range, do not chase trades.
Ethereum
Family, the current price of Ethereum is 1810, today it dropped to a low of 1701, then pulled back looking still green, but the long lower shadow of the K-line indicates that there are people really buying at the 1700 level. Now is not the time to panic and cut losses, nor is it the time to blindly bottom fish. It's about clearly understanding: this wave of decline is trend-based, not just a brief dip. Those wanting to turn around will have to wait for the structure to develop, rather than gambling as the 2-hour level is still a standard bearish arrangement. Prices are being pressed down by three moving averages, and 1806 is just below the EMA7, indicating a weak consolidation. The MACD shows signs of a bullish divergence at the bottom, indicating that the downward momentum is waning. The Bollinger Bands have a middle track at 1839, upper track at 1948, and lower track at 1730, and the opening is converging. The price is operating close to the lower track and then returning to below the middle track, indicating a typical oversold rebound pattern.
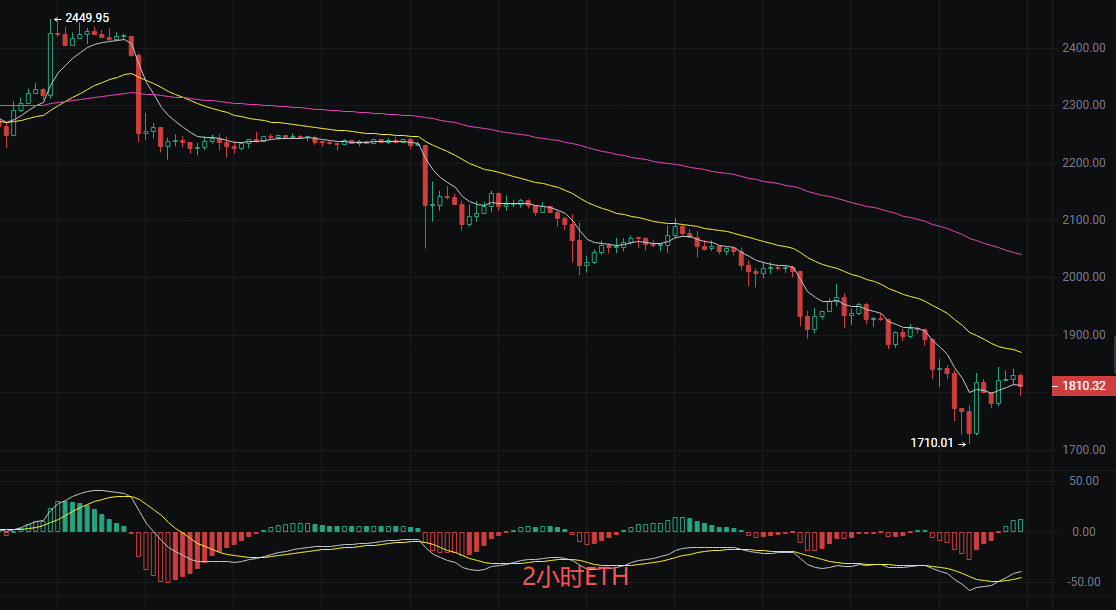
Short position: Short in batches from the 1916-1944 range, with a stop loss at 1980, target 1850, and if broken, look at 1780.
Long position: Lightly try long from 1820-1840, with a stop loss below 1790, target 1900-1916.
In a downtrend, seize rebounds, and do not exceed a 20% position, better to miss out than make a mistake. Wait for a reversal signal until the EMA7 crosses above the EMA30 and stabilizes.
The above content is exclusively original by Liying, please indicate the source for reproduction! Article publishing review has a time lag, and market conditions change rapidly, the above suggestions are for reference only and risk is borne by the reader.
免责声明:本文章仅代表作者个人观点,不代表本平台的立场和观点。本文章仅供信息分享,不构成对任何人的任何投资建议。用户与作者之间的任何争议,与本平台无关。如网页中刊载的文章或图片涉及侵权,请提供相关的权利证明和身份证明发送邮件到[email protected],本平台相关工作人员将会进行核查。