Cryptocurrency Scholar: After the bullish structure of Ethereum (ETH) was broken on November 15, what conditions need to be met for a daily level stop in decline?
How can there be so many new beginners coming into the cryptocurrency world when the market is in such a terrible state? For friends who are new to trading, it is suggested to first match the price levels and corresponding time periods in this article, understand what resistance, support, and stop-loss mean, and then consider practicing with small positions. The market changes every day; the levels written today may become invalid tomorrow, so you need to learn to adjust with the structure instead of stubbornly sticking to a number. Don't be afraid to deny everything during declines, and don’t be so optimistic during rises that you forget about risks.
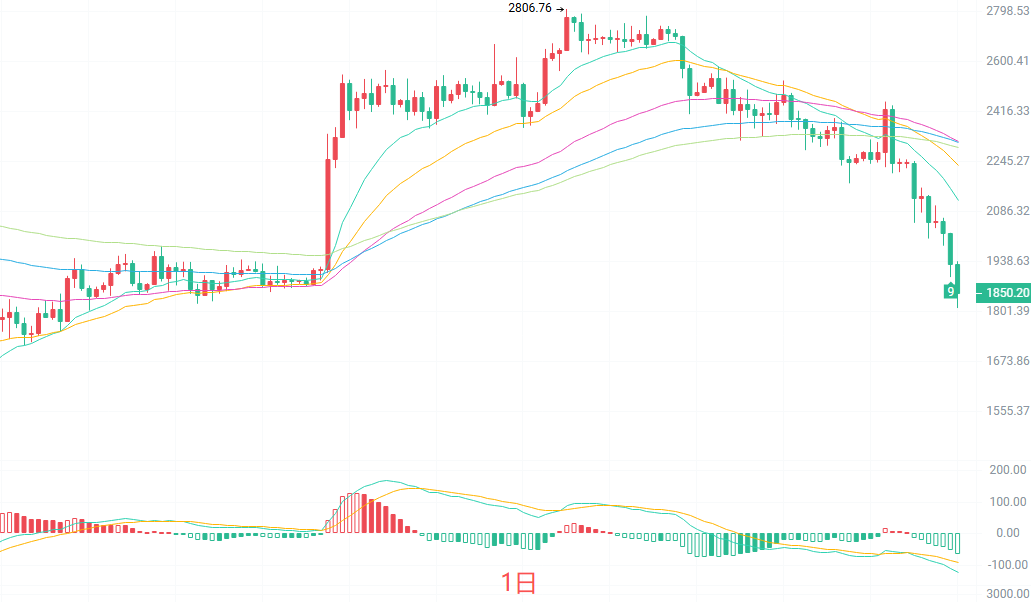
The daily K-line is currently operating below all EMA moving averages, with short to medium-term moving averages showing a bearish arrangement, and the daily bullish structure has been destroyed. In terms of MACD, the green bars are still being released, and bearish momentum has not yet shown significant exhaustion; the upper Bollinger band is at 2193, the middle line at 2486, and the lower line at 1900. The closing price has fallen below the lower band, indicating a weak state in the short term. The drop since the previous high of 2806 has formed a complete decline channel. If the rebound cannot regain the 1900-1938 range, it will be difficult to say that the daily level has stopped falling; initially, we look at the previous low support at 1809, and if it breaks down, we focus on the area around 1760 and the earlier 1503 region.
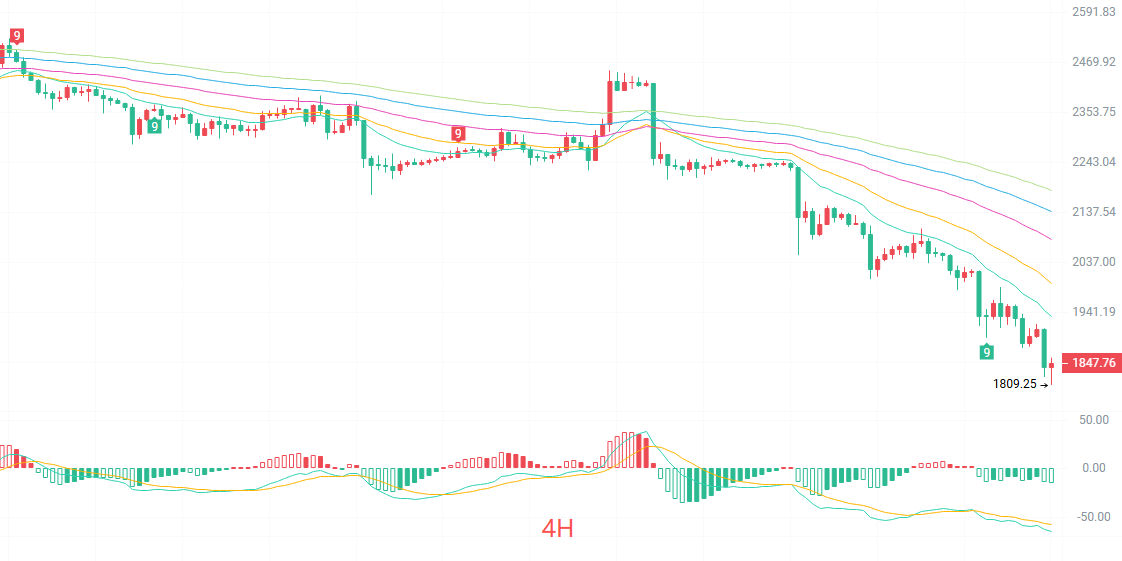
In the four-hour K-line moving average group, EMA15 is at 1931, EMA30 is at 1996, and EMA60 is at 2082, with prices below all moving averages, indicating a clear bearish trend. The MACD green bars have contracted in comparison to the previous segment, suggesting a temporary stabilization at the 1809 line, but the strength is weak, and a golden cross reversal has not yet formed. The lower Bollinger band is at 1821, the middle line at 1969, and the upper line at 2117, with prices operating close to the lower band, indicating a weak consolidation structure. In the short term, prices are moving in a narrow range between 1809 and 1841, and the TD sell count is still continuing; only by regaining above 1841 and further reclaiming 1931 can the short-term sentiment be considered repaired; otherwise, the rebound will still be easily suppressed by the moving averages.
Short-term reference:
A short-selling range from 1900 to 1950 is stagnating, with a stop-loss of 30 points and targets looking at 1850 to 1800, then breaking down to look at 1760.
Long position strategy: Aggressive traders can observe for stop-loss signals between 1809 and 1821 before lightly participating in the rebound, with stop-loss set below the round number 1800, targeting first at 1841, then looking at 1900-1931; if 1809 is effectively broken, it is not recommended to hold against the trend.
Specific operations should primarily refer to real-time data on the market; for more information, you can consult the author. There may be delays in article publishing; suggestions are for reference only and risks are borne by the reader.
Kind Reminder: The above content is simultaneously updated on major trading platforms such as Binance, OKEx, and Huobi. For more content, you can add me as a friend in OKEx and join my fan group.
免责声明:本文章仅代表作者个人观点,不代表本平台的立场和观点。本文章仅供信息分享,不构成对任何人的任何投资建议。用户与作者之间的任何争议,与本平台无关。如网页中刊载的文章或图片涉及侵权,请提供相关的权利证明和身份证明发送邮件到[email protected],本平台相关工作人员将会进行核查。