Cryptocurrency Expert: 11.15 Bitcoin (BTC) Overselling Does Not Equal a Bottom: What Confirmation Signals Are Needed for a Rebound?
The market is ruthless; at the position of 65300, being bullish is a bet on a rebound, while being bearish follows the trend. The two trading strategies have different cycles, so don't mix them. The most expensive phrase in a downtrend is "it has already dropped so much." Both lows and highs are determined by market movement, not guessing. Short-term traders should focus on the two lines at 64290 and 66800; if they break, execute the plan. For medium to long-term funds, save some bullets and wait for the daily moving averages to correct and the bottom structure to form before acting. There is no "holding on" in the face of leverage; spike warnings will not be given in advance.
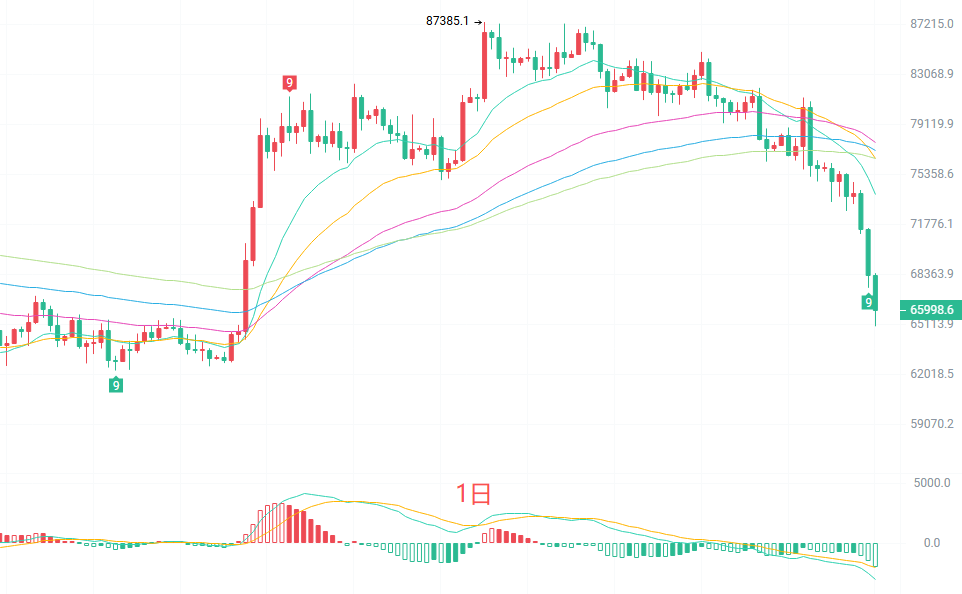
The daily candlestick shows a drop of 4.36%, down about 2974 points, with a fluctuation of 5.05%. In terms of moving averages, the price is located below all EMA lines; the short, medium, and long-term moving averages are in a bearish arrangement, with layers of resistance above. In terms of MACD, the dual lines are below the zero axis and opening downward, with momentum still leaning bearish. The Bollinger Bands have a middle line at 75935, an upper band at 83816, and a lower band at 68054, with the closing price having breached the lower band. It is currently oversold in the short term, but the trend has not reversed. In terms of daily structure, the previous high is 87385 and the previous low is 57758; it is currently in a downward channel following a high-level retracement, with no clear signal of a stop or reversal.
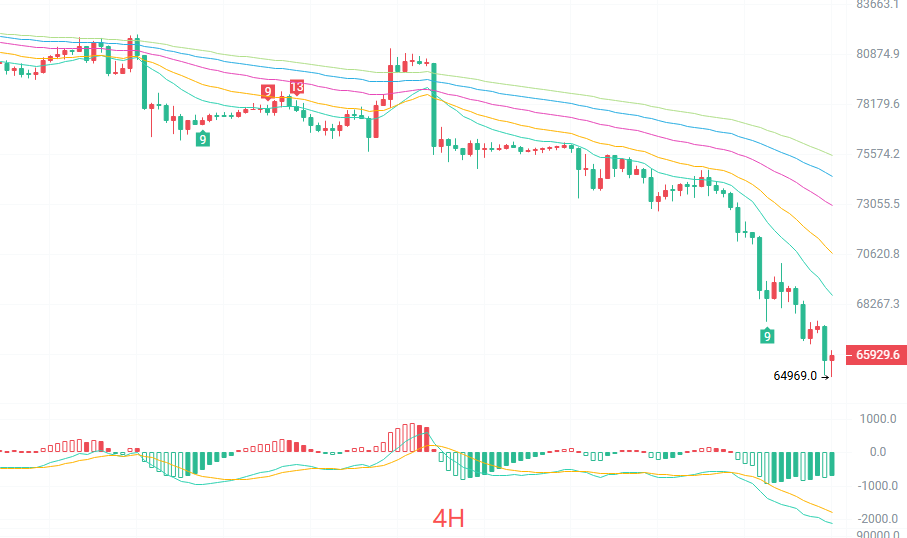
The four-hour candlestick's decline has slowed compared to the daily chart, but the price is still under moving average pressure. EMA15 reports 66781, EMA30 reports 70640, EMA60 reports 72962, EMA90 reports 74429, EMA120 reports 75504, with all five moving averages arranged from top to bottom, and the price running at the lowest level. Each upward movement in the rebound will face selling pressure from trapped positions. The MACD is below the zero axis; while the green bars have converged compared to the daily chart, there are no signs of a bullish crossover. The Bollinger Bands have a middle line at 70122, an upper band at 75954, and a lower band at 64290, with the current price near the lower band. The 64290 level is the short-term defense line at the four-hour level; if it breaks down effectively, downward space will reopen. If a stabilizing candlestick forms near the lower band, there is a chance to pull back and confirm pressure at the middle band.
Short-term reference:
Southbound from 67000 to 67500 stagnation, stop loss at 500 points, target looking at a breakdown from 65000 to 64300 to 63000.
At the current price, northbound trades are not recommended; instead, wait for two signals:
First, a price formation of a stop-loss pattern with volume in the 64290-64969 range rising back above 66800; then consider light long positions, with a stop loss below 64200.
Second, a direct deep drop to the 62000-63000 previous low range showing divergence and stabilization, then reassess the opportunity to go long.
Specific operations should be based on real-time market data; for more information, you can consult the author. The article has a delay in publication; suggestions are for reference only at your own risk.
Friendly Reminder: The above content is synchronously updated by the cryptocurrency expert on major trading platforms such as Binance, Ouyi, Huobi, etc. For more content, you can add me as a friend and join my fan group in Binance Ouyi.
免责声明:本文章仅代表作者个人观点,不代表本平台的立场和观点。本文章仅供信息分享,不构成对任何人的任何投资建议。用户与作者之间的任何争议,与本平台无关。如网页中刊载的文章或图片涉及侵权,请提供相关的权利证明和身份证明发送邮件到[email protected],本平台相关工作人员将会进行核查。