In the past 24 hours, two glaring news items have emerged in the market: one is the bloody liquidation data, and the other is the underlying institutional benefits. First, let's talk about the former. A total of $1.31 billion was liquidated in the last 24 hours across the network, with nearly 160,000 people being liquidated. This is the most severe long liquidation since the beginning of this downturn, and market sentiment has become weak to the point of being shatterable upon contact. Now, regarding the latter, the transaction threshold for Bitcoin ETFs has been directly reduced from a higher level to $1 million. This significant reduction in participation threshold means that more institutional funds have gained access to the market, which is a concrete incremental logic for the medium to long term. On one hand, short-term leverage is being bloodily washed out, while on the other hand, a medium-term funding entrance has been opened. This sense of tearing is precisely the core contradiction of the current market situation. Additionally, the remarks from the Fed's Collins about possible rate hikes exceeding expectations and the Coinbase Bitcoin premium index being negative for 51 consecutive days create intense hedging between short-term pressure and medium-term benefits. The Qinglan Crypto Classroom has always emphasized that news determines sentiment, while technical analysis determines positions; only when both resonate can high-probability opportunities arise. It is clear that we have not yet reached the point of resonance.
Current Price and Time
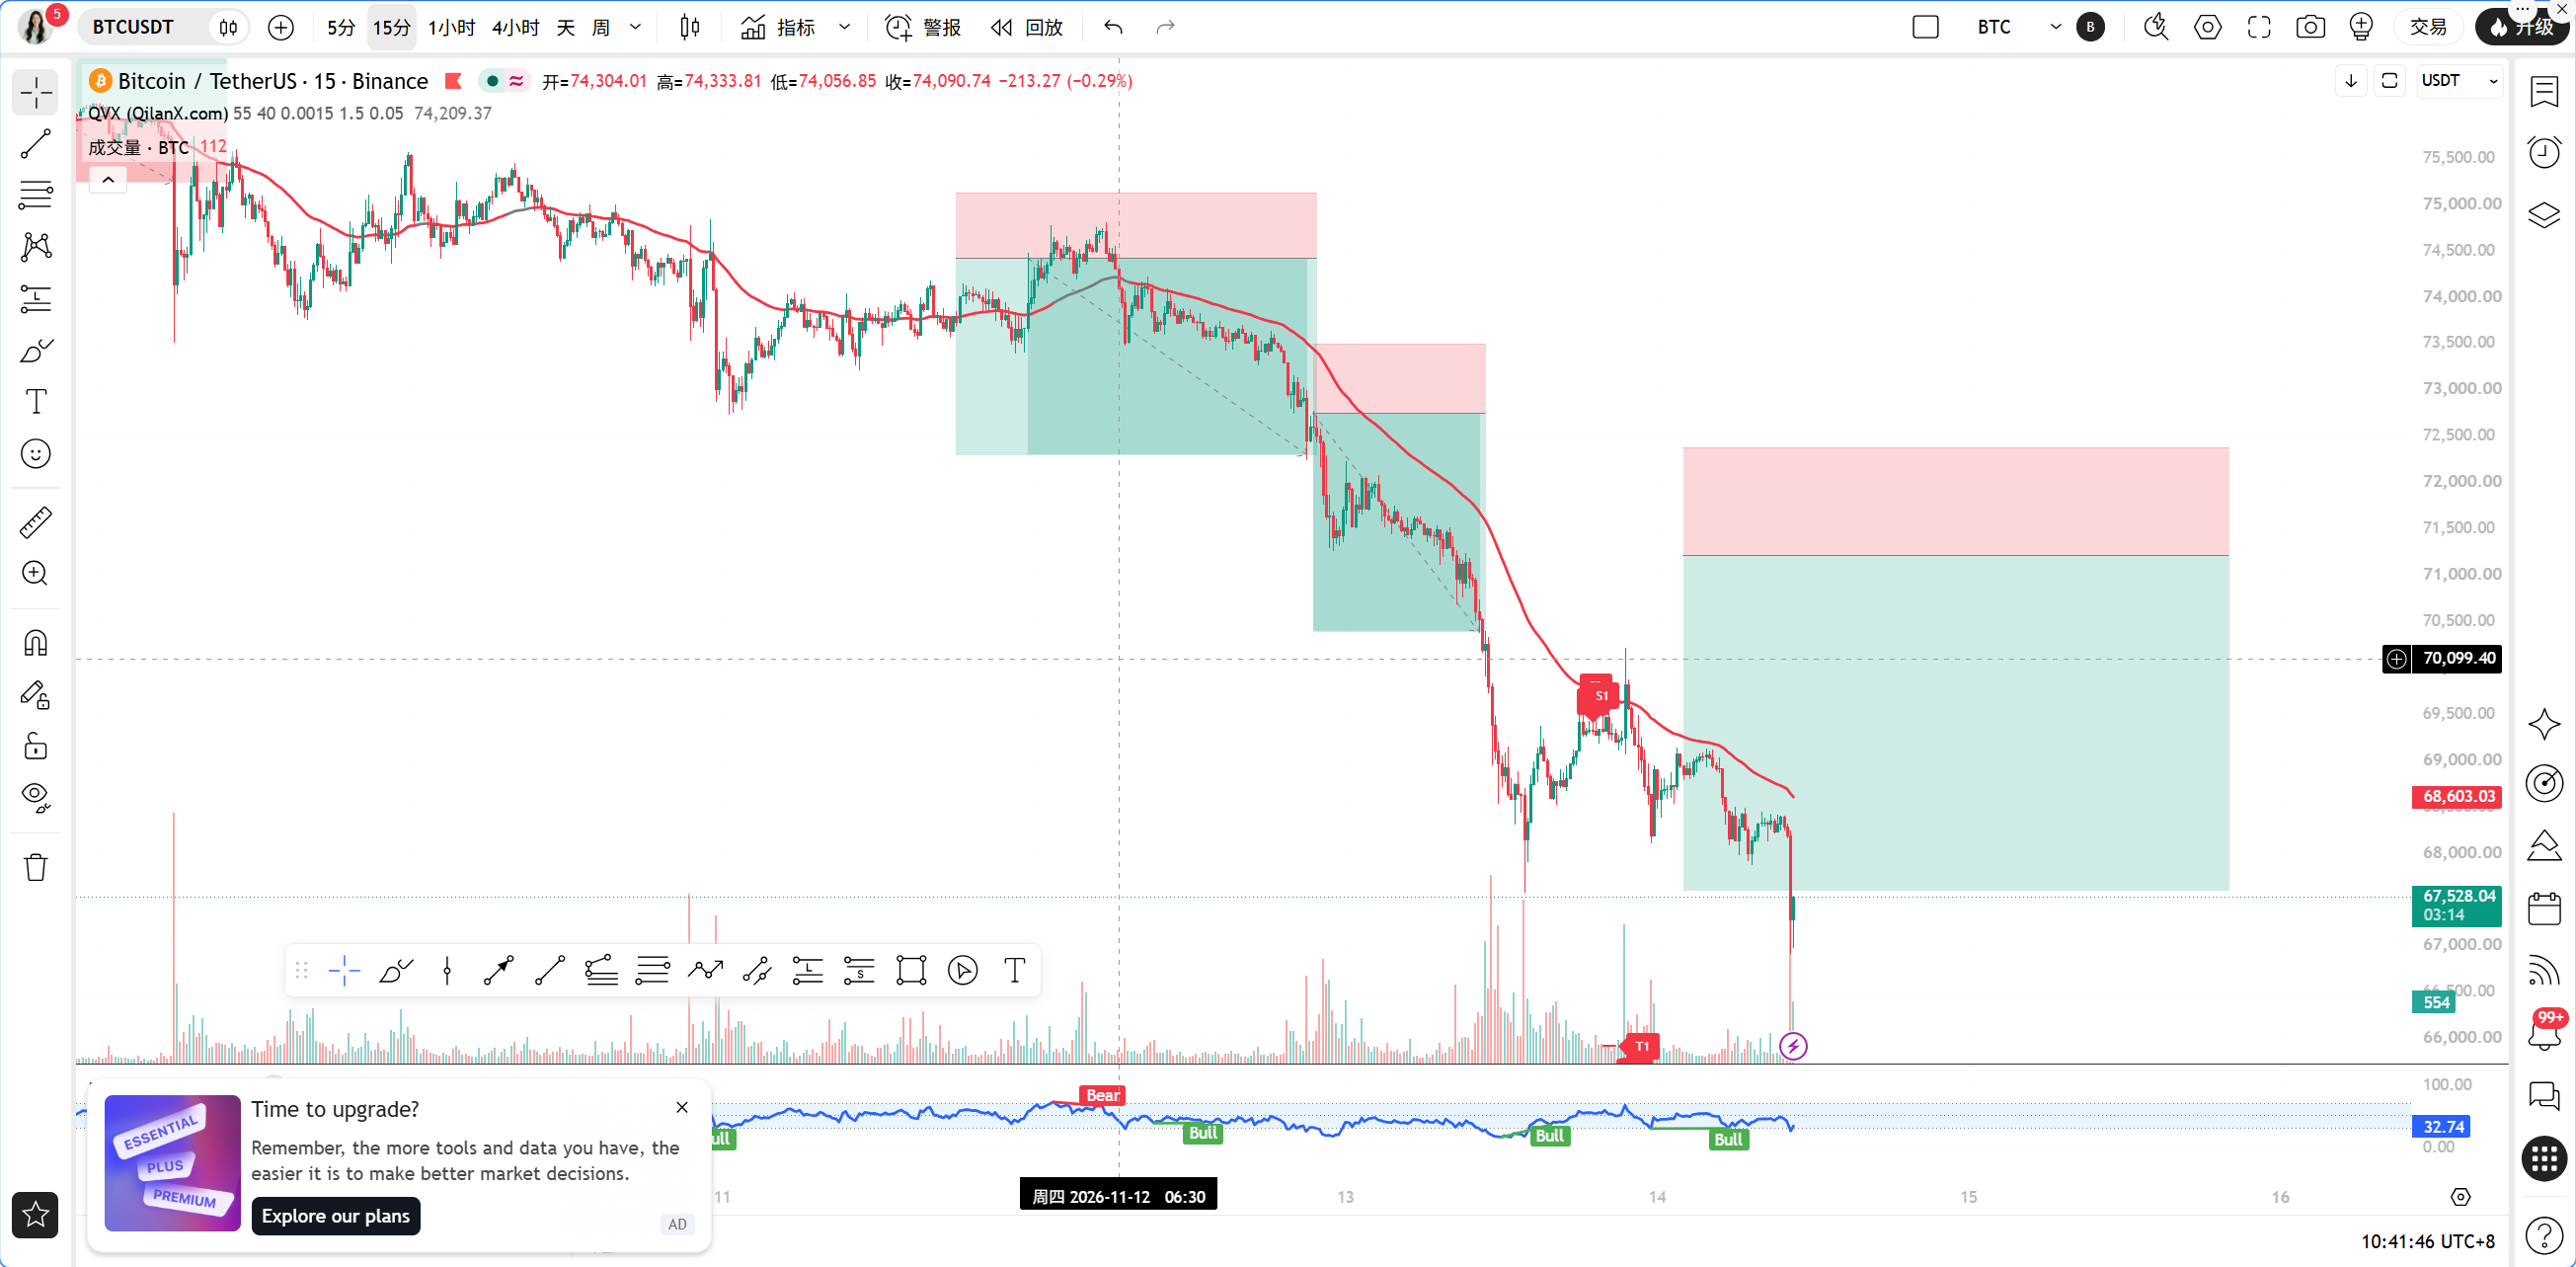
The current time is November 14, 10:42, and the latest BTC quote is 67,531 USDT. The 24-hour price change is -3.94%, and BTC's market share is 58.94%. The Fear and Greed Index is at 13, indicating a state of extreme fear. This number is crucial; extreme fear often corresponds to a phase of bottoming out, but please note that extreme fear can last a long time. It is not a buy signal; it merely tells you not to chase short positions when emotions are at their most fearful.
Multi-Cycle Status Overview
First, let’s look at the daily chart. MA5=71,023.24, MA10=73,313.57, MA30=77,984.68, with moving averages exhibiting a standard bearish arrangement, and prices are far below all three moving averages. Regarding the MACD, DIF=-2,909.39, DEA=-2,056.79, Histogram=-852.60, with no crossovers and bearish momentum still being released. The daily RSI=25.47 is in the oversold zone but has not yet shown divergence. Daily conclusion: the bearish trend is clear; being oversold does not signify a reversal.
Next, the 4-hour chart. MA5=68,624.67, MA10=69,553.92, MA30=72,618.55, also exhibits a bearish arrangement. The MACD's DIF=-1,771.13, DEA=-1,401.65, Histogram=-369.48, with no crossovers. The 4-hour RSI=10.25 is extremely rare, indicating a severe oversold condition at the 4-hour level, and a technical rebound may occur at any time, but a rebound does not equal a reversal. 4-hour conclusion: a state of extreme oversold within a bearish trend.
Next, the 1-hour chart. MA5=68,146.80, MA10=68,504.00, MA30=69,233.61, prices are operating below the moving averages. The critical demarcation line EMA55=70,415.89, with the current price of 67,531 still having a 4.10% gap from EMA55, remaining in the bearish region. MACD's DIF=-691.49, DEA=-705.28, Histogram=13.80; note that the histogram has turned positive, indicating signs of exhaustion in 1-hour downward momentum. The 1-hour RSI=24.63 is also in the oversold area. 1-hour conclusion: bearish region, but momentum is beginning to wane.
Finally, the 15-minute chart. MA5=67,935.13, MA10=68,121.11, MA30=68,393.91, prices are entangled near the short moving averages. MACD's DIF=-223.00, DEA=-162.34, Histogram=-60.66, still negative. The 15-minute RSI=38.26 has rebounded slightly from the oversold zone. 15-minute conclusion: low-level oscillation recovery, not yet forming a clear direction.
TPV Signal Validation
According to the core rules of the Qinglan TPV system, we will verify each condition. In terms of trend positioning, the current price of 67,531 is clearly below the 1-hour EMA55 of 70,415.89, placing it in the bearish trend zone, with no dispute about this.
Long position condition verification: The first requirement is that two consecutive 1-hour candle close prices must stay above EMA55. The current price is 4.10% away from EMA55, and there have been 0 occurrences out of the last 8 hour candle closes above EMA55 with 0 crossovers; the first condition is completely unmet. The second condition is support stabilizing; the 1-hour chart has not shown a clear long lower shadow or confirmation of a bottom formation. The third condition is that downward momentum is exhausted; the 1-hour MACD histogram has shortened continuously and turned positive to 13.80, and the RSI has risen from a low of 24.63, this condition is partially satisfied. Of the three conditions, only one is met, so the long signal does not stand.
Short position condition verification: The first requirement is for two consecutive 1-hour candle close prices to be below EMA55, with the current price well below EMA55, so this condition is met. The second condition is for pressure to encounter resistance, with prices at a low point rather than a high point, not constituting an effective resistance pattern. The third condition is for the rebound to be weak; the positive histogram on the 1-hour MACD shows that downward momentum is exhausting, not fulfilling the weak rebound condition. Of the three conditions, only one is met, so the short signal also does not stand.
Oscillation Market Judgment: Out of the past 8 hour candle closes, there have been 0 occurrences above EMA55, and 0 crossovers; the current price is 4.10% away from EMA55, far exceeding the 0.3% oscillation threshold, not fitting the definition of oscillation, thus the system judges it to be in a unilateral trend. Overall, the TPV system currently signals: the bearish trend is clear, but neither side's entry conditions are fully satisfied, characteristic of a typical signal vacuum period, when the worst thing to do is to rely on feelings to chase rebounds or short positions.
On-chain/Funding Analysis
The Fear and Greed Index is at 13, indicating extreme fear, which is an extreme emotional region. The Coinbase Bitcoin premium index has been negative for 51 consecutive days, indicating that buying activity in the U.S. market continues to weaken, which is a true reflection of the demand side. In terms of funding rates, both BTC and ETH have entered a bearish range, indicating strong bearish sentiment in the derivatives market. The market maker Wintermute has increased shorts by $18.26 million, raising the short positions to $90.71 million. Smart money is still adding to shorts in the short term. On the other hand, JPMorgan has increased its strategy by 36% in the third quarter, with Bitcoin ETF holdings reaching $540 million, indicating traditional institutions are accumulating during dips. Additionally, there is an on-chain alert as a Bitcoin address dormant for 16 years transferred out 100 BTC, worth $6.9 million now, a move by a long-term whale often signifies potential selling pressure. The overall funding situation shows a differentiation pattern where the short-term leans bearish, and medium-term institutional investors are accumulating on dips.
Key Defensive Positions
The first defense line above is at 70,415.89, where the 1-hour EMA55 is located, marking the TPV system's bullish-bearish demarcation line. The price must rise above and stabilize on this line to discuss trend reversals. Above this is the 4-hour MA5 at 68,624.67 and the daily MA5 at 71,023.24, creating layers of pressure. To the downside, support is first targeted at the 65,000 integer level, which is also the down target mentioned in the news. If broken, it opens up a deeper space. The current price of 67,531 is in a dilemma, with 4.10% space from the upper EMA55 and 3.75% space from the lower 65,000, representing a typical middle ground.
Trading Strategy
Direction: The current TPV system determines it is in a bearish trend zone, but both bullish and bearish entry conditions are incomplete. The main tone is to observe and wait, not to actively chase shorts or blindly bottom-fish.
Entry Conditions: For long positions, one should wait for prices to rebound near the 1-hour EMA55 and show two consecutive 1-hour candle closes above it, while also coinciding with a bottom formation or confirmation of a long lower shadow pattern. The MACD histogram must continuously shorten; only then can a light long position be attempted. For short positions, one should wait for prices to retrace to the range of 68,600 to 69,200, near the 4-hour MA5 and the 1-hour MA30, showing a long upper shadow or a top formation encountering resistance, and the 1-hour MACD histogram must weaken again, then one may consider a short position accordingly.
Stop Loss: For longs, place the stop loss about 1.5% to 2% below the entry structure low, exit if breached. For shorts, place the stop loss about 1.5% above the retracement high, to prevent false breakthroughs.
Target Positions: For long positions, the first target is around 68,600, and the second target is near the EMA55 area of 70,400. For short positions, the first target is the integer level of 65,000, and the second target is near 64,000.
Risk Warning
Extreme fear combined with a 4-hour RSI of only 10.25 indicates that a violent rebound may occur at any time in the short term. Those chasing shorts against the trend must strictly adhere to stop losses and must not hold losing positions.
Follow Qinglan Crypto Classroom to grasp more trading opportunities! Welcome to visit the official website www.qinglan.org
📊 Qinglan TPV Trading Strategy Backtesting Reference
🕒 Last Backtesting Time: 11-14 07:00:02
Total Analysis: 5104 Backtesting: 5094 Accuracy: 75.7% (3857/5094)
免责声明:本文章仅代表作者个人观点,不代表本平台的立场和观点。本文章仅供信息分享,不构成对任何人的任何投资建议。用户与作者之间的任何争议,与本平台无关。如网页中刊载的文章或图片涉及侵权,请提供相关的权利证明和身份证明发送邮件到[email protected],本平台相关工作人员将会进行核查。