Liying Chat Currency: 11.14 Bitcoin (BTC) and Ethereum (ETH) Latest Market Analysis
Family! The current price of Bitcoin is 68,500. In the past half month, Bitcoin has fallen from 81,188 all the way down to 67,449. The big bearish candle on the 2-hour chart looks like a knife stabbing down. How many people have been liquidated, how many people have cut their losses? The comments section is filled with wails. But you must see clearly, the current price of 68,800 has rebounded more than 1,300 dollars from the lowest point, indicating that there is capital supporting this position. During times of panic, it is often others picking up your bloodied chips. The 2-hour MACD shows a typical bearish dominance pattern, but the green bars have clearly shortened, indicating that the downward momentum is fading. The Bollinger Bands are widely open, the price has run along the lower track and has started to diverge, with the middle track at 71,244 being strong short-term resistance. All three EMA lines are diverging downward, which is a standard bearish arrangement, and a rebound near EMA7 is likely to encounter resistance.
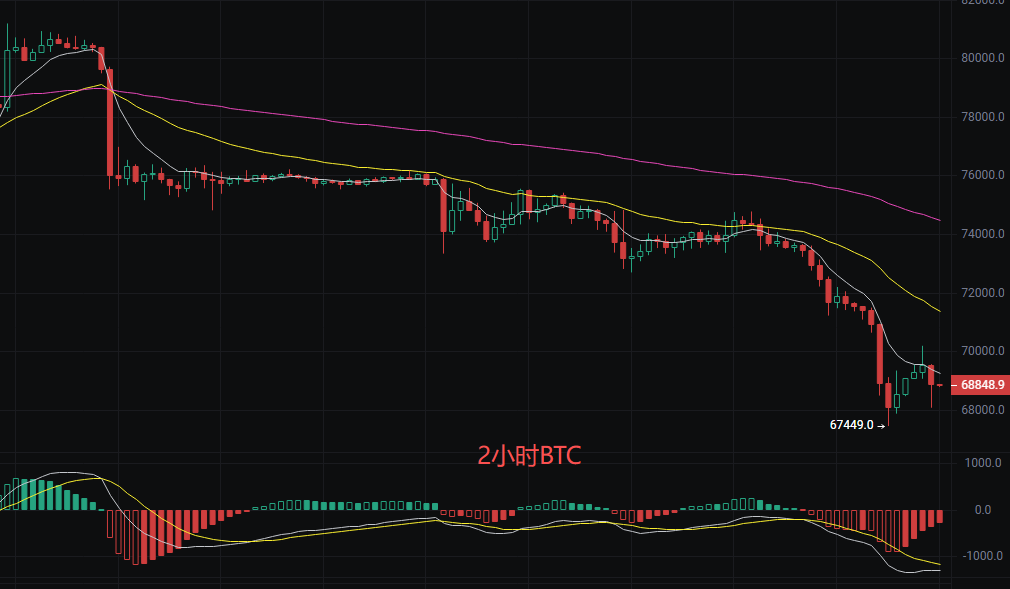
Long Position: Lightly test long at 68,000—68,300, stop loss at 67,400, target at 70,500→71,500
Short Position: Short in batches at 71,200—71,500 on the rebound, stop loss at 72,300, target at 68,800→67,400
The trend has not reversed, only do short positions on the rebound, do not get too attached
Ethereum
Family, the current price of Ethereum is 1,930. It has fallen from 2,449 all the way down, touching a low of 1,893 with almost no decent rebound in between. Many people have bottom-ticked at halfway and are cutting losses at the floor price. Now the price is stuck at 1,931, looking like it has stopped falling, but would you dare to enter with a heavy position? You wouldn’t. This is how the market works: when it falls, everyone shouts it is cheap, but when it comes to it, everyone becomes timid. From the high on November 5, the decline has exceeded 21%, which is a typical acceleration in decline before entering a consolidation. The next few days are crucial; either a strong upward move or breaking the previous low again, there is no middle ground. The three EMA lines show a standard bearish arrangement, and the MACD red bars are continuously shortening, signaling a decline in downward momentum. The middle Bollinger Band is at 1,997, the upper band at 2,088, and the lower band at 1,905. The price has run along the lower band and is starting to revert to the middle band, with slight signs of convergence in the band, which usually indicates that volatility is about to choose a direction. Overall, it is a repair stage at the end of the bearish trend.
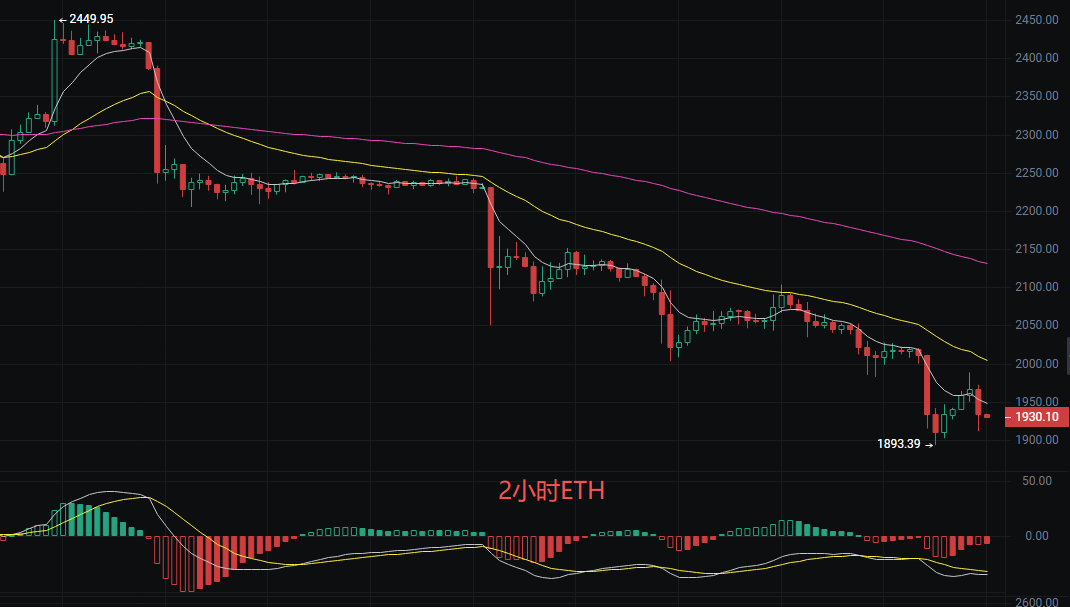
Long Position: Lightly test long at 1,900-1,915, stop loss at 1,885, targets at 1,997, 2,050
Short Position: Short in batches at 2,010-2,030 on the rebound, stop loss at 2,055, targets at 1,920, 1,893
Key: 1,893 is the life and death line; defend the bottom-building, if broken look at 1,800. Single position not exceeding 10%, only do short-term trades
The above content is exclusively authored by Liying, please indicate the source when reprinting! There may be a delay in article publishing and review, market conditions change rapidly, and the above suggestions are for reference only at your own risk.
Friendly Reminder: The above content only comes from Liying's public account: Crypto Training Camp, which is created by the author. The ads at the end of the article and in the comments section are unrelated to the author, please discern carefully, thank you for reading.
免责声明:本文章仅代表作者个人观点,不代表本平台的立场和观点。本文章仅供信息分享,不构成对任何人的任何投资建议。用户与作者之间的任何争议,与本平台无关。如网页中刊载的文章或图片涉及侵权,请提供相关的权利证明和身份证明发送邮件到[email protected],本平台相关工作人员将会进行核查。